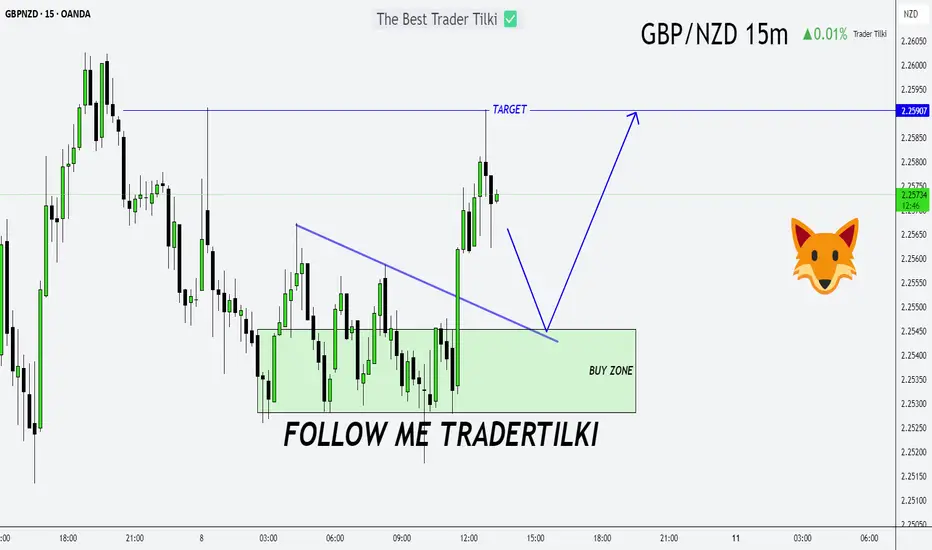
Forecast in, Profits Out: GBPNZD Entry & Target RevealedHello my dear friends,
I’ve prepared an analysis for the GBPNZD pair. I share these insights to help you earn money from the markets.
First and foremost, let’s remember this: as traders, we only forecast market structure. We prepare our analysis and trade based on predictions. But in the end, whatever the whales want—*that’s* what happens. Never forget that.
From time to time, we may be wrong in our analysis, and that’s perfectly okay. What truly matters is that our losses never exceed our gains.
Now, let’s get to the point:
I plan to open a buy position on GBPNZD around the 2.25455 or 2.25282 levels. After entering the trade, my target will be 2.25907.
Every single like you send is my biggest source of motivation to keep sharing these analyses. Thank you so much to everyone who supports me with a like!
Orderblock
USDCAD's Opportunity Bell Is Ringing — Don’t Miss Out!Hey there, my valued friends!
I’ve prepared a fresh USDCAD analysis just for you.
📌 If the 1.37245 level breaks, the next target will be 1.38000.
Every single like you send my way is the biggest motivation behind sharing these analyses.
🙌 Huge thanks to each and every one of you who supports me!
Would you like to add a visual or a catchy headline to boost engagement even more? I can help with that too.

Volatile Times for GBPJPY: What’s Going On Behind the Moves?Good morning, Guys,
I’m anticipating a new short opportunity on GBPJPY once the pair reaches my sell zone level. From there, my target is set at 197.934.
Every like from you is what truly motivates me to keep sharing these insights.
Massive thanks to everyone who shows love and support!

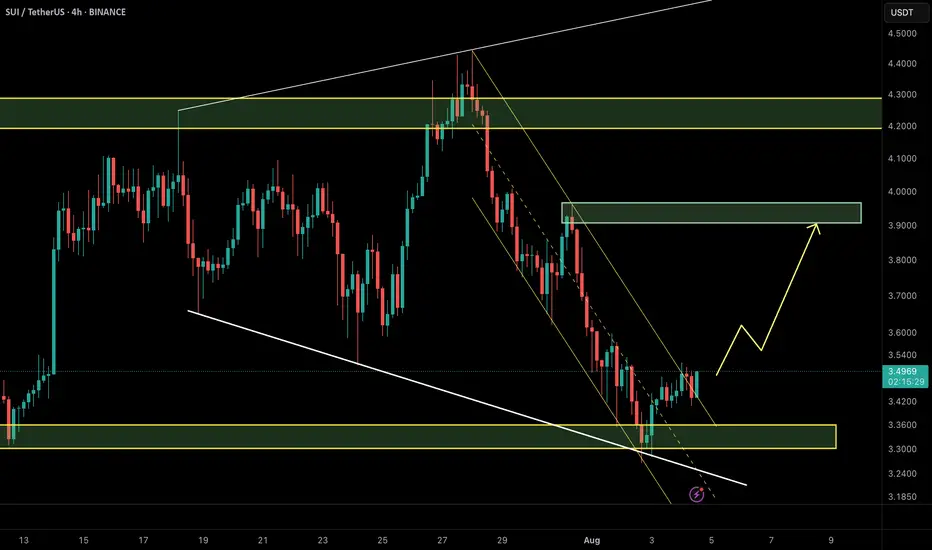
SUI/USDT – Price Outlook (2H TF)🔍 Updated Aug 4, 2025 | SMC + NeoWave
SUI has broken out of the descending channel and is currently holding above the strong demand zone around $3.35–$3.40. This zone overlaps with a bullish order block and prior trendline support.
📌 Bullish Scenario (preferred):
Price confirms support → Push toward $3.90–$4.00 supply zone.
📌 Invalidation:
A close below $3.35 invalidates the setup and suggests continuation of the correction.
💡 Tip: A breakout of structure (BOS) + mitigation of OB = solid confluence for long setups.
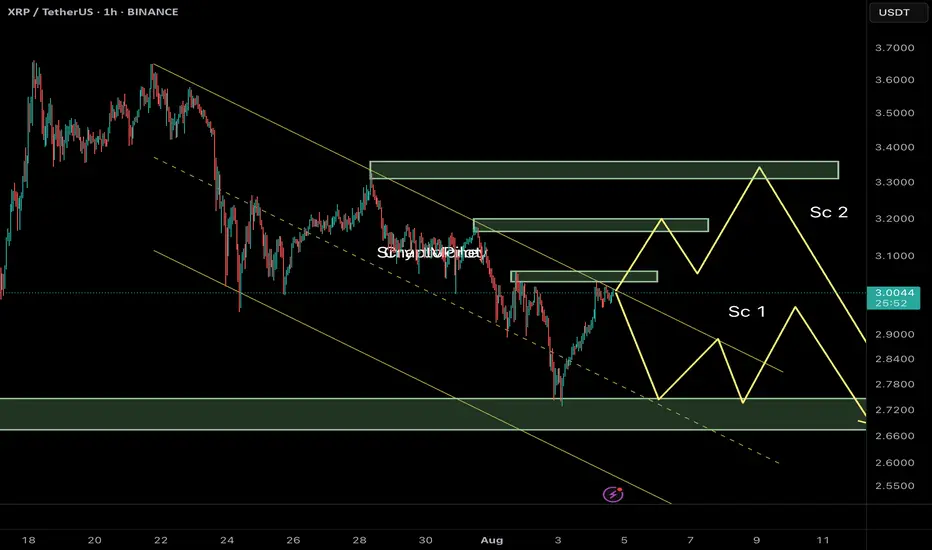
Ripple (XRP/USDT) Technical Analysis – 1H Timeframe🔰 Current Market Context:
After breaking below the ascending channel near $3.50, XRP has entered a corrective phase within a descending channel. Price is now hovering around a mid-range resistance zone, and we can outline two key potential scenarios from here:
⸻
📌 Scenario 1 (Sc1) – Immediate Rejection and Bearish Continuation
In this case:
• Price gets rejected from the current resistance zone ($3.05–$3.10).
• A quick corrective pattern (likely a Zigzag or Flat) plays out.
• XRP moves down to test the next demand zone near $2.70–$2.65, breaking below recent swing lows.
✅ This scenario aligns with the current weak structure and visible sell-side pressure. Liquidity above recent highs has likely been swept, creating a setup for continuation downward.
⸻
📌 Scenario 2 (Sc2) – Extended Correction with a Final Bull Trap
In this case:
• Price pushes higher toward a deeper resistance zone near $3.30–$3.40.
• A liquidity grab above the prior highs triggers a sharper reversal afterward.
• The overall structure could form a Diametric or Complex Correction, suggesting a deeper and more time-consuming wave before resuming the bearish trend.
⛔ This scenario requires strength and acceptance above $3.15, and should be treated as an alternative unless proven by price action.
⸻
🎯 Summary & Trade Strategy:
Scenario 1 is currently more probable unless we see a strong break and close above $3.10. Expectation: XRP may head toward the $2.70–$2.65 demand zone if resistance holds.
⚠️ Avoid entering early. Wait for confirmation via internal BOS (Break of Structure), bearish engulfing near OB zones, or signs of rejection with volume at resistance.
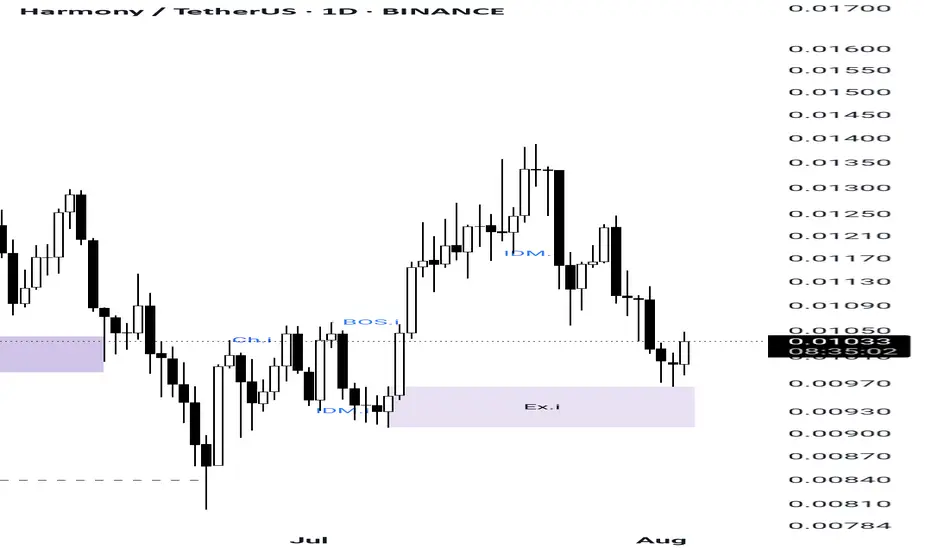
Harmony(ONE) is going to pump...As you can see in ONE Structure it made a minor structure and price touched its minor EX orderblock and for sure it made a SCOB confirmation
So now its ready to pump...
It's my own analysis and it's not investment advise , so DYOR
AAVE Daily Chart – Key Buy Zone & Two ScenariosAAVE is currently moving within a well-defined ascending channel on the daily timeframe. The last major bullish leg began from the $120 support and surged nearly +180% to a local high near $330.
Now, after a 25% pullback, price is consolidating around the midline of the channel near $250. More importantly, there’s a strong bullish order block sitting between $220–230, making this a low-risk buy zone with a stop below the order block.
🔸 Scenario 1 (bullish preferred):
Price dips into the $220 OB zone, completes a possible ABC correction, and launches a new bullish leg targeting the channel top above $500.
🔸 Scenario 2 (bearish alternate):
If the $220 order block fails, deeper correction could follow toward the channel bottom near $135.
⏳ This is a critical area to watch for reaction – Smart Money will likely show its hand soon.
🔗 Analysis by CryptoPilot

Ethereum: Smart Money Reversal After Stop Hunt?In the previous update, we warned that Ethereum might drop lower before any meaningful bounce — especially if it failed to hold the midline of the ascending channel. That scenario played out exactly as anticipated.
🟡 Price action summary:
ETH broke below the midline of the weak ascending channel, hunted the liquidity below recent lows, and tapped into the key bullish order block near $3,490 – $3,520. Price is now reacting to this zone with early signs of a reversal.
📌 Key observation:
Midlines of weak or low-momentum channels often act as liquidity traps in smart money models. Buying at these levels can be extremely risky — especially during corrective or distribution phases.
⸻
📚 Educational Note:
Never enter long positions solely at the midline of a weak ascending channel, especially when there’s a high probability of liquidity sweep below. Smart entries usually occur at order blocks formed after stop hunts.
⸻
🎯 Next steps:
Wait for confirmation (such as internal BOS or FVG closure) before entering longs. The structure suggests a potential move back toward the upper boundary of the channel if this OB holds.
⸻
🔗 Save this analysis and share it with fellow traders.
💬 Thoughts? Drop your view in the comments.

BTCUSDT – Diametric G-Leg Underway?⏱ Timeframe: 4H / 1H
🔍 Method: NeoWave + Smart Money Concepts (SMC)
📍Posted by: CryptoPilot
⸻
🧠 NeoWave Progression Update
As outlined in our previous analysis, we are tracking a potential Contracting Diametric structure (A–G) originating from the March 2025 highs.
🚨 The G-Leg may now be actively unfolding.
Here’s what just happened:
• Price rejected sharply from the supply zone near 119,000–119,500, exactly where Wave F was expected to end.
• After a drop to 115,780 (minor trendline), price bounced, but failed to make a new high, stalling at 118,700, forming a lower high → classic signature of a developing G-Leg.
• This G-wave likely aims to break below Wave E low, seeking imbalance fills and structural resets.
⸻
📊 Smart Money Confluence (SMC / ICT)
• 🟥 Bearish Market Structure confirmed via MSS on 1H: Lower Highs + Internal BOS
• 🟨 Buy-side Liquidity above 120k was already swept
• 🔻 Price failed to reclaim OB block around 119.5k
• 🧩 FVGs remain open between 114.5k–113k, acting as magnet zones
• 📉 Expectation: Price may now break the ascending minor trendline and accelerate toward the major structure low
📌 Primary Scenario:
• Wave G of Diametric in motion
• Potential structure: Zigzag or Complex Combination
• Expectation: Bearish continuation to break below 113k
📌 Alternative Scenario:
• If price closes above 120.5k, diametric structure may be invalidated
• Watch for triangle/flat development instead
⸻
⚠️ Risk Management Note:
Price action near 118.7k–119.5k is crucial. Reclaiming that zone with strength changes the bias. Until then, sellers remain in control.
💬 Final Thought:
We’re tracking the final stages of a multi-month complex correction. The rejection at supply, combined with SMC signals and NeoWave symmetry, suggests sellers may push price into deeper demand zones soon.
⸻
📌 Follow CryptoPilot for advanced wave structure updates, market geometry insights, and ICT-style smart money traps.
💬 Share your views or alternate wave counts in the comments!

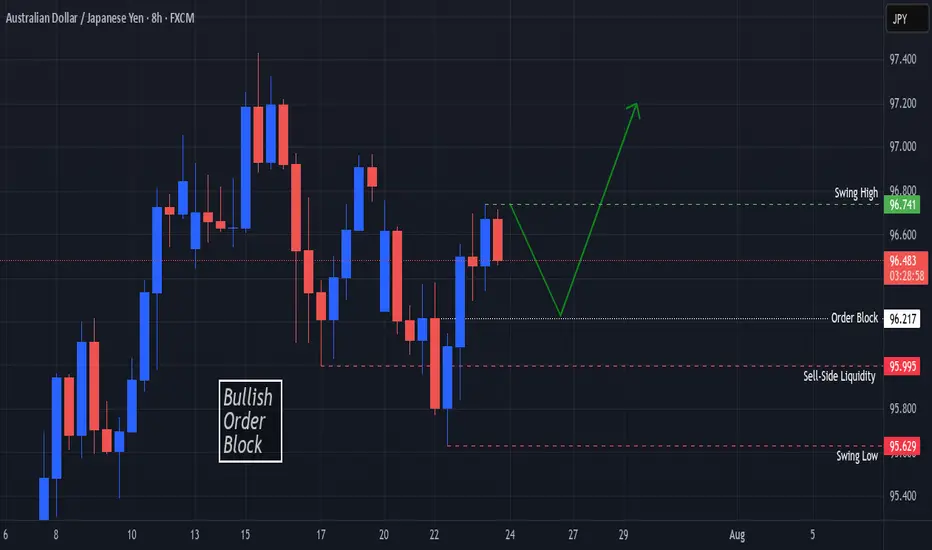
AUDJPY Bullish Order Block In SightOANDA:AUDJPY Price finds Support at the Swing Low @ 95.629 and creates a Swing High @ 96.741!
Based on the ICT Method, the Swing Low broke Sell-Side Liquidity @ 95.995 and opened up a Bullish Order Block Opportunity @ 96.217!
Price is currently working down from 96.49 at the time of publishing but once Price visits the Order Block, this could deliver Long Opportunities!!
Major Levels Ahead: GBPUSD Trade Setup UnveiledHey friends, I’ve prepared a fresh GBPUSD analysis for you!
📍 Target level: 1.34028
🔻 SELL zone: Between 1.34532 and 1.34437
I expect the trade to reach its target during the London or New York session.
Every like and show of support fuels my motivation to share more analysis—thank you all for being part of this journey!

NAS100 Setup Locked In — Ride the Drop from the Order Block!Hey Guys,
I'm planning a sell trade on the NAS100 index from a designated order block. Once price reaches the sell zone, the position will be activated.
📍 Trade Details:
- 🟢 Entry Level: 22,869
- 🔴 Stop Loss: 22,930
- 🎯 TP1 – First Target: 22,839
- 🎯 TP2 – Second Target: 22,794
- 🎯 TP3 – Final Target: 22,671
📐 Risk-to-Reward Ratio: 3.24
Your likes and support are what keep me motivated to share these analyses consistently.
Huge thanks to everyone who shows love and appreciation! 🙏


What’s EURUSD Telling Us on the 30-Minute Chart?🌅 Good morning, my friends,
EURUSD just made a pullback within the last 30 minutes, so I entered a sell position based on that move.
🎯 Targets:
- TP1: 1.17607
- TP2: 1.17475
- TP3: 1.17174
🛑 Stop Loss: 1.17938
📊 Risk/Reward Ratio: 2.00
Your likes and support are what keep me motivated to share these analyses consistently.
Huge thanks to everyone who shows love and appreciation! 🙏

Gold (XAUUSD) – July 7 | Watching 3326 POI for Short Setup🟡 Gold (XAUUSD) – July 7 Bias | Short Setup Developing at 3326 POI
The Gold market remains in a pullback phase on the H4 timeframe , and price may still revisit the 3280 H4 order block before resuming its broader uptrend.
On the M15 timeframe, structure has now shifted clearly.
After an initial Change of Character (ChoCh) , we’ve seen a confirmed Break of Structure (BoS) , placing M15 officially in a downtrend .
✅ Why This Matters:
With both ChoCh and BoS complete, we no longer treat this move as a potential liquidity grab — it now reflects a valid structural reversal in the short term.
But instead of reacting impulsively, we study this shift as a live example of structure-based price action — and how entry zones form after confirmation.
🔍 M15 Order Block in Focus:
• 3323.500 – 3327.800 → Valid M15 POI for short setups
→ This is where we expect price might retrace before resuming its move
→ We’ll observe this zone for M1 confirmation (ChoCh + micro BoS) before taking any action
🎯 Target Zone:
• 3280 – H4 Demand
→ A clean structure-based target aligned with higher timeframe pullback
→ Our model requires minimum 1:3 RR , anchored to price structure
🔁 Key Takeaways:
• H4: Pullback phase remains intact
• M15: Downtrend confirmed (ChoCh + BoS complete)
• Execution plan: Observe 3326 POI; respond only if structure confirms again on M1
• No anticipation. No prediction. Just process.
📖 This is structure-based learning in real time.
We don’t chase setups — we observe shifts.
Let structure teach you. Let price confirm it.
The chart is the mirror.
📘 Shared by @ChartIsMirror

Gold (XAUUSD) – July 1 Analysis📍 H4 Key LH Zone: 3348.500 – 3350.500
This is a major decision zone.
Current market structure:
🔸 M15 is in an uptrend with confirmed ChoCh + BoS
What to watch:
We’re approaching the H4 LH supply zone — now we observe how price behaves here.
🔹 If price breaks above this H4 LH zone:
→ HTF and LTF trends align to the upside
→ Potential continuation of the bullish move
🔹 If price respects and stays below this LH zone:
→ Then this recent up-move could be a pullback
→ We may see a new low forming — so be cautious
📍 M15 Zones for Long Setup (if confirmed):
• 3309.500 – 3312.500 (Order Block Zone)
• 3302.500 – 3304.600 (Demand Zone)
We will watch these levels closely.
If price respects these zones and gives M1 confirmation (ChoCh + BoS) — we’ll plan for long entries accordingly.
📖 Let structure guide your decisions. Let price speak first.
📘 Shared by @ChartIsMirror
Author of The Chart Is The Mirror — a structure-first, mindset-grounded book for traders

NASDAQ Bullish Play into Liquidity Before Potential ReversalForecast:
NOTE: At this moment, this is a forecast and trades will be taken dependent on live PA.
Price has reacted strongly off the 21,410–21,430 Daily Order Block, suggesting bullish intent. If bullish structure holds, I expect a move into the 22,060–22,130 liquidity zone, where sell-side setups could form.
This is a classic Buy to Sell model:
Buy from OB at ~21,420
Target liquidity above recent highs (~22,100+)
Look for shorts after sweep into 22,130–22,220 range
Invalidation: Break and close below 21,410 suggests the OB failed — potential deeper drop toward 20,700.

XAU/USD 4H Technical Analysis 13 June 2025Market Structure & Bias:
On the 4H chart, gold has broken out of a recent sideways range and formed a sequence of higher highs and higher lows. This “break of structure” (BOS) through the old swing high confirms a bullish bias.
Price action respects key support zones (demand areas) on retracements, suggesting underlying buying interest. The overall bias is bullish, driven by risk‐off sentiment. Support and resistance act as natural pause/reversal zones
For example, a demand zone/order block around ~3390–3400 (from the prior swing low) has been tested and held, fueling the recent rally.
Likewise, an imbalance (fair value gap) left below 3400 could attract buyers if price returns. We also note that a change of character (CHOCH) would occur only if price breaks below a higher-low; so far that has not happened.
In short, gold’s 4H market structure is bullish (higher highs/lows) and the trend looks set to continue upward unless a strong reversal forms. Key Levels (4H): We use classic pivot points to mark critical levels (using the last 4H high, low, close). Pivot points can project future support and resistance.
Based on recent swings, key levels are:
Pivot: 3424 (calculated from last bar’s H/L/C)
Support 1: 3413
Support 2: 3399
Support 3: 3374
Resistance 1: 3438
Resistance 2: 3449
Resistance 3: 3474
Price currently hovers just below R1. These levels align with congestion zones and Fib retracements (50–61.8% of the last $3290–3427 upswing), so expect active bidding near S1–S2 and selling around R1–R2.
Intraday 1H Trade Setups
Buy Zone ~3395–3405 (Bullish OB/Demand):
Entry: Long on dips into the order-block/demand area near 3395–3405 (just above S1).
Stop: ~3385 (≈$10 below entry zone).
Targets: TP1 ≈ 3438 (Resistance 1), TP2 ≈ 3450 (near R2).
Reason: This zone aligns with a prior institutional order block/demand and a 61.8% Fib retrace of the recent rally. Price has shown bounce here before, so a bullish reaction is likely.
Trigger: Look for a bullish reversal candle (e.g. bullish engulfing or pin bar) on 1H in this zone, or a market structure low (MSL) turning point. A break back above the high of that candle can serve as confirmation to enter.
Sell Zone ~3435–3445 (Bearish Retrace):
Entry: Short near resistance around 3435–3445 (just below R1–R2).
Stop: ~3455 (≈$10 above entry zone).
Targets: TP1 ≈ 3413 (Support 1), TP2 ≈ 3399 (Support 2).
Reason: This area is the upper end of the recent range. It contains a minor supply zone and the R1–R2 pivots. A liquidity sweep (stop-hunt) may occur above recent highs.
If price loses momentum here, expect a pullback.
Trigger: Watch for a bearish price action signal (e.g. a bearish engulfing candle or a double-top swing) on 1H. A break of the immediate lower low (lower than the last minor swing) would confirm a short-term change of character and signal entry.
Breakout Long ~3449+:
Entry: Long on a sustained break above R2 (≈3450). Confirm entry when price closes above 3449 on 1H.
Stop: ~3424 (just under the Pivot).
Targets: TP1 ≈ 3474 (Resistance 3), TP2 ≈ 3495+ (new highs).
Reason: A clean breakout of 3450 would indicate strong bullish order flow and trigger stop-run triggers. This would be a continuation trade in line with the 4H uptrend.
Trigger: A bullish candle closing above 3449 (ideally with above-average size) or a 1H break of structure (higher high over 3449) would signal entry.
Takeaway: Gold remains in a bullish 4H trend; focus on buying dips into demand zones and watch for clear candlestick triggers at support/resistance.

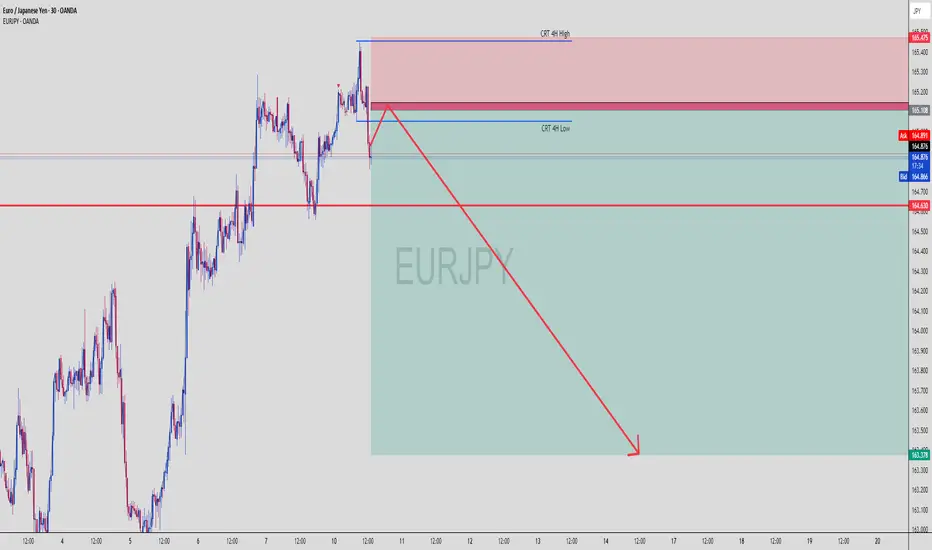
EURJPY Tapped 4H Supply – Massive Drop Loading?EURJPY | 30-Min View with 4H CRT Zones
🔥 This is where Smart Money sharpens their blades…
🧊 New Confluence Just Dropped:
🔴 CRT 4H High Zone: 165.108–165.475
Price wicked right into the 4H Compression Reversal Top (CRT) — ideal Smart Money trap zone
This area aligns perfectly with the bearish OB/supply from previous screenshot
🔵 CRT 4H Low Zone: Around 164.630
Strong structure level where liquidity is sitting
Price respected it as temporary support before likely break-and-retest continuation
🔍 Price Action Logic:
✅ Price faked out above CRT 4H High, grabbing liquidity
✅ Immediate rejection candle with wick rejection signals institutional selling
🔁 Now price is retesting the mid-OB / lower CRT, likely forming a breaker pattern
🟥 Huge clean imbalance to the downside — marked by that juicy green TP box
🔽 Expectation: price fills inefficiency and heads to 163.378 minimum
🎯 Trade Parameters:
🔻 Entry Zone 165.100 – 165.397 (Red Supply / CRT High)
🛡 SL Above 165.475 (CRT 4H High)
🎯 TP Target 163.378 (bottom imbalance fill)
⚖️ RRR Over 1:4 potential — high precision entry zone
🧠 Chart Ninja Analysis:
“When CRT zones align with OBs and liquidity sweeps,
that’s a Smart Money feast waiting to happen.” – 🥷
This chart is a classic reversal blueprint. If you missed the first tap — wait for the retest. If this holds below CRT Low (164.630), expect full bearish momentum into midweek.
📊 Confirmation Tactics:
🔄 M15 bearish engulfing / shift in structure after tap into CRT
🔻 Break of 164.630 = confirmation of bearish intent
⏳ Optional: use FVG + volume spike as further entry triggers
🚨 Save this chart — it's one of those sniper moments where everything aligns!
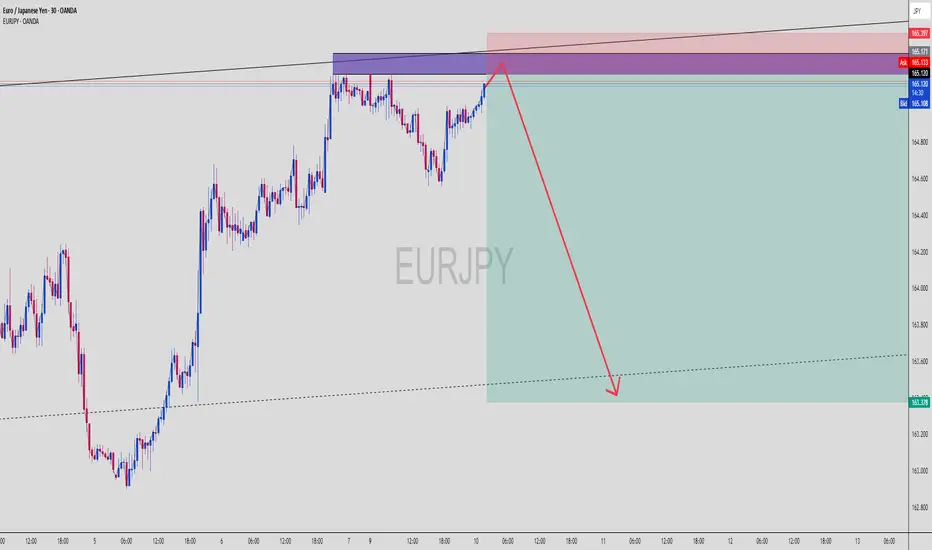
EURJPY Supply Tap! Bearish Reaction Coming?EURJPY (30-Min) | Supply Zone Hit + Bearish Reversal Setup
This EURJPY move is brewing into a classic SMC bearish play — engineered liquidity run, supply zone reaction, and a projected melt to imbalance below. Let’s dissect the ninja logic 🧠📉
🔍 Breakdown of the Setup:
🟥 Supply / Order Block Zone
Price enters a strong bearish OB zone between 165.100–165.397
Previous rejection wicks in this zone = smart money sell interest
Price now testing that area again — potential for liquidity sweep + reversal
🟪 Multi-Zone Confluence
Multiple overlapping zones stacked: OB, mitigation block, and liquidity sweep area
Perfect spot for Smart Money to unload positions before sending price lower
📏 Risk-Reward Optimization
Entry near 165.100–165.397 zone
Stop Loss placed slightly above the last rejection wick (above 165.397)
Take Profit projected around 163.378 based on measured impulse leg and imbalance fill
🧠 Liquidity Narrative
The rally into supply is likely a buy-side liquidity hunt
Smart Money often drives price into key zones before triggering reversals
Price may wick above 165.171 to fake bulls before a strong sell-off
🧠 Chart Ninja Entry Plan:
🔻 Entry Zone 165.100 – 165.397 (Supply OB)
🛡 SL Above 165.450 (above wick / last structure high)
🎯 TP Target 163.378 (imbalanced fill target)
⚖️ RRR Approx. 1:4+ depending on entry precision
🥷 Chart Ninja Note:
“The trap is always set where the crowd feels the safest —
and that’s exactly where the ninja strikes.” 🥷📉
This setup could be a clean ride down if price reacts as expected. Confirmation entry = bearish engulfing on M15 or M30.
🔁 Bonus Observation:
You can see lower timeframes building internal liquidity, meaning we might get a sharp, volatile drop once that top wick finishes sweeping.
📍Mark this zone and set an alert — entry can trigger fast!
🔥 What’s your confirmation style — engulfing candle or breaker structure?
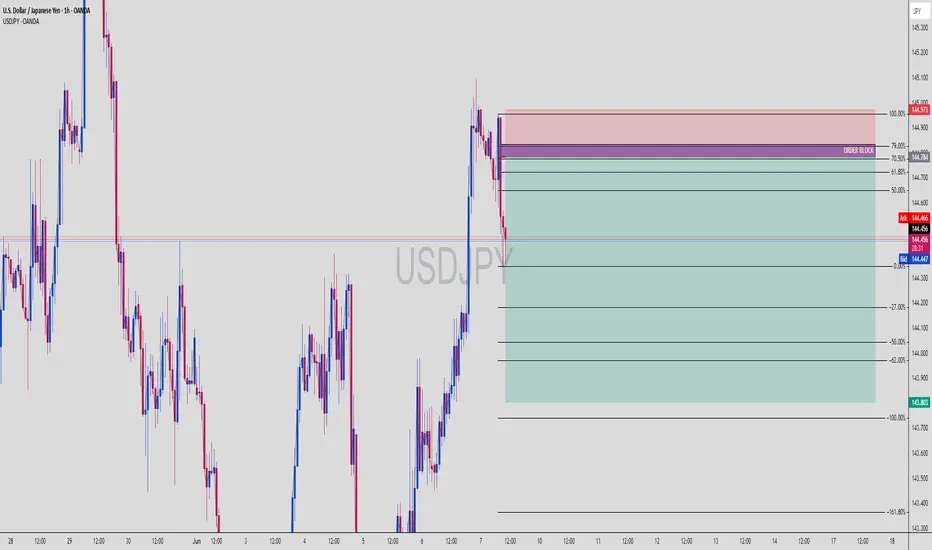
USDJPY Short Setup: OB Rejection + Fib Premium Sell-Off IncomingUSDJPY (1H Chart) | Institutional Short Setup with OB + Fib Confluence
The market is showing clear Smart Money Distribution behavior — with a rejection from a high-confluence zone combining Order Block, Premium Fib Levels, and bearish momentum shift.
🔍 Smart Money Setup Breakdown:
🔻 Bearish Order Block Zone (OB)
Price wicked into OB zone and got instantly rejected
OB located precisely at the 70.5% – 79% premium range
Mark of institutional sell-side interest
📐 Fibonacci Retracement + Premium Zone
Retracement from swing high (144.973) to swing low (144.436)
Premium zone between 61.8% to 79% aligns with OB (144.700–144.973)
Entry taken from this zone for high-probability sell setup
📉 Bearish Confirmation
Aggressive bearish reaction post-OB tap
Market structure flipping bearish
Momentum candle breaks previous bullish leg
🔻 Target Zones (Measured Fib Extensions)
-27%: 144.200
-62%: 144.000
-100%: 143.803
-161.8%: 143.300 (extended liquidity draw)
🧠 Chart Ninja Entry Plan:
🔹 Entry Zone 144.784 – 144.973 (OB + Premium Fib + FVG rejection)
🔻 SL Above 145.000 (above OB wick)
📉 TP 1 144.200 (first fib extension)
📉 TP 2 143.803 (full -100% extension)
⚖️ RRR Approx. 1:4+ — stealthy sniper precision
💬 Pro Tip from the Ninja Dojo:
The market doesn’t move because of indicators — it moves because of liquidity.
Find the OB. Wait for the imbalance. Strike where Smart Money hides. 🥷📊
This isn’t retail — this is calculated execution.
🎯 Save this chart before price melts to 143.8
💬 Drop your entry zone & SL idea in comments
XAUUSD Bearish Setup! OB Rejection + FVG + 61.8% Fib PremiumGold (XAUUSD) | 4H Chart – High-Probability Bearish Setup
XAUUSD is setting up for a bearish move as price taps into a premium zone confluence, including an Order Block (OB), Fair Value Gap (FVG), and a 61.8% Fibonacci retracement. Smart Money Concepts (SMC) traders will recognize this setup as a textbook scenario for a bearish continuation toward a Weak Low target.
🔍 SMC Breakdown:
Market Structure:
The market has shifted bearish after breaking the previous low and forming a lower high. The internal structure confirms bearish order flow, giving us confidence in continuation to the downside.
Liquidity & Inefficiency Play:
Recent sweep of buy-side liquidity above minor highs.
Rejection at premium pricing indicates Smart Money has triggered sell programs.
Internal liquidity pools were engineered and swept, confirming manipulation.
Entry Confluence Zone (Kill Zone):
🔴 Order Block (OB):
3,372 – 3,380 — bearish OB formed before strong impulse move.
🟣 Fair Value Gap (FVG):
Perfect overlap with the OB, leaving a gap that price has now rebalanced into.
📐 Fibonacci Levels from Swing Low to High:
61.8% = 3,373
70.5% = 3,377
79% = 3,380
This entire zone aligns with institutional premium pricing — the high-probability reversal range.
📉 Bearish Projection:
Expecting price to reject from OB/FVG zone and move toward the discount zone, targeting unmitigated lows and imbalance fills.
Key Downside Targets:
50% = 3,368
Full Extension = 3,333 (Aligned with Weak Low)
This level also sits near the 0.00% Fib level — a clean liquidity magnet.
🧠 Chart Ninja Entry Plan:
🔹 Entry: 3,373 – 3,380 (OB + FVG + Fib Premium)
🔻 Stop Loss: Above 3,381 (invalidate OB)
📉 Take Profit: 3,333 (Weak Low + Fib Completion)
⚖ RRR: ~1:4+ — high-confluence sniper setup
💬 Ninja Wisdom:
You're not trading random candles — you're trading intentional liquidity shifts.
This setup screams Smart Money footprint: OB rejection + inefficiency fill + premium pricing.
Be the sniper — not the trigger-happy retail trader. 🥷🎯
📍 Save this setup before it plays out — backtest and learn from it!
🔁 Drop your analysis below – agree or see it differently?
👣 Follow @ChartNinjas88 for daily institutional-grade setups on Gold & more!

USDJPY Pullback? Watch OB + Fib Confluence for the Next Buy WaveUSDJPY | 30-Min Chart – Smart Money Buy Setup in Progress
After a sharp bullish rally, USDJPY is setting up for a classic retracement buy scenario. We're now watching a key confluence zone between Fibonacci levels, a bullish order block, and internal trend structure — all lining up for a high-probability long setup.
🔍 Trade Breakdown:
📉 Pullback Expected Before Next Rally:
Price rejected near short-term resistance and is retracing from local highs.
Retracement aligns with key OB + 61.8–79% Fib zone = institutional entry zone.
🟣 Order Block (OB) Demand Zone: 143.086 – 142.828
Last bullish candle before explosive rally = demand OB.
OB sits within premium Fib retracement = Smart Money buy zone.
📐 Fibonacci Levels (Swing Low to High):
61.8% ≈ 143.200
70.5% ≈ 143.000
79% ≈ 142.828
This is the kill zone for institutional longs — where Smart Money typically enters before expansion.
🔵 Projected Play:
Retracement to OB/Fib confluence.
Bullish rejection from OB zone.
Impulse move targeting previous highs and beyond.
💡 Target Level: 144.396 (sits just above prior high and aligns with -27% Fib extension)
📉 Current Bias:
Short-term retracement ➝ Mid-term bullish continuation
Expecting price to dip into OB then launch.
🧠 Chart Ninja Entry Plan:
🔹 Entry Zone: 143.086 – 142.828
🔻 SL Below: 142.650 (below OB/Fib + structure wick)
📈 Target: 144.396
⚖️ RRR: 1:3+ — high confluence risk-managed buy
🔍 Technical Confluence Checklist:
✅ OB demand zone
✅ 61.8–79% retracement
✅ Bullish market structure
✅ Internal channel support
✅ Momentum slow before entry
📍 Save this chart — don’t chase, let price come to you
💬 Comment if you're watching this OB too
👣 Follow @ChartNinjas88 for precision-based setups daily
