GBPUSD - ShortLooking at a key supply area on the higher timeframe of GBPUSD
We now have a structural shift to the downside on the 1H TF that has left an unmitigated OB with a level of inducement.
Pending order will be set on this pair @ 1.35676
We will see how the market plays out around this area
Peace
Orderblock

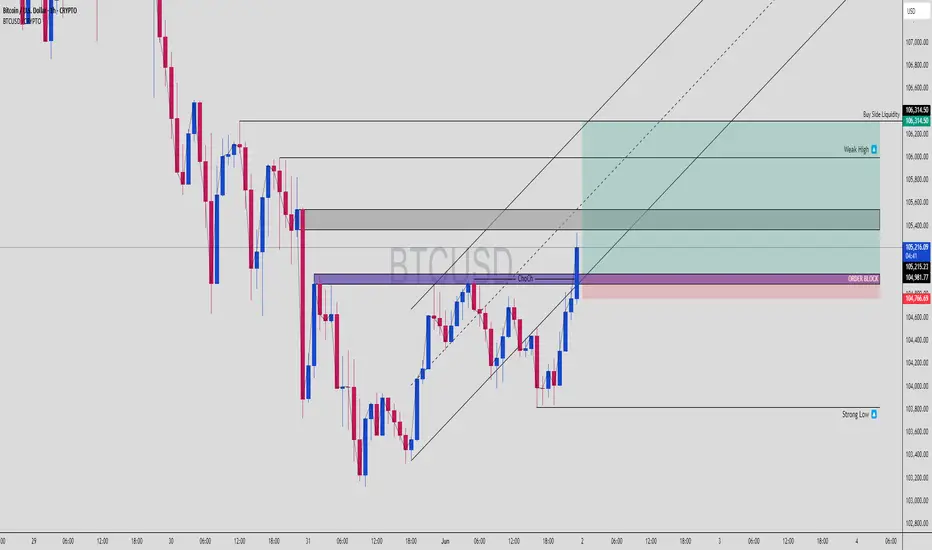
BTCUSD Hits Premium FVG – Liquidity Raid Incoming?BTCUSD | 4H Chart Breakdown – FVG, Order Block, and Smart Money Confluence
Here’s a killer SMC-based short opportunity forming on BTCUSD. Let’s decode this clean setup:
⚙️ 1. Market Structure Snapshot
Change of Character (ChoCH) confirmed on lower timeframe
Price aggressively retraced into a premium zone
Now tapping a combo zone:
✅ Fair Value Gap
✅ Order Block
✅ Sell-side OB mitigation
✅ Sitting right below Buy-Side Liquidity
We’re in prime territory for a liquidity raid followed by a sharp rejection.
📊 2. Key Price Zones
📈 Current Price: ~105,257
🟪 OB + FVG Zone: 104,766 – 105,257
🟦 Weak High (Target for Raid): ~106,200
🔻 Sell Setup Activation: If price shows rejection at OB zone
📉 Sell Target: 103,800 (Strong Low + liquidity pocket)
This is textbook bearish structure after a sweep of weak highs — time to watch the market respond.
🧠 3. SMC Logic Breakdown
ChoCH marks the first sign of bullish intent
But price is now entering a premium zone above equilibrium
Liquidity lies just above the weak high
We expect:
Raid of the weak high / buy-side liquidity
Rejection at the OB + FVG
Sharp drop to take out the strong low
This pattern = a high-probability SMC trap short.
📉 4. Risk-Reward Plan
🛑 Stop Loss: Just above 106,314.50
🎯 Take Profit: Near 103,800 (Strong Low)
🔁 RR: ~1:3 to 1:4 if you enter after a M5 rejection
🧼 Partial TP: Midway at 104,200 to reduce exposure
🧩 5. Entry Strategy
Monitor M5–M15 around OB + FVG zone
Wait for bearish engulfing / BOS
Refine entry with tighter SL
Let it play toward sell-side liquidity
⚔️ 6. Trader Notes:
Don't short early. Wait for reaction and structure shift
This is liquidity engineering – smart money lures in longs before nuking
Pair this chart with volume divergence confirmation if available
💣 Type "Liquidity Trap 💀" in the comments if this setup matches your bias
🔁 Save this if you scalp or swing SMC-based setups
🔔 Follow @ChartNinjas88 for clean smart money plays
FVG, D1 Breaker, H4 OBit looks like Dogecoin might find some support at the current level. There are some relative equal highs near a internal range liquidity D1 fair value gap.

Potential Reversal Level on NasdaqLooking for Price to retrace as far as the H1 OB (max 21,440.00 to remain bullish), to potentially provide a reaction and continue his grind higher or at least return back to 50% of today range.

GBPUSD Decision Point | Will the Order Block Hold or Fold?GBPUSD | Smart Money Liquidity Trap or Bullish Breakout?
Here’s a high-probability play based on Order Blocks, Fair Value Gaps, and channel structure—one of the cleanest SMC setups on cable this week.
📊 1. Market Overview
GBPUSD is currently pulling back after a sharp drop, retesting the premium zone Order Block on the H1 timeframe.
Structure remains bullish inside the ascending channel, but there’s major indecision here—will it break above the OB, or retrace deeper into the Fair Value Gap zone?
🧠 2. Dual Bias Logic
You’ve mapped out two valid SMC scenarios (marked in red & blue arrows):
🔻 Scenario 1: Bearish Trap + Deep Liquidity Grab
Price reacts from the Order Block (purple zone)
Rejects and breaks down into the Fair Value Gap (FVG) zone near 1.33300
Targets liquidity resting below prior structure
🔺 Scenario 2: Order Block Respect + Long Continuation
OB holds, price flips bullish
Pushes above 1.35260 for bullish continuation
Final target near channel top @ 1.35920–1.36000 zone
Both scenarios are textbook Smart Money setups — based on how price reacts at this OB, we’ll get the direction.
🧱 3. Key Zones
🔵 Order Block: 1.3445 – 1.3526
🔴 Fair Value Gap (FVG): 1.3330 – 1.3283
🟢 Target (Bullish): 1.3600
🔻 Target (Bearish): 1.3280
⚖️ 4. Risk-Reward Potential
Whether you go long from the FVG or short from the OB, both have:
✅ Clean entries
✅ Clear invalidation zones
✅ Strong RRR potential (1:3 to 1:4+)
📌 5. Watchlist Note
💡 If price taps into the OB and shows weak momentum, prepare for shorts targeting the FVG
💡 If it holds the OB cleanly with bullish engulfing or BOS (break of structure), ride the long back to channel highs
💬 Call to Action:
📈 Add GBPUSD to your SMC sniper list this week
💬 Comment “OB or FVG? 🤔” if you're waiting to catch the bounce
📌 Save this post for Smart Money reference setups

AUDJPY Short Setup – Fair Value Gap + 61.8% Precision Tap📊 AUDJPY | 1H Bearish Setup Breakdown (SMC Perspective)
This is a clean setup for sniper traders 🧠 — a perfect blend of FVG, Fib retracement, and a reaction from Smart Money zones. Let’s dig in:
🔻 1. Macro Context: Bearish Bias
Market structure is still bearish, with lower highs and lows
Price just completed a correction phase
We're seeing price react at a high probability distribution zone
🟪 2. Confluence Zones: FVG + Fib
📌 Fair Value Gap (FVG) – Price has just tapped into the FVG between 92.92 and 93.12
📌 61.8% Fib Level – Price perfectly aligns with golden pocket zone
📌 OB Above – Strong bearish order block lies around 93.60, with a Strong High marking retail’s target stop area
This stack of confluences makes this zone ripe for a short entry.
💣 3. Entry Logic
Entry was triggered after a clean tap into the FVG zone
Price shows signs of rejection with long upper wicks and slowing momentum
Ideal Smart Money scenario: Price mitigates FVG, avoids OB sweep (for now), and targets internal liquidity
🎯 4. Target Zone
TP = 91.651
Clean equal lows and imbalance just above
Channel midpoint & liquidity resting below
Matches 0% Fib level on the move
⚖️ 5. Trade Setup
📍 Entry: 92.926
🔐 Stop Loss: ~93.390 (above FVG + structural high)
🎯 Target: 91.651
🧮 Risk-to-Reward Ratio: ~1:4.5+
🧠 Smart Money Flow
Retail longs are eyeing a break above that “Strong High” — but Smart Money will likely:
Tap into FVG
Drive price down for a liquidity grab
Possibly retest or sweep OB after internal liquidity is cleared
💬 Drop “FVG ZONE SNIPED 🧨” if you took the entry
🧠 Save this post to study FVG + Fib reactions
👀 Tag your trading buddy who needs to level up their confluence game

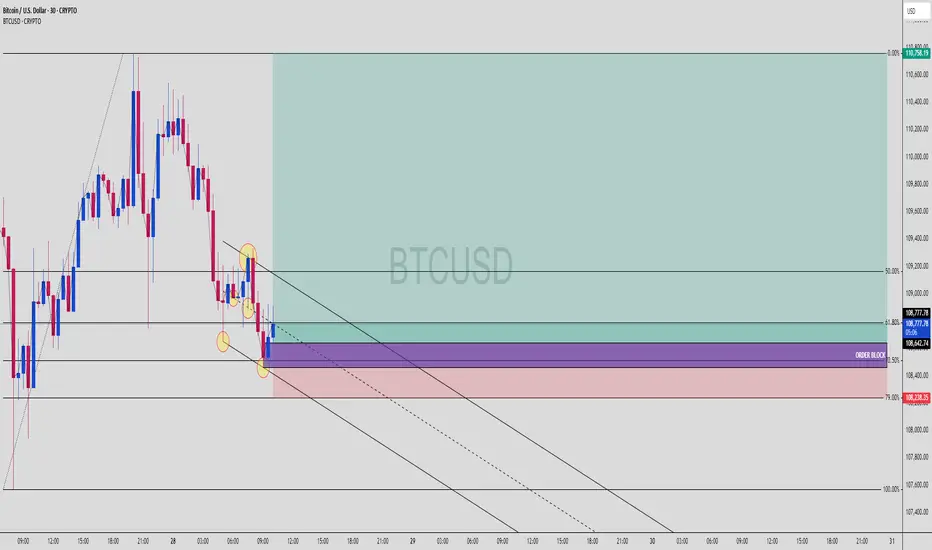
BTC Bulls Awakening from the Shadows – OB + 79% Fib Reaction 📈 BTCUSD | 30-Min Bullish Reversal Setup from OB + 79% Fib Zone
Smart Money never misses a good discount… and this BTCUSD setup is that juicy premium-to-discount play we wait for.
🔍 1. Price Action Context
Market sold off into a clearly defined Order Block
Price tapped precisely at the 79% Fib level
Internal liquidity sweep confirmed below recent equal lows
No candle close below OB = structure still intact
This is what we call the "Trap + Reverse" move. Late shorts just got baited.
🧱 2. Confluences Stacking Up
💎 79% Fib Retracement — Deep discount zone for Smart Money
💎 Bullish Order Block — Last up candle before the sharp sell-off
💎 Liquidity Sweep — Price swept short-term lows = inducement
💎 Channel Structure — Midline bounce = potential breakout
The OB + Fib overlap = a high-probability buy zone with minimal risk
🎯 3. Trade Plan
Entry Zone: 108,250–108,650
Stop Loss: Below 108,000
Take Profit: 110,758 (premium zone)
⚖️ 4. RRR (Risk-Reward Ratio)
📥 Entry: ~108,400
🔒 SL: 108,000
💰 TP: 110,758
✅ RRR ≈ 1:5.8
This is sniper-level asymmetric risk. You don’t chase candles — you wait here, like a lion in the grass 🦁.
🔁 5. What to Watch Next
Price must reclaim and close above 108,867 for confirmation
If we get a BOS (Break of Structure) above 109,200 = 🚀
Hold above the mid-channel line = bullish continuation
💬 Comment “LONGED BTC 💎” if you caught this with the OB bounce!
📌 Save this to study OB + Fib synergy.
👀 Watch price action at 109,200 — breakout zone incoming?
USDJPY | Smart Money Long Setup – Deep Fib + OB Reaction💴 USDJPY | Institutional Long Play with Perfect OB + Fib Confluence
Price gave us an aggressive push off the demand zone, showing clear Smart Money accumulation behavior. This setup is high probability based on Smart Money Concepts (SMC).
🔍 1. Technical Breakdown
Strong impulse move upward
Clean pullback into the Order Block
Confluence with 70.5%–79% Fibonacci retracement zone
Price respected the OB zone and printed higher highs
That reaction was institutional — no cap 🧢.
🧱 2. Bullish Confluences
🔥 Order Block (OB): Purple demand zone = unmitigated
📐 Fib Sweet Spot: 70.5%–79% = institutional re-entry levels
✅ Strong Wick Rejection: Shows absorption of sell-side liquidity
📈 Market Structure Shift: Break of structure to the upside
🎯 3. Trade Plan
Entry: 142.89 (within OB + 70.5%)
Stop Loss: 142.00
Take Profit: 145.49 zone
This setup targets the -27% fib extension — a classic institutional TP level.
⚖️ 4. RRR (Risk-Reward Ratio)
💰 Entry: 142.89
🔒 SL: 142.00
📍 TP: 145.49
✅ RRR ≈ 1:2.9
Solid intraday-to-swing play with clean structure.
🧠 5. Key Confirmation Points
Break and close above 144.36 = confirmed bullish intent
Price respecting 143.44 OB = bulls still in control
SL below OB = protected by demand block
💬 Comment “SMC Long Sniper 💹” if you caught this move!
🔄 Share this if you love OB + fib sniper entries
📌 Save this setup for your next demand zone playbook

USDJPY | FVG + OB + Weak Low Target = Textbook SMC Setup📊 USDJPY | 1H Bearish Play – Smart Money In Control
We’re seeing a classic setup where price retraces into a bearish zone of confluence and prepares for a selloff toward internal liquidity. Check the breakdown:
🔻 1. Structure Shift Confirmed
Price broke structure on the downside after forming a lower high
Current move is a retracement into discount OB zone
Clear rejection is forming, signaling short momentum incoming
🟪 2. Zone Confluence
📌 Order Block (OB): Sitting just under the 61.8% Fib
📌 Fair Value Gap (FVG): Mitigated perfectly
📌 Fib Retracement: Price reacts between 61.8% and 70.5% — classic Smart Money play
📌 Previous Demand Turned Supply: This level is now acting as a rejection zone
This is stacked confluence — just how Smart Money likes to move.
💣 3. Entry Strategy
Entry Zone: 142.55 (midpoint of the OB reaction area)
Stop Loss: Above 143.443 (above OB + liquidity wick)
Take Profit: 139.888 (weak low, previous liquidity resting point)
⚖️ 4. Risk-to-Reward Ratio (RRR)
🎯 TP = 139.888
📍 Entry = 142.550
🔐 SL = 143.443
✅ RRR ≈ 1:3.5
A great example of high-probability short setup using pure Smart Money logic.
📉 5. Why This Works
Retail traders will try to long at this zone hoping for a breakout
Smart Money uses this zone to engineer liquidity
They tap into the FVG/OB, then target internal liquidity and weak lows
Clean, controlled sell-off expected down to 139.888
🧠 SMC Insights
This chart is all about liquidity engineering:
Push up into OB
Reject at premium pricing
Drive down to weak low to collect stops
Possibly reverse or continue trend from there
💬 Comment “FVG TAP + OB = 🔥” if you spotted this setup early
💾 Save it before the drop happens
📤 Share with a fellow SMC trader who needs this breakdown
BTC Short Locked – FVG + 79% Fib = Liquidity Grab Incoming📉 BTCUSD | 1H Smart Money Short – Premium Rejection in Play
Bitcoin just tapped into a nasty supply zone that aligns with:
🟥 Fair Value Gap (FVG)
🔻 79% Fibonacci Retracement
💥 Previous Breaker Block Zone
🧠 Clean Internal Liquidity sweep
🚩 Structure still bearish – no HH
🔍 1. Market Structure Breakdown
Price broke down aggressively from the top (early signs of redistribution)
We’re now retesting the FVG + OB zone
No candle close above the Strong High = still valid bearish context
🧱 2. Zone Confluence
📍 FVG (Fair Value Gap): Imbalance created during impulsive sell-off
📍 OB + Breaker: Strong resistance holding inside 70.5%–79% retracement
📍 Strong High: Still protected
📍 Weak Low: Below = prime target for liquidity sweep
Price kissed the edge of that 79% Fib and immediately rejected = 🔥 confidence for a swing short
🎯 3. Trade Plan
Entry: Around 110,800 (inside FVG zone)
Stop Loss: Above 112,400 (Strong High)
Take Profit: 105,248 (below Weak Low liquidity)
⚖️ 4. RRR (Risk-Reward Ratio)
📥 Entry: 110,800
🔒 SL: 112,400
💰 TP: 105,248
✅ RRR ≈ 1:3.5
Solid asymmetric setup with clearly defined structure, inducement, and imbalance = Smart Money textbook trade.
📉 5. Why This Works
Retail longs are entering late = exit liquidity for big players
Price filled the FVG but failed to break structure
Weak low below is clean AF, likely to be swept for continuation
1H/4H alignment = high conviction short
💬 Type "SHORTED BTC 💥" if you saw this setup before the drop!
📌 Bookmark this – confluence stacking is how you win consistently
👊 Share this with someone still buying the top 📈🙃

GOLD Short Setup – OB Rejection + FVG Play to Weak Low 📉 XAUUSD | 4H Short Setup – Classic Smart Money Reversal Zone
Gold is giving us a prime reversal opportunity off a stacked supply zone, aligning with:
🔵 79% Fibonacci Retracement
🟪 High-Timeframe Order Block (OB)
🚫 Failure to create a new high (bearish intent confirmed)
Let’s break it down:
🔻 1. Price Structure Insight
Clean swing high printed near 3400
Retraced down to a discount zone, then sharply reversed
Price now tapping into a premium supply zone between 70.5% – 79% Fib
🟣 2. Key Zone Confluence
📍 Order Block: The final up-candle before a massive drop = institutional sell zone
📍 Fibonacci Levels: 70.5%–79% = premium sell levels
📍 Internal Liquidity: Price swept local highs before stalling
📍 Strong High Above: Untouched = inducement for future sweep (or rejection fuel)
Everything screams Smart Money Sell Setup 📉
🎯 3. Trade Idea
Sell Entry: Around 3,348
Stop Loss: Above OB & Strong High ~ 3,390
Take Profit: 3,120 (clear weak low = liquidity pool)
⚖️ 4. Risk-Reward Ratio (RRR)
📥 Entry: 3,348
🔒 SL: 3,390
💰 TP: 3,120
✅ RRR ≈ 1:5.4
Perfect textbook SMC setup—high confluence + asymmetric RRR = 🔑
🧠 5. Why This Setup Works
Retail traders are lured into longs after bullish push
Smart Money taps OB, rejects hard at premium
Target: internal liquidity resting at weak low (3120)
This creates a controlled sell-off that avoids grabbing the strong high
🟢 Drop a “GOLDEN SHORT 🪙💥” if you caught this setup before the crowd
💾 Save it for reference – this is how institutions trap liquidity
📤 Share with your trading fam — this setup is 🔥🔥🔥
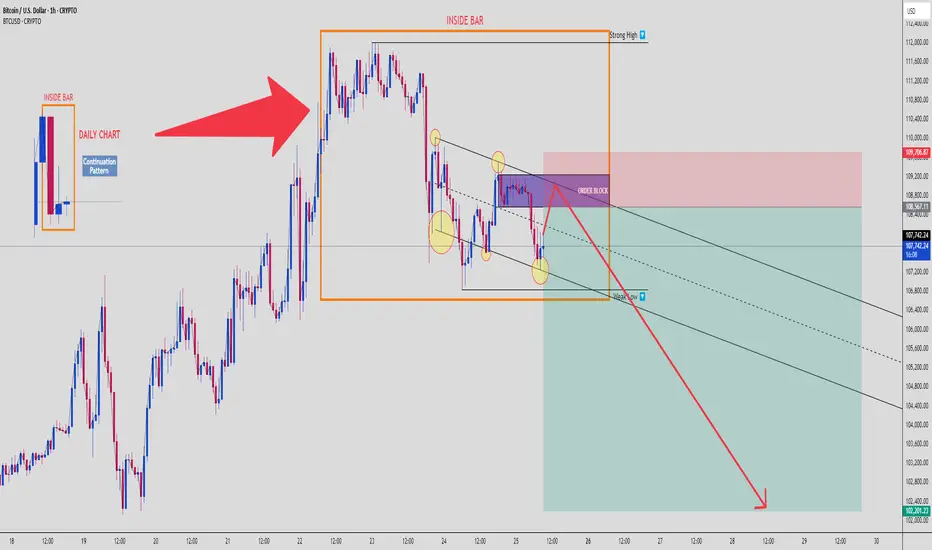
BTCUSD: Inside Bar Trap + Order Block Rejection Targeting $102K📉 Bitcoin | SMC Breakdown | 1H Chart
Welcome to a clean Smart Money setup, where retail gets baited and Smart Money gets paid. Let’s break down what’s happening on BTCUSD, 1H chart, using multi-timeframe confluence and Smart Money Concepts. 👇
🗓️ 1. Daily Chart Confluence
We start with a Daily Inside Bar Pattern – a classic continuation setup, often used by institutions to trap traders before expansion. BTC ranged tightly, then broke to the upside to grab liquidity, not start a rally.
🟥 Daily High = Liquidity Pool
🟧 Inside Bar Range = Manipulation Zone
This is the trap zone.
🧱 2. Order Block Rejection (1H)
Price tapped a clearly defined Bearish Order Block in premium pricing, just above the mid-range of the Inside Bar.
💥 Reaction confirmed:
Rejection candles from OB
Structure respecting downside bias
Fakeout = Fuel for downside expansion
📉 3. Bearish Continuation Structure
Price is moving within a descending channel, respecting internal supply zones. Each lower high is met with supply pressure, and internal lows are swept before moving lower.
You’re looking at a high-probability continuation move toward the weak low marked near $102,200.
🧊 4. Weak Low as Final Target
This level is a classic liquidity magnet – weak lows = retail stop clusters = Smart Money target.
We expect BTC to:
Tap OB
Reject with minor pullback
Break structure
Fill imbalance and target weak low
It’s a beautiful setup if managed correctly.
🧠 5. Psychology & Trap Narrative
Retail is:
Buying the breakout of Inside Bar
Placing stops under weak lows
Ignoring the OB rejection
Smart Money is:
Selling from OB
Riding the imbalance
Grabbing liquidity from below
This is where you flip from reaction-based trading to narrative-based execution.
🧮 6. Trade Setup Summary
📍 Entry Zone: $108,500–$109,700 (OB zone)
🔐 Stop Loss: Above $109,800 (invalidate OB)
🎯 Target:
TP1: $106,500
TP2: $104,000
TP3: $102,200 (Sell-side Liquidity Sweep)
⚖️ RRR: Approx. 1:4 to 1:5 depending on entry
⚠️ Risk Management:
Do not overleverage.
This setup rewards patience and narrative confirmation, not emotional entries. Wait for OB confirmation and rejection.
📈 If this hits, it’s a chart you screenshot and study again and again.
💬 Comment “INSIDE BAR MASTERCLASS” if you’re watching this play out live. Share with your trading circle.
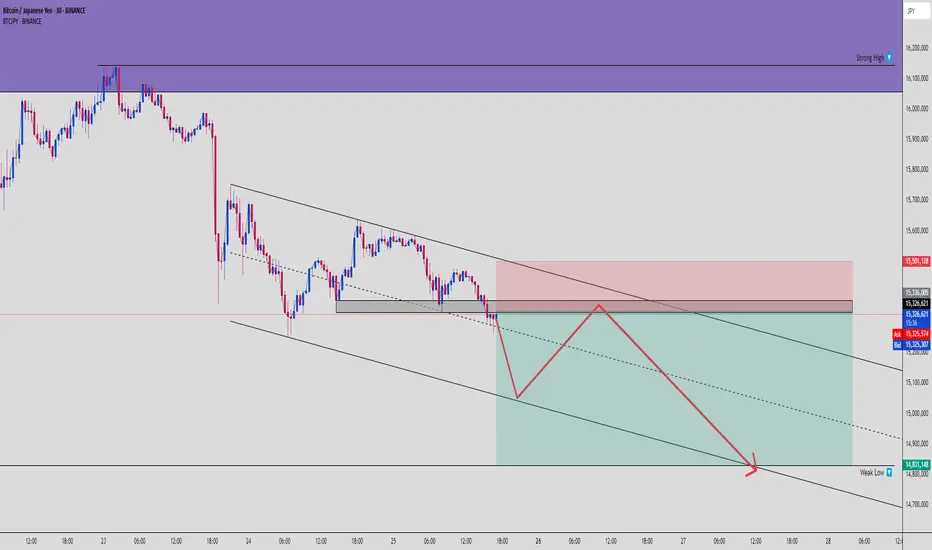
BTCJPY Bearish Channel Setup – OB Rejection to Weak Low Sweep🧠 Bitcoin vs Yen (BTCJPY) | 30M Smart Money Breakdown
BTCJPY is painting the same story we’ve seen before: liquidity builds → OB rejection → channel continuation → weak low sweep. This is how the markets bleed slow then drop fast. Let’s break it down.
🧱 1. Bearish Channel Structure
We’re inside a clear descending channel, where price:
Forms consistent lower highs (supply zones)
Prints lower lows (liquidity grabs)
Shows rejections at channel tops = perfect confluence
This structure supports a continuation downward move.
🧊 2. Order Block + Supply Rejection
Price recently tapped into a clean Bearish Order Block (OB) within the premium zone just under 15.5M.
OB was respected with a sharp reaction
Immediate sell pressure confirms Smart Money entry
Red zone = OB + supply + channel midline
No candle closes above OB = bias confirmed bearish.
🧲 3. Smart Money Flow vs Retail
Retail likely went long on the mini bounce.
Smart Money waited for:
Price to tap into the OB
Retail to stack longs
Opportunity to fill imbalance and dump
This gives us an ideal Sell-to-Buy-to-Sell structure forming.
🕯️ 4. Projected Move: Weak Low Sweep
🧨 Target = 14,831,148
Why?
That’s a marked Weak Low
It aligns with channel support
It’s a known liquidity magnet
Expect acceleration into this zone.
⚔️ 5. Trade Plan (Short Setup)
📍 Entry Zone: 15.315M – 15.33M
🔐 Stop Loss: Above OB → ~15.50M
🎯 Targets:
TP1: 15.200M
TP2: 15.000M
TP3: 14.831M
⚖️ RRR: ~1:4+ depending on execution precision
🧠 Summary:
This chart screams:
“Trap the liquidity, respect the OB, ride the channel.”
These setups repeat. Same pattern, different chart, every week.
📣 Engage Call:
💬 Comment “BTCJPY SHORT SNIPER” if you caught this one
👥 Tag your trading partner – don’t let them miss this play
🔄 Save this chart to study the OB entry mechanics
"GBPUSD Ready for the Kill After Premium Zone Reaction!"⚡ GBPUSD Analysis - 1H Timeframe | April 28, 2025
📈 What's Happening:
GBPUSD just tapped deep into the Premium Zone while simultaneously reacting off a clean Fair Value Gap (FVG).
Signs of bearish rejection are stacking up — Smart Money might be preparing for the kill shot! 🎯
🚨 Key Levels Highlighted:
Strong High = Major invalidation (~1.34317).
Premium Zone = Where sellers ideally step in.
Fair Value Gap (FVG) = Where price imbalance triggered a reaction.
Weak Low = Major liquidity target (~1.32036).
🧠 Key Observations:
Price filled the FVG and immediately showed a reaction = sign of Smart Money stepping in.
Strong High untouched = still valid for bearish play.
Weak Low + Sell Side Liquidity = magnets below.
🎯 2-SCENARIO PLAN:
Plan A — Short Setup (Primary Bias):
✅ Look for bearish confirmation via M15 or M5 structure shift.
✅ Ideal entry around Premium/FVG zone.
✅ TP1 = Minor structure lows around 1.33000. TP2 = Full Weak Low sweep (~1.32036).
✅ SL = Above Strong High (~1.34317).
Plan B — Invalidated if:
✅ Strong High is broken impulsively = setup failed. No chasing!
📊 Risk Management Tip:
"Fair Value Gap reactions inside Premium = sniper-level setups. Focus on confirmations, not assumptions."
🧘♂️ Summary:
✅ Premium Tap ✅ FVG Fill ✅ Bearish Reaction ✅ Weak Low Target
Patience = Power.
This could be the sniper setup you've been waiting for! 🔥
➡️ Save this playbook.
➡️ Comment "SNIPE THE GAP" if you're setting the trap! 🎯

BTCUSD – 5M Premium Zone Rejection | Short Setup Activated🧩 BTCUSD – 5-Minute Breakdown | May 4, 2025
The BoS has happened, but don’t let it fool you — price just entered the danger zone. This is where Smart Money loves to trap late longs and send price tumbling.
🧠 SMC Playbook:
🔨 BoS Identified: Minor bullish BoS after initial reaction from the previous low.
🟥 Supply Zone (Entry Area): 79%–100% retracement zone from the latest swing high to low.
🔄 Reversal Point: Entry just above the 79% zone (95,499–95,629).
🎯 Target: Weak Low = 95,200
🧼 Stop-Loss: Above 95,629 (structure invalidation)
📏 RR Ratio Potential: 1:3 to 1:4+
🔎 Narrative:
Price is engineered to grab liquidity before making the real move. The Strong High acts as protection — Smart Money is defending this area. Once the premium fills, we expect a clean breakdown back into the discount zone.
📊 Key Observations:
❌ Buyers are likely trapped.
📍OB tapped + Fibonacci 79–100% = High confluence.
💥 Expecting liquidity sweep → sharp sell-off.
⏰ Execution timeframe = M1/M5 confirmation (engulfing, CHoCH, etc.)
📣 How to Trade It:
Monitor price action inside red zone (79–100%).
Wait for lower timeframe confirmation (e.g. bearish engulfing, M1 CHoCH).
Short from ~95,500 with SL above 95,630.
TP at Weak Low → potential extension to 94,800 if momentum kicks in.
🧠 Chart Ninja Tip:
“Don’t chase price — trap it. Let price come to you and confirm. The premium zone is where trades go from good to god-tier.”
💬 Drop a 🧠 if you’re watching this level too.
📈 Save this chart for your next sniper entry.
🔁 Share it with your SMC crew and ride the liquidity wave!

BTCUSD Set to Reclaim This Weak High,Watch This Smart Money Zone📊 BTCUSD 30-Min Smart Money Concept Setup
Let’s dissect this high-probability Smart Money setup on BTCUSD, which just tapped into a premium-to-discount range retracement and looks ready to reverse from demand.
🔻 1. Market Context
We saw a strong impulsive move up earlier today, followed by a corrective move pulling back into the 61.8–79% fib zone, lining up with internal liquidity and support zones.
Price just respected that 61.8% level with multiple bullish rejection wicks, indicating a potential bounce.
🧱 2. Key Zones Identified
Strong Low: 102,757.05 — protected for now
Entry Zone: 103,646 – 103,758
Weak High Target: 104,800+
Final TP: 105,788.51 (aligned with -27% fib extension)
The confluence of internal trendline support and fib levels supports the bullish narrative.
📈 3. Trade Setup + RRR
✅ Entry: Around 103,750
❌ Stop Loss: Below 102,800 (beneath strong low)
🎯 Take Profit: 105,780
📊 RRR: ~4:1+
This setup offers a clean low-risk, high-reward opportunity with minimal drawdown.
🔥 4. Why This Is Smart Money Approved
✅ Deep retracement into discount zone
✅ Strong bullish structure + weak high liquidity above
✅ Trendline support confluence
✅ Smart Money targeting liquidity
✅ Higher timeframe bullish bias still intact
💬 Type “⚡️BTC Weak High Raid Loading” if you’re riding this wave too!
🚀 Follow @ChartNinjas88 for more precision Smart Money plays like this.

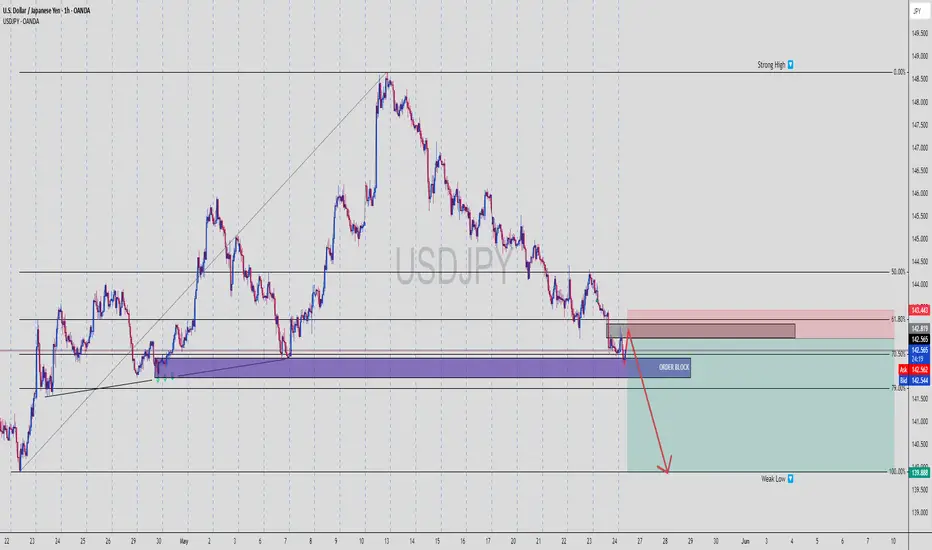
USDJPY Just Flipped — Liquidity Has a New Target🧠 Smart Money Breakdown: USDJPY | 15-Min Chart
We’ve got a textbook bearish reversal setup forming right now on USDJPY, and Smart Money traders are paying close attention.
🔄 1. Change of Character (ChoCh)
The first key sign was a ChoCh, which flipped the internal structure from bullish to bearish. This signals a potential shift in market control from buyers to sellers — Smart Money often initiates big moves after such a flip.
🟫 2. Bearish Order Block + Rejection Wick
Price pulled back right into a fresh bearish Order Block (OB) around the 148.056–148.337 zone. This OB lines up perfectly with the upper trendline + internal liquidity area.
Price is now rejecting hard from this level, signaling Smart Money sell-side pressure.
🕳 3. Fair Value Gap (FVG) Below
Below current price lies a clean FVG, serving as a magnet for price. Smart Money often targets these imbalances to rebalance the market.
The gap extends from around 146.200 to 147.400 — with Sell Side Liquidity resting right below at 145.872. That’s the likely kill zone. 💀
📐 4. Trade Setup (R:R Approx. 3.5:1)
🔼 Entry Zone: 147.980–148.050 (inside OB)
❌ Stop Loss: Just above OB: 148.400
✅ Target: 145.872 (Sell Side Liquidity sweep)
Perfect for swing traders and intraday SMC setups.
📊 Strategy:
Look for:
Bearish engulfing candle confirmation
Break of minor internal low (lower TF BOS)
Entry on OB rejection with tight SL above high
Bonus: Enter partials on FVG fill, hold runner to liquidity.
📎 Confluences:
✅ ChoCh confirmed
✅ Bearish OB
✅ Price rejecting from premium zone
✅ FVG below = imbalance magnet
✅ Sell-side liquidity clearly marked
⚠️ Risk Reminder:
Let price show intent before jumping in
Use confirmation, not assumption
Trade what the chart says, not what you hope
🔚 Summary:
Smart Money has flipped the script. With a strong ChoCh, OB rejection, and an FVG inviting price lower, this setup screams bearish continuation.
🔻 Expecting a clean run into liquidity. Stay sharp. 🧠
💬 Drop a “💀” if you’re eyeing the same setup.
📈 Follow for more clean SMC plays weekly.

XAUUSD 1H | Bearish Order Block Reaction + Liquidity Sweep🔻 XAUUSD 1-Hour Breakdown — May 14, 2025
Gold gave a strong supply rejection at a marked Order Block zone. This isn’t just a pullback — it’s a potential continuation setup targeting lower lows. Here’s what’s cooking:
🧩 1. Market Structure
Clean rejection from premium OB zone at ~$3,220
Massive bearish impulse candle right after sweeping demand zone liquidity
Price formed a lower low and is now forming a lower high
🛠 2. Key Confluences
🟪 Order Block: Solid rejection with no candle closes above
💧 Liquidity Sweep: Deep wick into OB zone → trapped breakout buyers
🔺 Strong High Protected: Market respects structure, suggesting continuation
🔻 Weak Low Targeted: Clean draw to imbalance & potential sweep zone near $3,116
🧠 3. Trade Setup
Entry: Rejection near $3,207–3,220 OB
SL: Above $3,229 (invalidates structure)
TP: First TP zone near $3,116, extended TP: $3,100
RRR: 1:4 to 1:6 setup depending on partials
⚠️ 4. Risk Management
Watch for NY session reversal attempts
Secure profits at first demand zone reaction
Consider trailing stop above last bearish engulfing candle
📌 Price respects structure. If bulls don’t step in quick, sellers will run the table. This is a classic SMC bearish continuation off OB + liquidity grab — don’t sleep on it!
💬 Type “🔻” if you're riding this short wave with us!
🎯 Follow @ChartNinjas88 for sniper SMC plays every day!

BTCUSD Rejection Setup – Order Block Hit, Weak Lows in Sight!📉 BTCUSD is setting up a textbook bearish reversal — Smart Money style.
This 1H chart shows Bitcoin tapping into a high-timeframe Order Block at ~$104,190–104,560, with a clear rejection from the premium zone and confluence with the upper trendline.
📊 Technical Breakdown:
✅ Order Block tapped at $104,190–104,560
✅ Strong rejection candle near the trendline resistance
✅ Price failed to break above the Strong High — a sign of Smart Money distribution
✅ Targeting Sell-Side Liquidity at $101,420
✅ Final target? Weak Low and liquidity pool around $99,189
🔍 Smart Money Confluence:
Price has moved into a premium selling zone, aligning with the upper bounds of market structure
Order Block rejection suggests institutional selling interest
Weak lows below $100K are prime targets for liquidity grabs
Retail longs are likely trapped — ideal conditions for a downward sweep
🧠 Institutional Logic:
Smart Money doesn’t chase price — it delivers it. This move likely represents a "Mitigation and Distribution" phase before a deeper selloff:
📌 Mitigation of previous long positions inside the OB
📌 Distribution at the highs before targeting the next liquidity pool
📉 Trade Idea:
Short Entry Zone: $104,200–104,500
Targets:
TP1: $101,420 (Sell-side Liquidity)
TP2: $100,000 (Psych level / Weak Low)
TP3: $99,189 (Liquidity Magnet)
Invalidation: Clean break and close above $104,800 (above the OB and Strong High)
🧠 Tip for Traders:
Wait for a confirmation bearish structure shift or lower high on the LTF (15m/5m) before entering full size. Smart Money leaves clues — not impulses.
💬 Comment "BTC Setup" if you’re trading this drop
🔁 Save this analysis — this is how Smart Money dominates crypto markets.

Order Block Rejection with Channel Breakout, Smart Money at Work🧠 BTC/JPY Smart Money Breakdown — May 17, 2025
This setup is a textbook bearish reaction off an Order Block right at the top of a rising channel. Let’s dive into what the big money is doing behind the scenes ⬇️
🧩 1. Context
Market was respecting a rising channel on 15m
Price made a final sweep of internal liquidity into a:
🔴 Red Order Block
📏 Premium zone above the mean
Now we’re seeing a strong bearish displacement candle closing outside the structure 👀
🎯 2. Trade Setup
Entry zone: 15,090,000–15,150,000 (Order Block zone)
SL: Above 15,150,000
TP Zones:
TP1: 15,000,000 (psych level + OB base)
TP2: 14,900,000
TP3: 14,829,228 (full imbalance fill + liquidity resting zone)
➡️ Risk-to-reward ≈ 1:3+, depending on exit
🔍 3. Smart Money Confluence
Order Block rejection: Institutional footprint
Break of channel support: Sign of displacement
Liquidity sweep: Retail breakout bait → SMC trap
Momentum candle shows no hesitation — bearish intent confirmed
If you want sniper trades that flip zones into gold, this is it.
📉 Wait for a possible retest if missed — price might kiss the OB again before further melt.
🧠 Final Thought:
The JPY strength + BTC weekend illiquidity combo makes this setup extra spicy. Stay sharp for potential retests or lower timeframe entries 🔍
💬 What’s your bias? Will BTCJPY keep dumping or fake the break? Let’s debate in the comments 👇
🧠 Tag your trading buddy & follow @ChartNinjas88 for daily Smart Money insights.

BTCUSD 15M | Order Block Slam + Channel Break | 1:4+ RRR Setup🧠 BTC/USD Breakdown — Smart Money Style | May 17, 2025
This one’s textbook bearish premium reaction — the kind of move that wipes out late buyers and fills institutional orders. Let’s zoom into this juicy setup ⬇️
🧩 1. Smart Money Context
Price climbs inside a rising wedge structure
Enters premium zone and taps a defined 🔮 Order Block (OB)
OB rejection confirmed with:
Liquidity grab
Bearish engulfing
Channel break 🚨
🎯 2. Trade Details
Entry: 103,500 – 103,800 (OB zone)
SL: 103,850
TP Zones:
TP1: 103,000 (OB base)
TP2: 102,500
TP3: 101,420.70 (full breakdown completion + imbalance fill)
Risk-to-reward: 1:3 to 1:4.5+ depending on your exit style.
🔍 3. Why This Setup Works
Order Block marks institutional selling zone
Liquidity sweep triggers false breakout trap
Channel break with volume confirms momentum shift
Final candle closes with strength — this ain’t no fakeout
This is how smart money loads up and leaves retail chasing ghosts 👻
📉 Missed the initial entry? Watch for a pullback to the OB for a possible second chance!
🔥 Final Note:
The weekend price action often moves erratic, but this setup shows institutional control — wait for confirmation and let price do the heavy lifting 🧘♂️
💬 Drop your thoughts: bullish retest or straight dump incoming?
📲 Follow @ChartNinjas88 for clean, no-BS smart money analysis every day!

ETH Just Slapped Into an Order Block — Next Stop: Dump City?🔎 Ethereum Smart Money Sell Setup | May 17, 2025
The ETH/USD 30-minute chart just gave us a juicy bearish confirmation off a clean Order Block rejection, wrapped in a downward sloping parallel channel — exactly what smart money watches for. Here’s the breakdown:
🧩 1. SMC Narrative
Price tagged a bearish OB right at the mid-supply zone 🟣
Followed by strong engulfing rejection candle
Breakdown from the minor trendline support → confirms bearish shift
Order block lines up with the premium zone of the overall bearish channel
Retail might think this is support — we see liquidity 👀
🎯 2. Trade Specs
Entry: ~2,516.09 (OB upper edge)
SL: 2,520.00
TP Zones:
TP1: 2,476.99 ✅ (almost hit)
TP2: 2,450
TP3: 2,409.47 (final target at channel low)
Risk-to-Reward: Approx 1:4.5
🛠️ 3. Why This Setup Works
Price delivered a channel breakout + OB rejection combo
Strong volume spike during the OB touch = institutional activity
The bounce off the OB is weak — signaling exhaustion
All signs point to a grind down to lower channel support
If you know, you know — this is how banks exit in stealth mode 🚪👻
🎯 Bonus Tip:
If ETH retests the OB zone again with weak bullish candles — that’s your secondary sniper entry 🎯
📣 What’s your bias? Think bulls can reclaim this OB, or are we headed straight into deeper discount pricing?
📲 Follow @ChartNinjas88 for daily laser-focused setups, SMC concepts, and precision trading breakdowns!

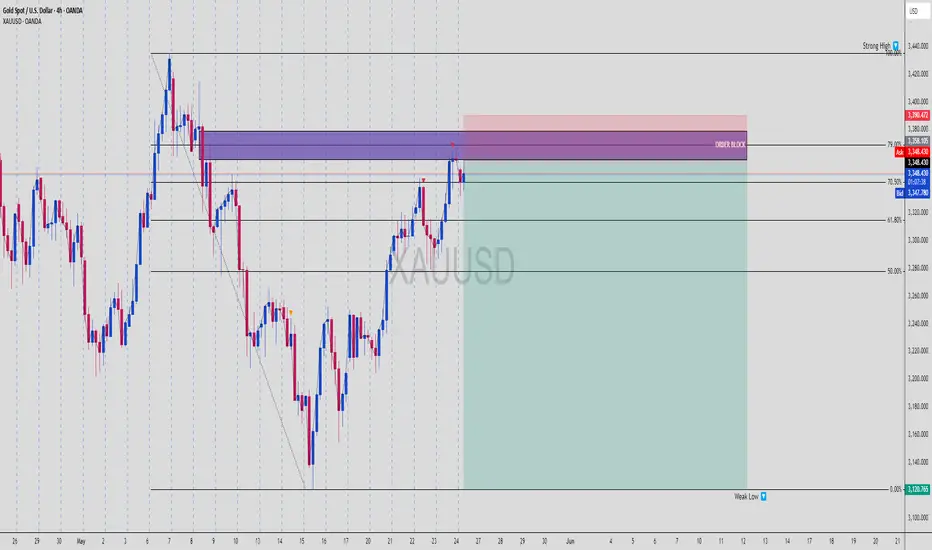
XAUUSD Taps Premium OB – Bearish Liquidity Trap Incoming!📉 XAUUSD Smart Money Setup – Bearish Rejection from Premium Supply Zone
Let’s get straight into it, fam. Gold (XAUUSD) just made a textbook move into a premium Order Block, and it’s screaming liquidity trap + reversal opportunity.
🧠 Market Structure Breakdown:
✅ Clean internal bearish structure
✅ Lower highs and lower lows maintained
✅ Current price rally = retracement into OB, not a reversal
This is a pullback into premium, designed to bait breakout buyers before slamming back down. Smart Money 101.
🔮 Key Confluences:
🟣 Order Block Zone:
3,290.000 – 3,331.405
Origin of impulsive bearish move
Aligned with supply imbalance and unmitigated sell orders
Tapped perfectly at 61.8%–79% Fib levels
🔻 Fibonacci Retracement (Swing High to Low):
50.0% → Current market price (3,286.370)
61.8% → OB mid zone
70.5% – 79% = ideal entry zone for institutional short positions
📍 Target Zone:
3,120.765 (0% Fib)
Solid RR with minimal drawdown potential
🧠 Smart Money Narrative:
Market induced sellers at the low
Rallied back up aggressively to entice breakout longs
Now entering sell-side OB where Smart Money is looking to unload positions
Retail sees a “breakout” — we see distribution. 💼
💡 Entry Strategy:
📌 Entry: 3,290 – 3,331 (OB + 70.5%–79% Fib)
📌 Stop Loss: Above 3,333 zone
📌 TP1: 3,210
📌 TP2: 3,150
📌 Final TP: 3,120
🎯 RRR: 1:4.5++ – chef’s kiss for swing traders
🔁 Risk Flow Checklist:
✔️ Structure confirms bearish bias
✔️ OB unmitigated + untouched since initial drop
✔️ High-volume price sweep prior to tap
✔️ Clean internal liquidity grabs before entry
This is the kind of setup you wait for — not force.
🧘 Pro Tip:
Let the OB do the heavy lifting. Don’t chase price — wait for the rejection signal:
Wick rejection
Bearish engulfing
Shift in internal market structure
Patience = profits. 💸
🧨 Summary:
This XAUUSD chart is a Smart Money masterclass:
Clean bearish BOS
Premium OB with Fib confluence
Trap setup above liquidity
Big RRR with minimal exposure
🗣️ Comment “GOLD SNIPER” if you caught the tap!
🚀 Save and study this setup — they don’t come often, but when they do, they pay big.
