NZD/USD LONGSet up was identified on the higher timeframe, after market returned to the higher timeframe ob we saw a the entry we were looking for. Join my class and learn to trade with the banks. Start using stop loss below 10 pips. Use bigger lots and risk less.
Orderblock

GBPAUD... MASSIVE 17RR OPPORTUNITYHello traders,
I'm not really a fan of trading these pairs (EURAUD, EURNZD, GBPAUD, GBPNZD). Why? they come with more than usual spreads which make the limit orders not to be triggered. Nevertheless, I will place a limit order for this pair once this market opens tomorrow.
Just like the EURAUD, this pair is taking a breather before continuing the bearish move. You might wonder if there is any liquidity trap, well if I must say, there is always a trap but might not be visible on this timeframe. If you go lower, you might find,
Anyways, like if you agree.
Cheers!!!

[Netflix] When will the crash end?#Netflix #NFLX #NASDAQ #Daily
- Here’s NFLX Daily chart. It recently has shown a huge drop about 73% from the historical high at $700.
- During the fall, it made a consolidation zone (HVP: High Volume Peak) around $330~$400 surrounded by big gaps.
- Currently NFLX reached 0.705 retracement level of the impulsive wave which also happens to be the bottom of the blue falling channel.
- Also, there are some of major HVPs that were formed at 2017 at current price level and thus I believe this area is a PRZ(Potential Reversal Zone), expecting some technical price actions.
- If it falls a bit more, some attractive buy zones are $153~$168 and $82~$97 which are confluent zones of trendlines, Fibonacci retracement levels, stop hunting level of an impulsive wave, and POC (Point of Control) levels of major contractions.
- Some resistances that I am considering are $288~$303, $373~$388, and $443~$458. If you are looking for more conservative spot, I would recommend you to wait until it breaks the blue falling channel above and until then, I would maintain my bearish perspective.

EURAUD Analysis using ICT and Liquidity advanced UnderstandingSo in daily bias, it is looking we are going to turn bullish soon, but the orderblock marked at the bottom hasnt yet been mitigated, and it created a inducement OB above it, which means it becomes sellside liquidity that is targeted at the moment, so we can take a sell, do not enter without confirmation
The market still hasnt broken the Buyside, if it does, then we may expect a mitigation downwards then upwards

XAUUSD GOLD - BUY TO SELLPrices broke structure to the upside, came back for a retest onto demand area. Look for ways to get involved in buys and sell at supply.

LONG EURUSD ✅✅✅Here I expect bullish price action as the price took the liquidity below previous daily low and rejected from the bullish orderblock and institutional figure 1.08000. The price has to take buy side liquidity and previous daily high liquidity where we have a lot of stop losses, we can correlate this move with DXY Index.


FinallyI will give detailed explanation to my bias and share my analysis before executing my trades from now. Thanks for the likes lol

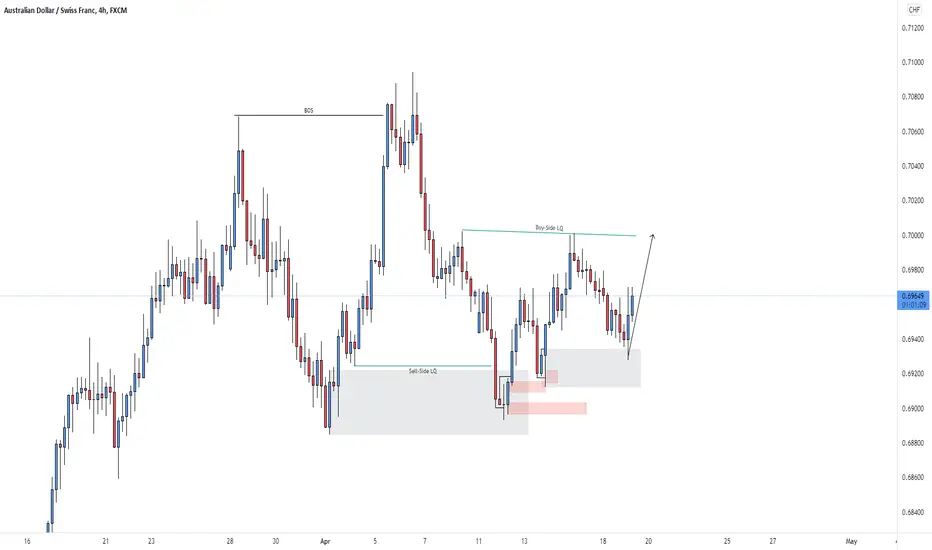
AUDCHF H4 - LONGPrice started to deliver bullishly, being aligned with the larger structure looking for a move into buy-side liquidity.
Betting my lungs on thiswe are in a bulish environment on the Daily, price tagged 4H OB and I expect a bullish continuation to at least 1.30830

⁉️ AUDCAD Weekly Analysis ✅ Here on Friday a entered too fast and get a SL, but now I think it's a conservative entry as the price closed the H4 imbalance. I expect the price could go a little bit lower to take the PWL (previous weekly low) and reject from the H4 OB (order block) + institutional figure 0.93000.
Like and comment below if you think this is a great post!

⁉️ EURCHF Weekly Analysis ✅ Here I expect a bearish price action as we are in a bearish market structure and the price took the BSL (buy side liquidity) and rejected from the daily bearish order block + institutional figure 1.02000.
Like and comment below if you think this is a great post!

AUDUSD sell entryChecking the Weekly timeframe the Bulls seem to be exhausted after the price filled a price imbalance up to 90% and respected a Bearish Orderblock which is also a quarterly high.
On the 4hr timeframe, the price has begun by going lower which I believe is the Judas swing. The equal lows of Friday have been taken out.
I'm anticipating that the price will now go up to the equal highs which will be taken out so that the market can give us a second chance to enter short.
Like and Subscribe.

See What I See? 1:13R EURCAD Down 👀👀Supply candles one of the best strategies i've known.
small risk and high profit is promised, but also need to find the right ones.
I had to share this chart with you.
If you liked the idea please like and follow,
and maybe I will upload ideas like in the past.
not recommendation, only my opinion.
you responsible for your money

VLXUSDT wants the new liquidity for a new bullish impulseThe price had an impulse after my previous analysis and now the price is testing again the dynamic support on the daily timeframe.
On the weekly timeframe, the price is going to create a triple bottom on 0.2$.
the price has a Demand cluster of 0.20, and we could see a spike on it in order to grab new liquidity for the new bullish impulse
How to approach?
We are monitoring the price, the price could have a bounce on the weekly dynamic support and get liquidity for the new breakout from the daily resistance on 0.23$
According to Plancton's strategy , we can set a nice order
–––––
Keep in mind.
🟣 Purple structure -> Monthly structure.
🔴 Red structure -> Weekly structure.
🔵 Blue structure -> Daily structure.
🟡 Yellow structure -> 4h structure.
–––––
Follow the Shrimp 🦐1

nas100 nas will continue to drop we have a broken trend so all its doing is retracement, so looking for buys in this green areas i marked and holding long

Going up?Price has reached our weekly bear orderblock level and we see price consolidating. We want to see a good bear reaction form that level.. This may unfold prolly tomorrow or next week. Just waiting for the right time. 90% waiting 10% trading

Blue Thursday This is a trade we took today on EurUsd based on market structure and invalidation points... trades still running with partials taken. We are still bearish but longterm bullish on the DXY just waiting for confirmation for short term sells.Good Luck Good Trading


is OB = 0.886 fib (OBSERVATION)Is 0.886 fib an OB level or are we just speculating? well in short idk😉 you find out on your own, i have been back testing this thing for the past few weeks and almost in all cases im seeing some correlation between the two, but why? well idk😂 its basic math at this point i mean order blocks are areas where price made some form of lows or highs, so at those areas if price revisits there might be an opportunity for good reaction those areas are almost in all cases at the 80% of the move up.
Why do i think 0.886 is better than OB?
OB is dynamic, you don't clearly understand which OB to use 15m 30m etc.... why not 25min (this is something i had in mind when i first learned about OB). While in the case of fib its an exact level, we expect price to move at a specific value instead of a dynamic area.
is 0.886 something you made up?
www.youtube.com
Keep in mind this is just an observation so DYOR and backtest before you come to a conclusion.

[Twitter] Will the blue bird fly high?#Twitter #Stocks #NYSE #Daily
- Twitter, known to be world’s biggest social network platform recently had a good issue that Elon Musk has acquired about 9.2% stake.
- If you look at the chart, about 70% bullish rally has appeared with a huge gap.
- The black long-term upward parallel channel has been re-entered from the bottom and thus this bottom will be potential support for a while.
- In Elliott Wave perspective, I think this impulsive bullish wave is B. If Twitter successfully break the blue falling channel and the orange downward trendline above, this scenario might be wrong meaning that I will be very bullish.
- Until then, I would say buying in between my first support and the blue channel and orange trendline is not the best idea.
- For those looking for a new entry to buy, it would be either breakout entry above or pullback entries at my supports at 44.60~46.60, 39.30~ 41.30, and 33.30~ 35.30.
- Resistances that I am keeping my eyes on are 55.80~57.80, 62.40~64.40, and 68.40~70.40.

GBPUSD Long With An Order Block RetracementHi Traders,
We are on the 4-Hour Chart.
I am looking for GBPUSD to retrace into the yellow box.
My long position will open once the retraces touches the middle of the yellow box.
We have added confluence with price respecting the trend line and looking to move higher.
The Daily chart is looking like it wants to break out higher.
I am targeting previous wick highs.
My RR is 1/3
Trade safe and hope you are all having a fantastic week.
The Vortex Trader

My two Order Block entries this eveningTwo simple setups, not every OB will work
Backtest why these did, and you'll have enough to profit, every single time.
