GBPUSD SHORT (SELL LIMIT)Conformation's:
1.Potential Liquidity Grab (Trigger)
2.Short on order block/ Supply zone
3.Price left zone with high volume
4.Break of structure
5.4H downtrend market structure
Orderblock

EURUSD: Based on Order Block, still ShortBased on order block, I think it might be short and then up!

Weekly Gold AnalysisWe have recently broken a swing high
this triggers the algorithm to seek higher prices
In order for them to do so they need to create a swing low
to get in trend with the market.
The algorithm buys in down candles not up candles.
We also broke a swing Low on the weekly when gold traded to 1780.
If we don't break the Previous weeks high this will complete the weekly swing High formation.
Once it is formed we can go short on the 3rd candles low.

Gold update As you can see from my previous post on January 31st
I showed you why I was long on gold
and I bought at 1799
Today Gold sits at 1857.

EURUSD 30M - SHORTPrices started to deliver bearishly, looking for a supply area for us to get involved.

EUR/USD AnalysisLong bias short term, short bias long term. My first analysis here, so not much to say.
Just currios long term how it will play out.
Cheers!

AUDCAD 2hAccording to the observable conditions, in 2 hours timeframe , a short-term signal according to the drawn path can be expected. But remember, anything can happen in this market.

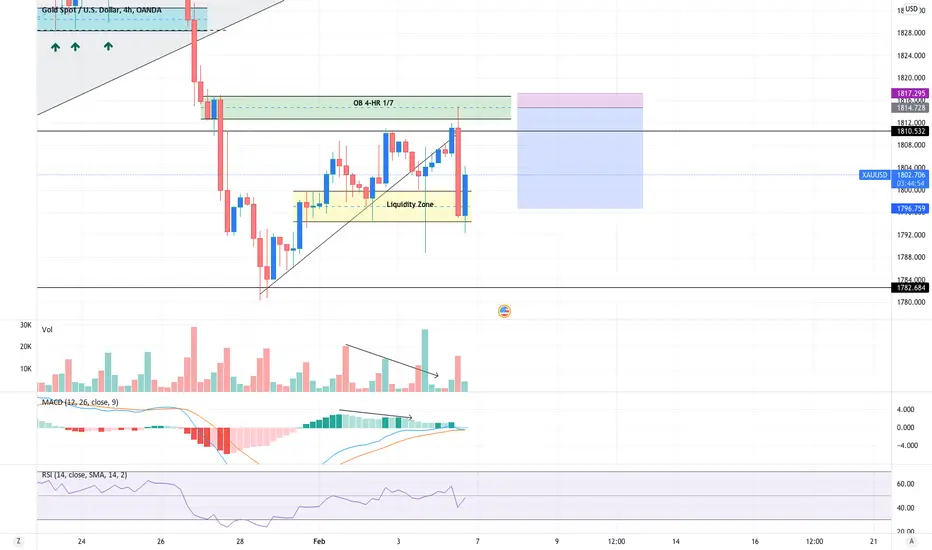
4-Hour Order Block Madness On Gold!It’s NFP Friday today.
You know what that means—volatility Volatility Volatility.
I always avoid staying out of the markets on NFP day but let’s still look at what gold did today.
We are on the 4-hour chart.
I have marked up an order block, as you can see on the chart. An order block is an area of interest that market makers use to access extra liquidity, which they can then use to push the price higher or lower. I’m the case of going short; I would always use the most recent bullish candle before an impulse lower. As we can price came right into the order block before dropping lower.
This is what sniping is.
I don’t usually trade order blocks on the 4-hour. However, this one was too good not to show.
If you were looking to short Gold ( XAU ), You would have opened a short position in the middle of the OB. This is always a safe play. Put your slightly above the OB High, and your target would be the liquidity zone. This would have given a nice 1/7 RR.
Order block sniping requires much backtesting and creating your own set of rules – just like any other strategy.
This is a textbook example of how price returns into the OB zone to collect liquidity before moving lower.
Interesting? Yes,
Would I trade this on NFP day? No
Let’s keep watching and see if gold can present us with any setups next week.
Have a good weekend, traders.
US30 SELL ANALYSISLooking at US30 on M30 Timeframe
Price has broke the market structure
Upon retest on the OB we should see a rejection and look for a potential Sell

GBPJPY 15M - SHORTPrices are tapping into a H4 supply, looking for a 15m raid and a change of character (CHOCH) before sells.

330 pips bagged and I called the swing right here on tradingviewI made it clear when I sent out this signal that if you're taking this trade, that you should hold with a swing mindset and 330 pips later, boom 💥 !...
With a 20 pips stop loss from 1.11200, we bought and held till price hit 1.14500...the data is all here !.
Divergence at the end of a trend cannot fail you when you know how to trade it, especially when italigns with your other confluences and then the smart money concept of order blocks and break of market structure and the likes.
Go ahead and view my profile here, you will find out that 98% of my ideas here are all divergent trades !.

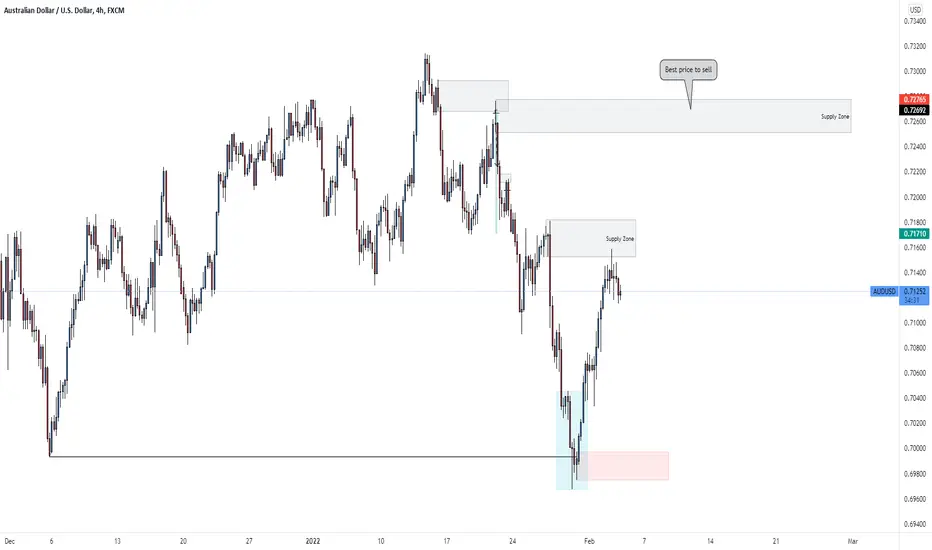
AUDUSD H4 - SHORTWe have 2 supply areas to get involved. Of course the best price being the highest area of supply. Similarly, look for 15m choch to get involved.
BTCkBTC currently at a support line on linear as is technically on two support lines on log chart. Im still bullish for $40k next major resistances after that is the D1 orderblock sitting around $46-47k. Global markets green at the moment of writing, im bullish


EURGBP BUY ANALYSISPrice has broken out of the trendline
Price has created a Low and High
Price has retest the order block creating a HL

BTCUSDStop Hunt, Break in Market Structure, buying the Return to Order Block. Targeting opposing Order Block and the Buy-Stop liquidity above.

Gold High Probability Swing Weekly SetupHello, Traders as you can see we broke a swing high.
Then we created a swing low.
When a swing high is broken the algorithm wants
To seek higher prices.
In order to do so they have to create a swing low to get in trend.
Remember the algorithm buys in down candles not up.

DXY Weekly Draw UpdateHello, Traders here's my weekly chart for the dxy updated
by the way there's a typo on the chart
meant to say a Swing low will form near the OB
I wish you all good luck and good trading.

XAUUSD LONGAfter finding the daily support level, price has made a reversal with Daily imbalance that needs to be filled aswell. refined to m30, we can see price returning to fill in an order block from the rally and that is where our entry will be


AUDUSD H4 - BUY TO SELLPrices did broke structure to the downside, and now potentially giving us a change of a character to the upside. Wait for the H4 choch before taking buys into the supply.

XAUUSD Daily ChartHello, Traders as you can see price respected the orderblock at 1850 and rallied down to 1800. I was expecting fomc to be more volatile and for gold to rally up from 1820. However, that wasn't the case. As gold is entering a discount market Im waiting for gold to drop down into the Bullish orderblock and ideally be buying at 1880 which is a algorithmic level. We know the algorithm seeks the 20-50-80-00 numbers. I wish you good luck and good trading.

NZD/USD Weekly Forecast Hello, Traders here's my analysis on NZDUSD
Im undecisive on NZDUSD at the moment
I will have to wait for Monday
to have a clear direction.
I wish you good luck and good trading.
