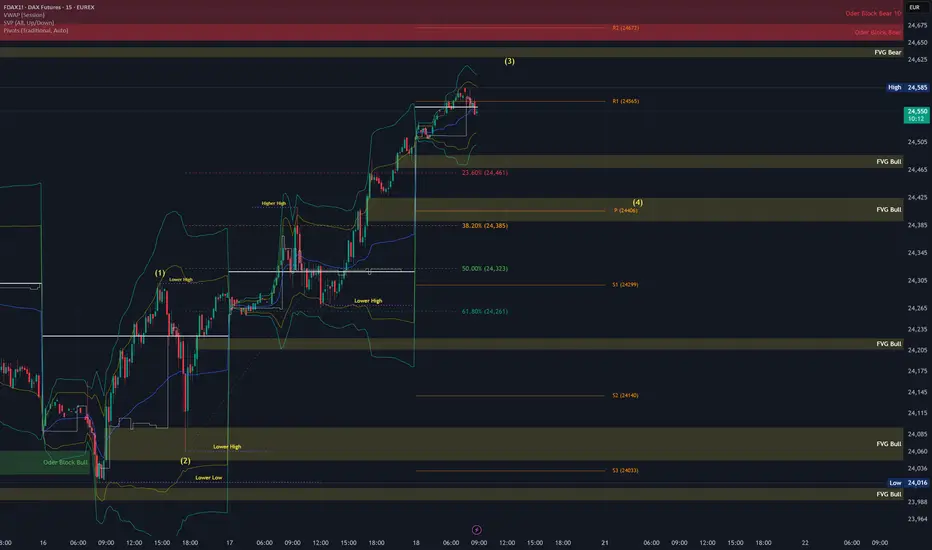
FDAX Today 1. Wave (3) likely near completion:
Price hit the 1.618 extension of Wave 1, which is textbook for a Wave 3 target.
There’s also confluence with the 23.6% retracement from the previous swing high (24,703), and we're near a Bearish FVG + Order Block zone.
High-probability zone for a short-term rejection or distribution top.
2. Wave (4) could start today
If Wave 3 is topping into OpEx, dealers might unwind long gamma hedges, contributing to volatility + pullback.
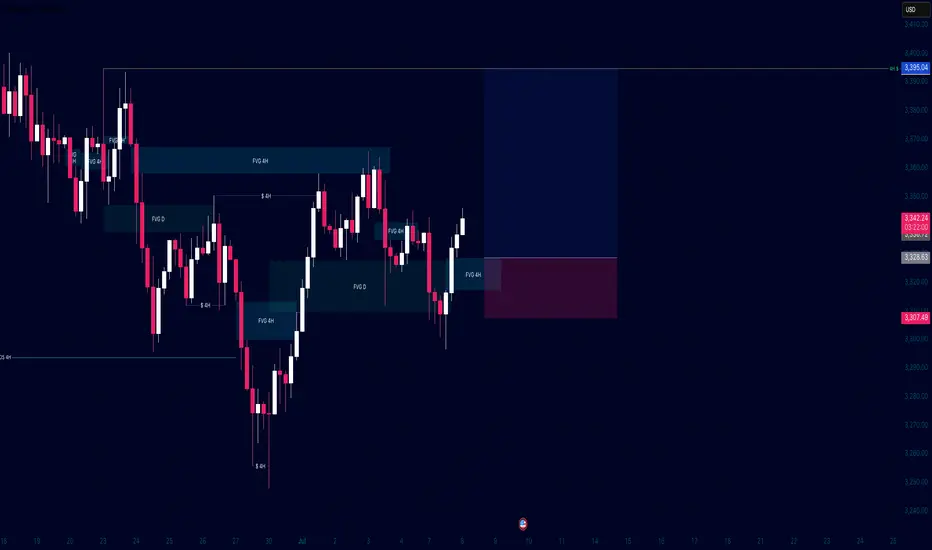
Orderblocks
Sterling Rebounds But Faces Heavy Resistance Ahead GBP/USD Outlook – Sterling Rebounds But Faces Heavy Resistance Ahead
🌐 Macro Insight – UK Labour Data Mixed, Trump Headlines Stir Market
The British Pound (GBP) regained some lost ground against the U.S. Dollar after the UK labour market data revealed mixed signals:
Wage growth cooled as expected, suggesting a potential easing in inflationary pressures.
UK ILO Unemployment ticked up to 4.7%, raising concerns about labour market fragility.
Meanwhile, in the U.S., President Trump denied reports about firing Fed Chair Powell, briefly easing tensions and stabilizing USD demand.
With both currencies facing mixed narratives, GBP/USD is set for a pivotal move, and traders should stay alert to key liquidity zones and order blocks.
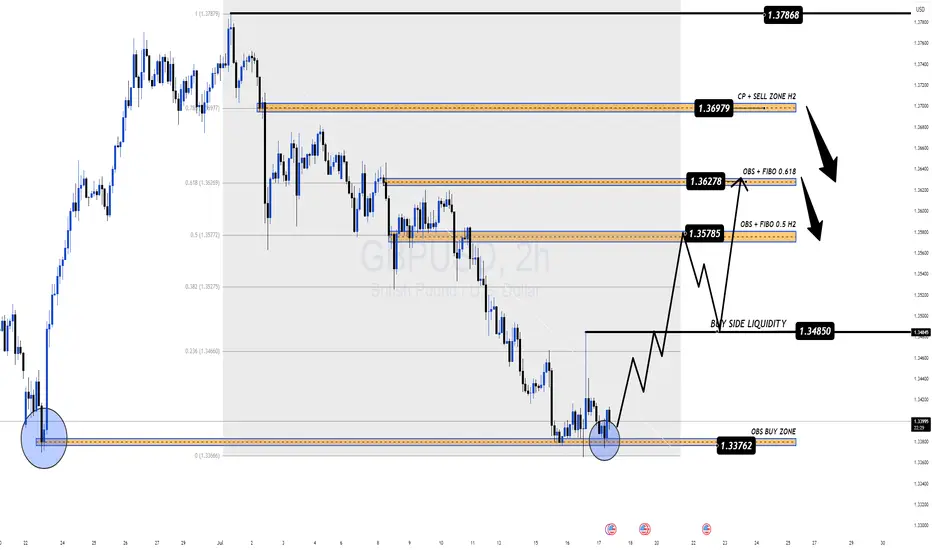
🔍 Technical Setup – MMF + Smart Money Framework
On the H2 chart, GBP/USD has reacted from the OBS BUY ZONE at 1.3376, bouncing with a bullish structure and forming a potential continuation pattern. Price is now expected to target key zones above, where significant order blocks and Fibonacci confluence reside.
⚙️ Key Resistance Zones:
1.3578 – 0.5 Fibonacci Retracement + OBS
1.3627 – 0.618 Fibonacci + Supply Zone
1.3697 – CP Continuation Pattern + H2 Order Block
These areas represent institutional interest for potential sell setups.
✅ Trade Plan for GBP/USD
🟢 BUY ZONE: 1.3376 – 1.3398
SL: 1.3360
TP: 1.3450 → 1.3485 → 1.3530 → 1.3578 → 1.3627
Look for bullish structure confirmation before entering. Target the next liquidity highs and imbalance zones.
🔴 SELL ZONE: 1.3627 – 1.3697
SL: 1.3735
TP: 1.3580 → 1.3530 → 1.3480
Watch for rejection and bearish divergence at supply areas to time potential swing shorts.
🧠 Strategy Notes
This setup combines MMF zones with institutional volume and price action concepts. The pair is currently reacting to a deep discount zone and may climb toward premium levels where selling pressure awaits. Be cautious during New York session volatility, especially with potential U.S. policy headlines and upcoming global inflation data.
🗨 What’s Next?
Are bulls ready to reclaim control or will resistance zones cap this recovery? Drop your ideas below and don’t forget to follow for more institutional-grade insights powered by MMF methodology.
AUDJPY - POTENTIAL?USDJPY is getting super interesting.
If we can get some bearish intent to try and induce the early sellers to the downside creating some buyside liquidity then i will be all over this for a trade.
Lets see how price has moved by the morning as it does need a bit more development before we can consider entering for a short position

July 13, Forex Outlook : This Week’s Blueprint to Profit!Welcome back, traders!
In today’s video, we’ll be conducting a Forex Weekly Outlook, analyzing multiple currency pairs from a top-down perspective—starting from the higher timeframes and working our way down to the lower timeframes.
Currency Pairs:
EURUSD
USDCAD
AUDUSD
EURGBP
EURJPY
GBPCHF
USDCHF
NZDCHF
NZDUSD
EURNZD
Our focus will be on identifying high-probability price action scenarios using clear market structure, institutional order flow, and key confirmation levels. This detailed breakdown is designed to give you a strategic edge and help you navigate this week’s trading opportunities with confidence.
📊 What to Expect in This Video:
1. Higher timeframe trend analysis
2. Key zones of interest and potential setups
3. High-precision confirmations on lower timeframes
4. Institutional insight into where price is likely to go next
Stay tuned, take notes, and be sure to like, comment, and subscribe so you don’t miss future trading insights!
Have a great week ahead, God bless you!
The Architect 🏛️📉

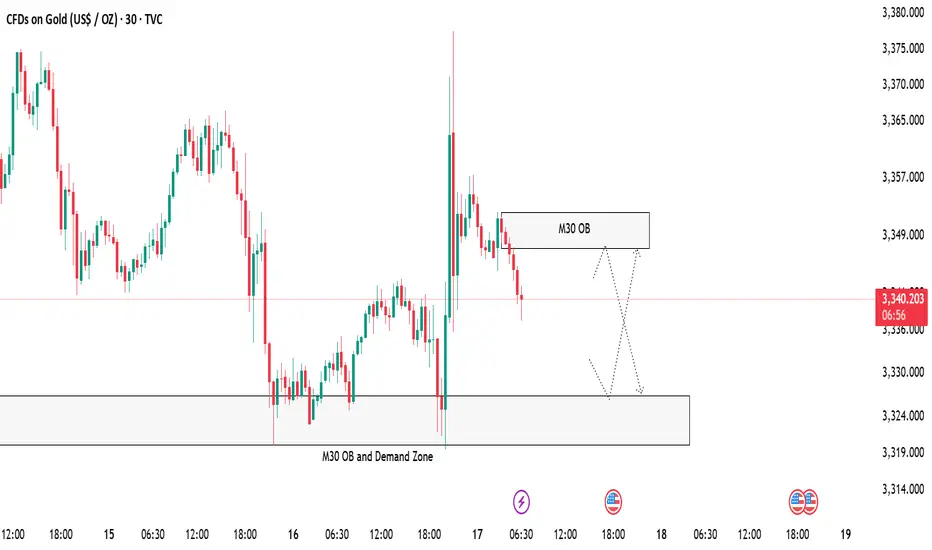
Gold 30-Minute OB and Demand Zone SetupGold is now approaching a 30-Minute Order Block along with a strong demand zone 🟢. We are expecting some clean reactions from these areas.
📌 Plan:
Scenario 1:
👉 If price respects the M30 OB and Demand zone area at 3327 -3320, we can look for bullish signs like rejection wicks or bullish candles to enter buy positions 📈, targeting the upper zone M30 OB zone near 3347 🎯.
Scenario 2:
👉 If price tap the above 30 min OB near 3347 we take our sell or short side entries for a reaction from there entering short ✅.
Both scenarios are possible, so we will watch the price action closely 🧐 and only trade with confirmation!
Gold Trade Setup Eyes on 15M Demand ZonePrice is coming close to 3338, where we have a 15-Minute Order Block (OB) 📍. This is a fresh demand zone and can give a bullish reaction when price taps into it 🟢.
📌 Plan:
We will wait for price to tap the OB ✅
If we see bullish signs like rejection wicks or bullish candles, we will enter a buy 📈
Our target will be near 3366, just below the bearish FVG 🎯

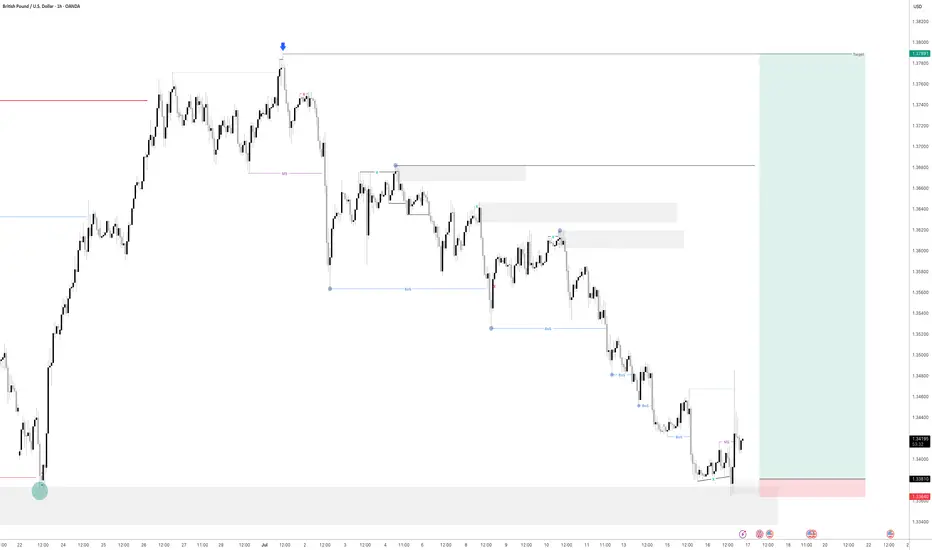
GBPUSD - Is it Ready? Looking at GBPUSD
We have had a Market shift to the upside from a HTF Point of Interest. I am now waiting for price to come back into a 15min demand area and hopefully price will take off to the upside from here.
We have also swept liquidity before a drastic move to the upside.
Lets see how this one plays out
Weekly Equities Trade Idea: CRCL Puts (Update)Hello Traders!
I'm providing an update to the CRCL trade idea from Monday July 14th. Here's what I'm watching:
- Price to open within the range from Tuesday July 15th
- Potential imbalance resolve from Monday July 14th at $204.70
- If price breaks Friday July 11th's high at $206.80 the trade is invalidated
Cheers,
DTD

USDJPY - Time to sell short term i believeHave a pending order waiting to be triggered on UJ
Will see how we go if we get tagged in

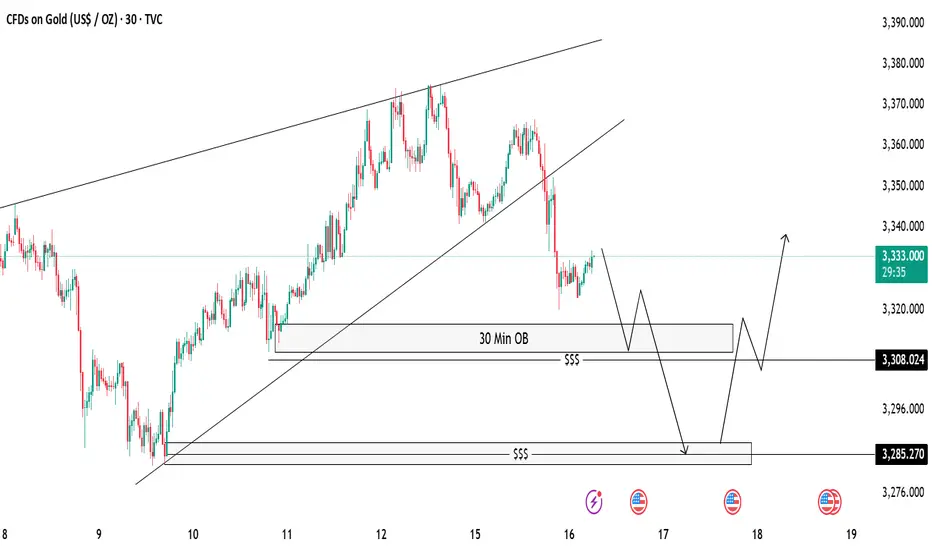
Gold 30-Min OB Analysis – Bounce or Drop..?Gold is showing a break of structure after a big sell-off 🔻. We have marked a 30-Minute Order Block (OB) 📍 which can act as a possible reaction zone.
📌 Two Scenarios We Are Watching:
✅ Scenario 1 (Bullish):
If price taps into the 30M OB and shows bullish rejection 🟢, we can look for buy opportunities, targeting the previous highs near 3335-3340 🎯.
❌ Scenario 2 (Bearish):
If price fails to hold the OB, we will watch for a liquidity sweep (marked with $$$) and expect price to move lower towards the next demand zone near 3285 📉.
⚠️ Key Notes:
Always wait for confirmation before entry.
Patience is the key 🧘♂️ — let the market come to us.
GBPUSD LONG FORECAST Q3 D15 W29 Y25GBPUSD LONG FORECAST Q3 D15 W29 Y25
Welcome back to the watchlist GBPUSD ! Let's go long ! Alignment across all time frames.
Professional Risk Managers👋
Welcome back to another FRGNT chart update📈
Diving into some Forex setups using predominantly higher time frame order blocks alongside confirmation breaks of structure.
Let’s see what price action is telling us today!
💡Here are some trade confluences📝
✅Daily order block
✅1H Order block
✅Intraday breaks of structure
✅4H Order block
📈 Risk Management Principles
🔑 Core Execution Rules
Max 1% risk per trade
Set alerts — let price come to your levels
Minimum 1:2 RR
Focus on process, not outcomes
🧠 Remember, the strategy works — you just need to let it play out.
🧠 FRGNT Insight of the Day
"The market rewards structure and patience — not emotion or urgency."
Execute like a robot. Manage risk like a pro. Let the chart do the talking.
🏁 Final Words from FRGNT
📌 GBPUSD is offering textbook alignment — structure, order flow, and confirmation all check out.
Let’s approach the trade with clarity, conviction, and risk-managed execution.
🔑 Remember, to participate in trading comes always with a degree of risk, therefore as professional risk managers it remains vital that we stick to our risk management plan as well as our trading strategies.
📈The rest, we leave to the balance of probabilities.
💡Fail to plan. Plan to fail.
🏆It has always been that simple.
❤️Good luck with your trading journey, I shall see you at the very top.
🎯Trade consistent, FRGNT X

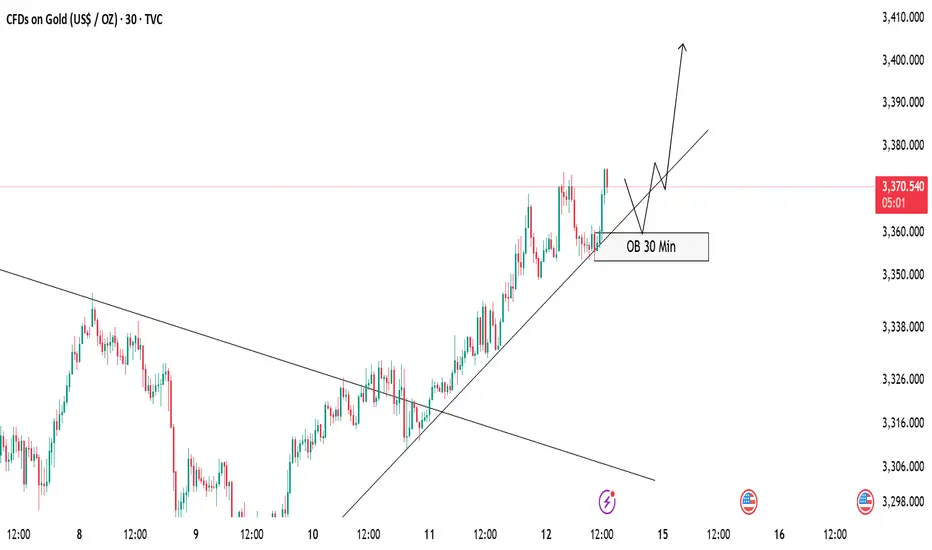
GOLD Buy Setup – OB Zone in FocusCurrently, gold is respecting the ascending trendline and maintaining a bullish structure 🟢. Price hasn’t tapped into the 30 Min Order Block (OB) yet, but we are expecting a potential pullback into this OB zone 📍.
✅ Our Plan:
We will wait patiently for price to mitigate the OB.
After the tap, we will look for bullish confirmation (rejection wick, bullish engulfing, or break of minor structure) before entering a buy position 🚀.
As long as the trendline holds, we remain bullish on gold.
📝 Invalidation:
If price breaks and closes below the trendline and OB zone, we will stay out or re-evaluate the setup ❌.
Stay disciplined and follow the plan! 💪
Short-term Bear Case for CRCLHello Traders!
As part of my weekly equity trade analysis, I will be uploading my recordings of what I am seeing and intending to trade for the week. A quick summary of what's in the video is as follows:
- CRCL is a high beta stock that seems to not be moving in tandem with its peers as of late
- I am expecting volatility due to market data and monthly options expiration
- CRCL has formed a new bearish order block below another bearish order block and is wedged with a weekly bearish setup. We are anticipating expansion out of this range to the downside
- I am waiting for a re-test of $199-$205 for a full move to $155-$145
Cheers,
DTD

GBPUSD - Also continued downside continuationLooking at GU. This is a little bit ahead of its time in comparison to EU.
And what i mean by that is EU is a lot further away from its 4H demand zone compared to GBP so it will be super interesting to see how we react at the level we are fast approaching on GU.
I am in a short position as of Friday. I will be posting a video tomorrow showing exactly how and why i got short on GU so stay tuned for that one.
As always if there is anything else i can be of assistance with give me a message and i will be happy to answer any questions you may have

EURUSD - Still Orderflow remains bearishLooking at EU. The 1H Orderflow is still maintaining that bearish intent. My area is set now for where i want to take a potential sell to the downside seeing as everything else is pretty much mitigated.
The only issue with this potential sell of is that we never really had a sweep of liquidity before we rolled over and moved to the downside.
We do have a level of inducement before our POI but i think in an ideal world i would love to see us build up a bit more liquidity before the POI just to induce the early sellers before making that move to the downside.
For now. On the lower TF's i will be looking to take short term long positions back up to our POI before looking for the longer terms short. to our 4H POI in which i will be looking to get long once again.
Any questions feel free to give me a message

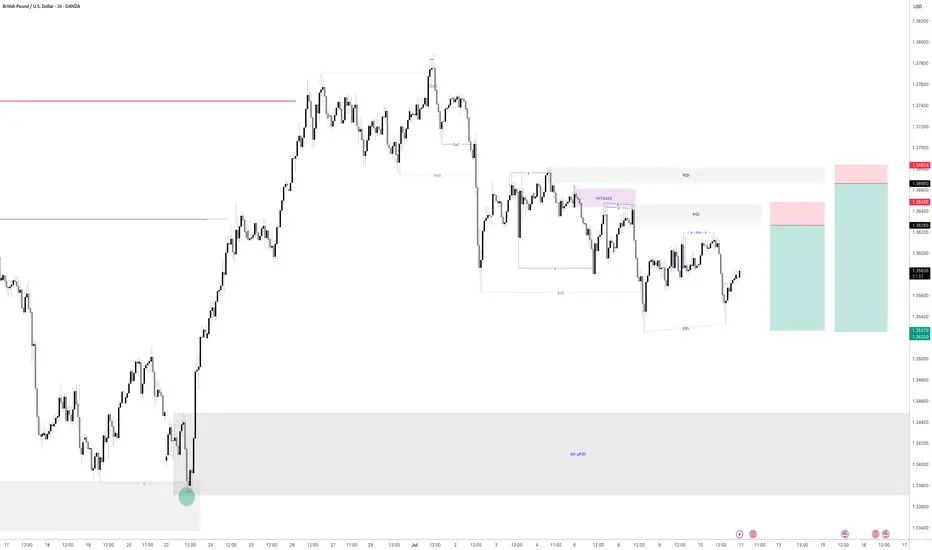
GBPUSD - 2 Selling opportunitiesLooking at GBPUSD
We have 2 opportunities to get short. Both have a build of liquidity before the areas of supply before them. This means we are looking for the early seller to get into the market before we get in so that all the early seller get stopped out.
As we can see the order flow on this is still bearish. So until the market shows me it want to go higher then we will remain bearish
Keep a close eye on this for tomorrow
Gold - Sell inboundGold is looking very promising for another sell off. we are already showing signs that price has intent to move lower with some lower timeframe break of structure.
Just waiting for a manipulation now of the most recent highs put in before price moves lower.
Let's see if we get an entry tonight.
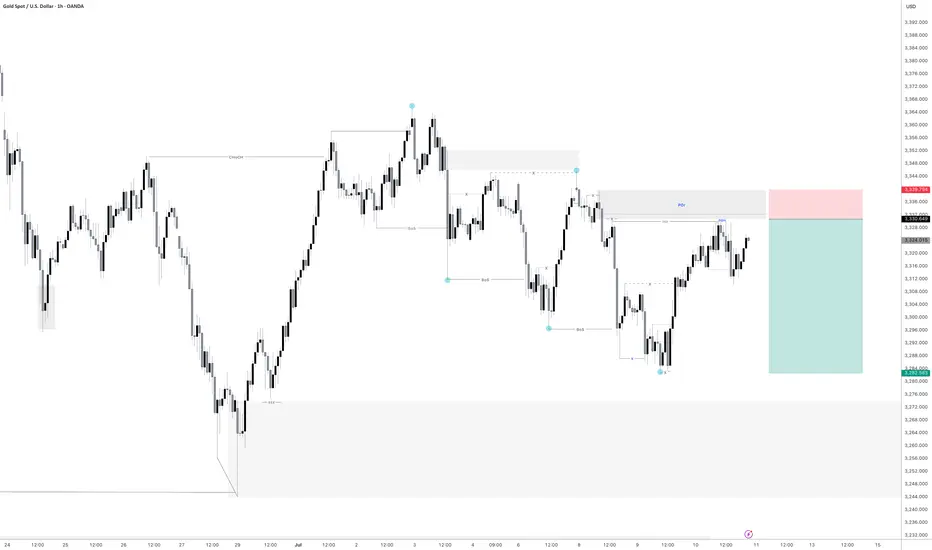

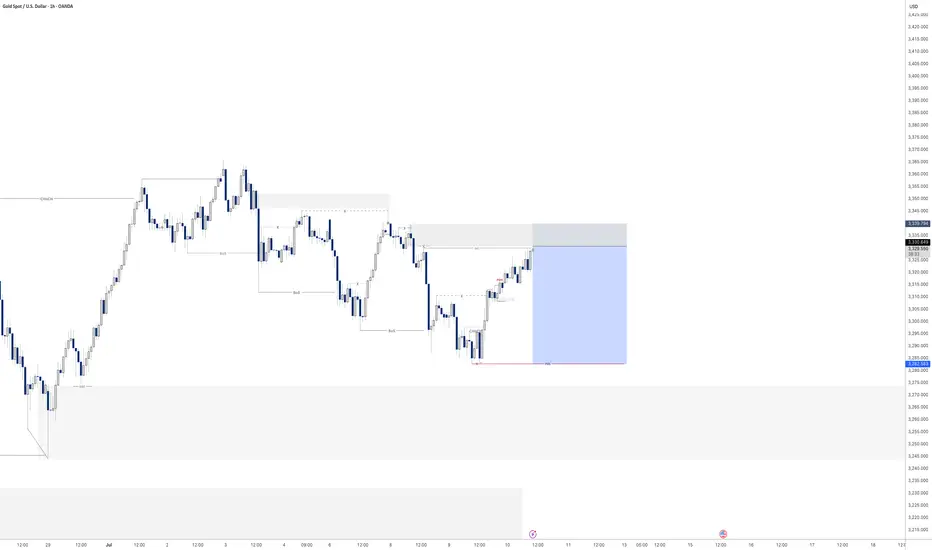
Gold - Sell before longer term buyLooking at gold we are a matter of a few pips away from entry. looking to play gold down till our larger 4H area of demand seeing as we have had a CHoCH to the upside.
There for i will be looking to take my sell position down to 3283.5 at a bare minimum as it was the previous structure level in which we turned around.
Lets see if we get tagged in. If not i will jump down to the lower TF and see if we can get a confirmation that price is going to turn from here.
GBPUSD - 2 potential selling opportunitiesLooking at GBPUSD
We have 2 potential selling POI's.
The first one being a point in which we will need to sit on our hands for a little bit to see what price does at there is no inducement in the push down in the impulse leg. With that being the case we will need to see some sort of inducement built before we enter that POI
IF we clear the first POI I think I will take a more aggressive entry on the secondary POI that sits a little bit higher. This is due to us having already put in some sort of liquidity in and around that POI before pushing lower.
Will wait and see what happens.
Tomorrow could be a very good trading day

Gold sell off before continuation higher? Pending order set on this one before bed
Will see what develops overnight

EURUSD - Potential sell at LDN or NY openLooking for sell from the POI highlighted
We have raided buy side liquidity so now its time to look at the origin of the move and see if we can further capitalise on a similar set up I took yesterday in order to bank a lovely 8.5% profit on this single trade.
Will post the trade below

XAUUSD Short term Long ideaGold is in bearish market structure currently for long term but we might have a very good chance taking long trades valid for this week only.
The 4H structure shows IFVG formed Monday which is a strong bullish signal to reach the liquidity above, Once we reach the liquidity I will be shifting my trades to bearish.