NAS100USD: Retracement to Target Sell Stops Below Support ZoneGreetings Traders,
In today’s analysis on NAS100USD, while the market is currently showing bullish momentum, there are clear signs that we may experience a retracement toward the downside. This move would likely target the discount sell stops below the illustrated support zone, providing an opportunity to align with institutional order flow.
KEY OBSERVATIONS:
Institutional Resistance Zone: A strong order block has formed, creating a significant resistance level that price may struggle to break through. This order block, coupled with the Fair Value Gap (FVG) beneath it, strengthens the bearish case. These two institutional resistance zones suggest a higher likelihood of a retracement.
Premium Price Zone: Price is currently trading in a premium range, a favorable area to monitor for potential selling opportunities upon confirmation.
Liquidity Target : Our primary target is the discount sell stops resting below an engineered support zone. This zone is a key draw on liquidity, where we anticipate significant institutional interest.
TRADING PLAN:
Entry Strategy : Wait for confirmation before entering short positions at the current premium price level.
Targets : Focus on the liquidity pools below the support zone, particularly the discount sell stops, as these represent the main draw on liquidity.
Patience and precision are crucial. By following institutional clues, we can effectively position ourselves for high-probability trades.
Happy Trading!
The Architect 🏛📊
Orderblocks

Crude Oil - Ichimoku Theories + Price Action ConceptsNYMEX:CL1!
Combining your Ichimoku strategy, with market structure orderblocks, could provide you with support & resistance levels, for your Ichimoku trend bias.
- Here is Crude Oil futures, on a 4H timeframe
- Analyze how the orderblocks, provide key level resistance, for your short positions

USDJPY → Fake Breakdown Gives Bulls a Chance!FX:USDJPY The price dips into support and creates a false breakdown below the lower boundary of the current trend. Meanwhile, the dollar is gaining strength, which could provide an opportunity for the currency pair to rise.
The price has paused near a strong support zone, as the fundamental backdrop has been increasingly unstable and heavily influenced by developments in the USA. Attention has shifted away from Japan's interest rate hikes, with market participants now closely monitoring economic data from the West.
From a technical perspective, the chart presents two potential triggers—one for buying and one for selling. However, given that both the global and local trends are upward, the bias leans toward buying. If the currency pair manages to sustain above the 151.9 - 151.95 level, short- to medium-term growth toward the targets marked on the chart is likely.
Resistance levels: 151.94, 153.7, 153.97
Support levels: 150.95, 149.52
That said, if the dollar's correction persists and buyers fail to capitalize on the false breakdown of support, a drop back to 150.95 could trigger a breakdown, potentially leading to a decline toward 148.64.

EUR/USD Bullish Outlook Following Bat Pattern CompletionThe EUR/USD 1-hour chart displays a completed Bat harmonic pattern, with price reversing near the 0.886 Fibonacci retracement level, suggesting a potential bullish move. Key trade levels include a support zone at 1.02911 and targets at 1.03394 (T1) and 1.03784 (T2).
Current consolidation above the pattern's completion point indicates potential continuation to the upside, with confirmation needed via a breakout above the highlighted zone. A stop-loss below 1.02911 is advised to manage risk. A break below this level would invalidate the bullish setup.

XAUUSD - SHORT - 08/02/25Post NFP price action swept the previous high and went lower.
This idea focuses on targeting Thursday's low and possibly lower to the FVG marked.
Entry on the 1HR FVG marked.

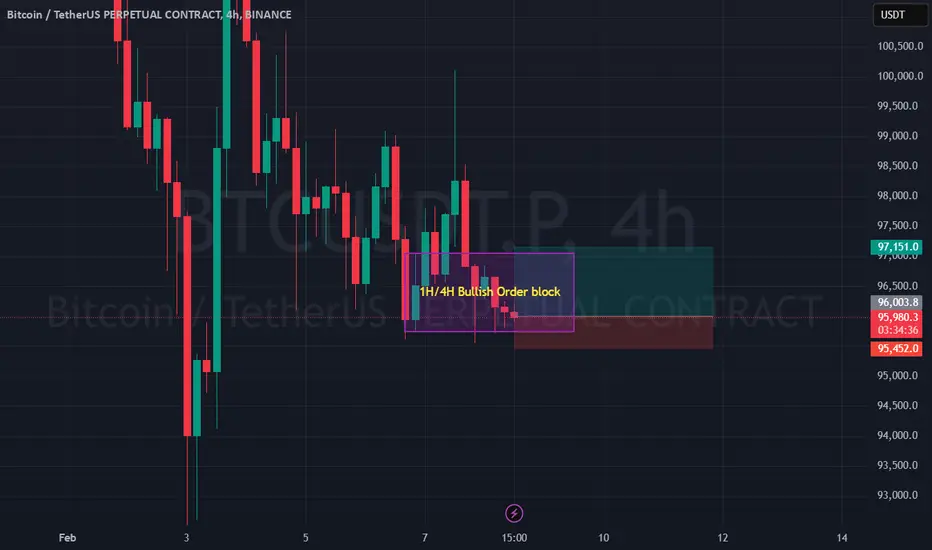
A small BTC longI entered a long position on BTC at 96,003.8, buying at the bottom of a 1H/4H order block. The confluence between these timeframes suggests strong bullish potential, as price often reacts positively when multiple timeframe order blocks align. My Take Profit (TP) is set at 97,151.0, while my Stop Loss (SL) is at 95,452.0.
Despite the bullish setup, I’m cautious because there’s a 4H Fair Value Gap (FVG) sitting right above my order block. This FVG could act as short-term resistance, limiting upward momentum. Given this, I’ve opted for a conservative TP to secure profits without overexposing myself to potential reversals.
BTC Fractal PredictionFacts:
The orange oval shows the part of the chart I used to create the forecast.
Yelllow green zones are demand FVGs and purple zones are supply. The green zone signifies the demand order block, and the zones are based on 9h TF.
Fibs are based on long term levels (not drawn from renko values).
*Note this is a Renko chart
Opinion:
If the prediction has any semblance to what will happen, it would be reasonable to suggest longs are accumulating down to maybe 88k without going too low where traders will then try to grab as much liquidity from 91-99k on the way up to sell after they push the price past ATH. A wick down to 88k, as low as even 84k could be expected here, and if the fear index continues dropping we might even see 80k being the target with a wick down to 76k. A bottom in the 70k range might result in an ATH target around 169k, while 141k would be what I think is the next top for a less extreme scenario, 123-125k being either the consolidation or retracement level for all cases. Next level after 141/169 would be the big 200k, where in most attempts at using this method of pattern prediction has shown it would very quickly retrace from.
As time passes, confidence in the 73k level as final support is increasing quickly as VWAPS, ATR based supports and moving averages continue to meet and surpass that price level on longer and longer timeframes and lengths. It might require very specific circumstances along with a very coordinated selloff to cause the price to drop below 73. How the market reacts once we break our 91k support will be interesting to see as there are more new investors and crytpo derivatives this season than ever.

OLECTRA at tilted supportThe stock is currently trading near tilted support at 1250.
If it breaks the recent low of 1240, the target on the sell side is likely to be 1050.
It looks bullish only if it moves above 1700 or breaks out of the trendline based on the present available data.
For a successful breakout/breakdown, we should ideally see a strong respective timeframe candle on our chart to close —it’s crucial to use that timeframe.
Following the breakout/breakdown, the ideal entry point would be after a consecutive candle that breaks above/below the breakout/breakdown candle
As always, remember to do your own research before making any investment decisions!

NAS100USD: Bearish Continuation Likely After Gap FillGreetings Traders,
In today’s analysis on NAS100USD, we observe that the market remains bearish overall, and our focus is on taking advantage of selling opportunities in line with this prevailing trend.
Market Context:
Gap Fill Complete:
The week began with a significant downside gap, creating a price inefficiency. The market has since retraced upward to fill this gap, signaling a potential continuation of the bearish trend.
Premium Price Zone:
Price is currently in a premium range, where smart money institutions are likely to initiate sell positions. We’ve taken out premium liquidity resting above an engineered resistance zone—a classic setup where smart money manipulates retail traders into entering positions, only to reverse the market and pair sell orders against their stop losses and pending orders.
Bearish Order Block:
Price is currently reacting at a bearish order block, a key institutional resistance zone. This provides a strong area to seek confirmation entries for short positions.
Trading Plan:
Entry Strategy : Look for confirmation within the bearish order block for short opportunities.
Targets: Focus on discount liquidity pools at the lows, where institutions are likely to scale out and book profits.
For a detailed explanation of my strategy, check out the first video of my 2025 ICT Mentorship lectures linked below:
Foundations of Mastery: 2025 Mentorship Begins!
Kind Regards,
The Architect

BTC - Just Thinking about Volume and Price relation As my other active posts recently have been about the downward trend and BTC finding liquidity before a trend reversal and the second strong upward momentum of this market cycle.
I surmised that the smart money wanted to test the bull market support moving average, 200ema on daily. ~84,500 - 82,500 .
A large Fair Value Gap (FVG) on the Weekly Chart was created from the rapid price increase due to speculators and other investors FOMO'ing in on the rising assset.
Large orders were left unfilled due to areas of support and resistance, trend and moving averages which are usually oscillated through during price movement while market trend leads the direction, speculators drive price increases and smart money attempts to drive price down to areas where they can profit, selling into the momentum during speculator price drives.
I'm just thinking out loud here and really I only post these little updates while im interested in something and like to document it. I could be all wrong with how I am seeing this and perhaps if anyone ever does read this and can share some insight into price/volume relationships with the smart money institutional investors and whales I would be interested to heart their thoughts.
However to continue , I see a discrepancy , Large Selling Volume, Negative Delta and it appears that there are some blocks where Sell volume cuts upward momentum abruptly and consistently
The Chart should Show the areas that I am referring , I would be interested to hear what others think

USDCHF Break and Retest of the Failed SwingHello All!
Been waiting patiently on the reversal with this pair. I liked the break and retest of the failed swing line, CHOCH on the 4HR, break of consolidation with a retest to that CHOCH area. With that, it was able to set up nicely giving an entry at 0.90900. My first target is around 0.91300, then possible 0.91500.

NAS100USD: Transitioning from Sell-Side to Buy-Side CurveGreetings Traders,
In today’s analysis, NAS100USD has been delivering bearish institutional order flow, characteristic of the sell-side curve. However, bullish institutional order flow is beginning to emerge, indicating a potential shift to the buy-side curve. This creates an opportunity to explore buy setups, provided confluences align with confirmation.
Key Observations:
1. Bullish Order Block as Support:
Price is currently reacting to a bullish order block, which is aligned with a Fair Value Gap (FVG). This confluence establishes a strong institutional support zone.
2. Reclaimed Order Block:
A previously reclaimed order block has been broken to the upside, suggesting that it may now act as support, reinforcing bullish momentum.
3. Discount Pricing:
Price is currently within a discount zone, making it an attractive area to seek buy opportunities with targets at premium liquidity pools.
Trading Plan:
Entry Strategy:
Look for confirmations around the bullish order block and reclaimed order block to justify entering long positions.
Targets:
Aim for liquidity pools at premium levels, such as highs, where institutions are likely to offload positions.
By aligning with the emerging bullish narrative and observing institutional behavior, we can position ourselves to capitalize on this potential market shift. As always, patience and confirmation are key.
Kind Regards,
The Architect

NAS100USD: Analyzing Bullish Institutional Order FlowGreetings Traders,
In today’s analysis of NAS100USD, we observe the continuation of bullish institutional order flow, presenting potential opportunities to align with this trend. The focus is on identifying evidence that supports taking bullish setups with proper confirmations.
Key Observations:
1. Institutional Support Zone:
Price is currently resting at a bullish order block, a strong institutional support zone.
This order block is reinforced by an FVG (Fair Value Gap) positioned above it, further solidifying its significance.
2. Liquidity Dynamics:
Sell stops resting below a recent low have been taken out, aligning with the order block.
This suggests institutional activity, as liquidity has been created for order pairing (buying against sell-side liquidity).
3. Price Positioning:
Despite being at a premium price relative to the intermediate high and low, there is no strong evidence to suggest a continuation into a discount zone.
The liquidity sweep below the low strengthens the case for a bullish reversal from the current level.
Trading Plan:
Entry Strategy:
Await confirmation at the current institutional support zone before taking buy setups.
Target Levels:
Focus on liquidity pools resting at the highs, as these are likely institutional profit-taking zones.
By aligning with institutional order flow and leveraging evidence of liquidity sweeps and strong support zones, we aim to capitalize on bullish momentum. Always remain vigilant and ensure confirmation before entering positions.
Kind Regards,
The Architect

BTC.D G.O.O.D BYEnothing new and the Dominance of Bitcoin Gonna fall
but that's fine bcz for now D is fall but price is rise = market Bull


CADJPY BUY Position BUY Position Triangle log size
EN: 109.610
TP1: 109.900
TP2: 110.70
SL: 109.369
The analysis is on a 15-minute time frame.
This is a personal opinion and you are responsible for your own profits and losses.

EURNZD signal: 4H / 1D Beautiful SellEURNZD ( 4H / 1D )
Market price : 1.84475
Sell now : 1.84475
Tp1 : 1.83687
Tp2 : 1.82485
Sl : 1.85480 ( 70 pip )
Traders, if you liked this idea or if you have your own opinion about it, write in the comments. I will be glad ❤️
Remember this is a position that was found by me and it is a personal idea not a financial advice, you are responsible for your loss and gain.

EURUSD DETAILED ANALYSISFollowing up on the guide that I posted on the weekly timeframe, internal price action on the 2H is bullish and we are currently at the OB which supports the first outcome.
Price could continue down without giving us a bearish choch which is a 50/50 trade IMO.
I would prefer to see a bearish choch first to increase its probability of holding.
If we break above the strong week high I will try to go long with the 2H internal aiming for short term targets until I see a bearish choch to target the weekly low.
The least probably but still possible outcome is for price to go above the December high if the 2H internal price action continues bullish.
We also have some very important news releases with Services PMI and NFP being the major ones so be sure to manage your risk this week like every week.

EURUSD DETAILED ANALYSISFollowing up on the guide that I posted on the weekly timeframe, internal price action on the 2H is bullish and we are currently at the OB which supports the first outcome.
Price could continue down without giving us a bearish choch which is a 50/50 trade IMO.
I would prefer to see a bearish choch first to increase its probability of holding.
If we break above the strong week high I will try to go long with the 2H internal aiming for short term targets until I see a bearish choch to target the weekly low. There are several areas where we could see a choch but keep in mind they could just give a reaction (no choch) to then just continue going higher.
The least probably but still possible outcome is for price to go above the December high if the 2H internal price action continues bullish.
We also have some very important news releases with Services PMI and NFP being the major ones so be sure to manage your risk this week like every week.

premier explosives order block detectedorder block is as marked on the chart
follow as per plan & it looks high risky

SPY to $650 in January?SPY recently retraced to the bottom of our Magic Linear Regression Channel with a large 3%+ move. Today, there was a nice bounce bounce from the channel bottom, back up to yesterday's open. So, what's next for SPY. The Magic Linear Regression Channel shows upside potential to it's baseline back at its recent all-time highs, and the potential for a higher move to the $630-$650 range. However, there is also the potential for it to fall back through the channel. Since we've been in a bull market for awhile now, that channel break would have to happen more definitively in order for that to be a likely scenario.
We've recently introduced the Magic Candles PRO indicator, which shows high volume candles that have very little price movement. When paired with the Magic Linear Regression Channel on a 1 day chart, it tends to show reversals at key levels on the Magic Linear Regression Channel. However, because we had a large move down on Weds, Dec. 17th 2024, and a large move up on Friday, Dec. 20th 2024 and ended up at the open of Thurs., Dec. 18th 2024, we get a doji on the 2 day chart that shows a massive "volume hammer" signal not seen since 2019, 5 years ago.
This signals that we are on the verge of a large sustained move. Again, because we've been in a bull market, and there aren't any very strong signs that it is over, we suspect that the large sustained move will be to the upside, because of the signal. If the price breaks down out of the channel, then we'll be in for a nice downward ride. Until that happens, though, we're bullish as we approach the all-time high again, and all the way to the $630-$650 range.

Bullish XRP: Adaptive RSI & Block Support Fuel Upswing PotentialCOINBASE:XRPUSD is showing promising signs of a potential upswing, driven by a bullish flip in the Adaptive RSI on the 15-minute chart, reinforced by strong order block support above $2 and confluence from other technical indicators.
Technical Analysis:
Adaptive RSI (15-Minute): The Adaptive RSI has recently transitioned from bearish to bullish on the 15-minute chart, indicating increasing buying pressure and a potential shift in momentum. This adaptive version of the traditional RSI is designed to adjust to changing market conditions, making it a potentially more reliable indicator of momentum shifts.
ICT Killzones (Worldwide Markets): The ICT Killzones, analyzed on the worldwide market timeframe, suggest that XRPUSD may be approaching an area where volume could increase, potentially leading to a rapid move. This aligns with the bullish signal from the Adaptive RSI and adds to the potential for a quick surge in price. However, it's important to be aware that this also increases the risk of a sudden overbought condition.
Supertrend Signals (AI Aggregator): The Supertrend indicator, functioning as an AI aggregator, is currently bullish.
Smart Money Concepts (Order Blocks Above $2): A key factor supporting this bullish outlook is the presence of strong order block support above the $2 psychological level. This suggests that institutional buyers or "smart money" have been accumulating XRP in this area, creating a solid foundation for a potential upward move.
Trade Setup:
Entry: Enter a long position now that the Adaptive RSI has flipped bullish on the 10-minute chart.
Stop-Loss: Place a stop-loss order below the recent swing low or a key support level identified by your indicators on the 15-minute chart, and consider placing it below the identified order block support for added security.
Take-Profit: Identify potential take-profit targets based on previous resistance levels or areas of potential selling pressure indicated on the 15-minute timeframe. Be mindful of the potential for a quick overbought condition, and consider taking profits strategically as the price rises.
Disclaimer: This is for educational purposes only and is not financial advice. Trading involves risk, and you could lose money. Always do your own research and consult with a qualified financial advisor before making any investment decisions.

Week of Oct 24, 2022 - Price Action StudyDownload the Chart and Use the Groups of Drawings to Navigate the HTF Bias(Trend) and Context (PD Arrays), Narrative (Probable PD Array to be reached for next), Entries (1H/15m), and Risk (CBDR and levels in chart)
With the period starting mid-week Oct 24, 2022 - Thursday Journal
Define Weekly Range Profile with IPDA True Day Markers
Done - IPDA True Day Lines
Out of IPDA 60 Day Range, Price is in the bottom of a Discount range
Guess for Weekly Range Profile - Classic Tue Low of Week
Reason: Tues had a lower close, my hypothesis is that Price will make the high of the week aligned with the short term weekly high from Sep 12, 2022
Therefore if Price has not reached the target Premium PD Array by the London session, I aim to buy Orderblocks into the Sep 12 Weekly High before turning Bearish (FULL CONTEXT HYPOTHESIS)
On 1H Chart, you can frame the target areas you want to trade from
EOD Wednesday - End of NY PM Session ends the day on a higher high and the high of the week so far
Thu Asian Session - Consolidation above the 1H OB from Oct 26th
The 1H OB has been wicked twice in previous NY AM Session
Price has created EQ Candle lows across Wed NY PM Session and Asian Session
Thu London Session - Price moves aggressively into the 1H OB
I know now that I am going to drop down to the 15m timeframe to look to execute an entry
Huge Detail: WE ARE LOOKING FOR A LTF PD ARRAY TO FORM INSIDE THE 1H ORDERBLOCK TO VALIDATE ENTRY
London Session continues to move down into the 1H OB
Thu London Session EOD (5m/15m)
Shortly after 5am Close, 5m and 15m chart shows MSS and creates 15m OB
Looking for Entry on PD Array on 15m Timeframe (More Probable TF)
5m if refined entry
NY Session AM (5m/15m)
BIG NOTE: If News coming at 830a EST, move should happen after that - try to not Trade through 830a - that is GAMBLING, not Trading
Depending on news being present, entry as the following
Entry Price:
Top of OB - 1.157
OB 50% Threshold - 1.156
No High Impact News/Events post 830a EST: 15m candle down close inside of 15m OB
With High Impact News/Events post 830a EST: After 830a or whenever time the news is released (FOMC 2p EST)
Entry in Case Study if condition is present: 845am
Entry in Case Study if condition NOT present: 800am
May just wait for 830a since it’s closer to NY AM Session Open?
Important: What made this entry work?
Price never closed under OB low after entering 15m OB
Price showed 15m MSS (a 2 bar close under 15m OB is low proabability)
William %R Divergence: Price making Lower Lows dropping into 15m OB and Higher Highs on William %R
Exit Analysis:
Original Price Target:
Sept 12th Old Highs (4:1 RR) | Price: 1:174
Intermediate Target(s):
Asian Session Bearish OB (1:1 RR) | Price: 1.162 (50% threshold)
Result: Price failed to reach Original Price Target which makes sense as there did not seem to be high impact news present - with this we would aim for 1:1 or 2:1 moves using CBDR as reference for spread
Move ended up reaching 1:1 RR aligned with 1H Bearish OB BREAKEVEN
Thu IPDA Range Conclusion:
Asian Session created Thu High
NY Session AM Distribution leg created a lower high on 1H timeframe
IPDA True Day closed in Discount area of the Wed 1H OB
Midnight Price closed at EQ area of the Wed 1H OB
With the period starting mid-week Oct 24, 2022 - Friday Journal
Define Weekly Range Profile with IPDA True Day Markers
Done - IPDA True Day Lines
Guess for Weekly Range Profile - Classic Tue Low of Week
Reason: Wed had a higher close and made the High of the Week around 1AM Thu before selling off and creating a lower high, my hypothesis is that Price will finish the week with a choppy day or lower close than Thu
Therefore if Price has not reached the target Premium PD Array by the London session, I aim to buy Orderblocks into the Sep 12 Weekly High before turning Bearish (FULL CONTEXT HYPOTHESIS)
On 1H Chart, you can frame the target areas you want to trade from
EOD Thursday - End of NY PM Session ends with price
Idenfied Wed FVG under the 1H OB that was mitigated Thu
Marked 50% level of FVG
Thu Asian Session
Short Rally after closing below Thu NY Close then selling off later into day
I know now that I am going to drop down to the 15m timeframe to look to execute an entry
Fri London Session - Price moves aggressively down into the 1H FVG
Huge Detail: WE ARE LOOKING FOR A LTF PD ARRAY TO FORM INSIDE THE 1H ORDERBLOCK TO VALIDATE ENTRY
Price creates a 15m Breaker Block and 15m Bullish OB in London
Fri London Session EOD (5m/15m)
Price trades back into Breaker Block at 5am
Entry Price: 1.152
NY Session AM (5m/15m)
Price Trades to Thu NY Session close before print Bearish hammer candle and close below Thu NY Session close
Intermediate Price Target
As price moves into NY Session, adjust 15m OB to last unmitigated candle before 830a EST
BIG NOTE: If News coming at 830a EST, move should happen after that - try to not Trade through 830a - that is GAMBLING, not Trading
Depending on news being present, entry as the following
Same with or without News:
FVG nested Breaker Block retest 845am | Entry Price: 1.152
Important: What made this entry work?
Breaker Block forming on 15m timeframe aligned with 15m OB inside of 1H FVG near EQ (Strong Probablity)
Exit Analysis:
Original Price Target:
Fri Asian Session Highs (2:1 RR) | Price: 1:159
Intermediate Target(s):
Thu NY Session Close (1:1 RR) | Price: 1.156
Result: 2 Trade Opportunities
London Session 530a - 730a, 1:1 (Entry/Exit/RR)
NY Session AM 845a - 1045a, 2:1 (Entry/Exit/RR)
If held through 4p EST close, 2.75:1 RR (2x CBDR from entry)
Fri IPDA Range Conclusion:
Friday closes Higher than NY Session Low
We do not count Sun price action independently
Confirmed Weekly Profile - Classic Tue Low of Week
Price seems to be close to discount than Premium range
Traded inside of Wed Oct 26th candle on Thu/Fri
