$BTC Daily OutlookDaily Chart
Today’s close printed a small bearish doji; visually bearish but still another inside-day that keeps BTC boxed between the High-Volume Node / v-Level cluster at $116 860-$123 300.
Holding $116 860 remains critical; lose it on a daily close and price can easily slide to the weekly breakout shelf near $111 960. We are now 16 days inside this balance. Per Auction-Market-Theory rule #5, the longer price churns at the edge, the more resting liquidity is absorbed, eventually a decisive push will follow. If buyers defend $116 860 again, the path opens toward range high $123 300 and the prior ATH; if they fail, expect a fast flush to the weekly V-Level.
Footprint Read
Value Area High and Low span the full candle, with the POC parked mid-range, classic two-sided trade. Delta finished negative and the heaviest prints sit at session lows: sellers hit the bid hard, yet could not follow through. That absorption leaves shorts vulnerable to a squeeze if new selling momentum doesn’t appear quickly.
Fundamental Pulse – Week Ahead
ETF Flows: Spot-Bitcoin ETFs booked three consecutive inflow days to close last week (+$180 M net). Sustained demand under the range supports the bullish case.
Macro Data: U.S. FOMC & Federal Fund Rates prints for this week; expect more volatility starting from tomorrow.
Game Plan
Primary bias stays long while daily candles close above $116 860; upside trigger is a clean for now or shorts squeeze toward $123 300.
If $116 860 breaks with volume, prepare for a quick liquidity hunt into the weekly shelf at $111 960, where we reassess for swing longs.
Intraday: I’ll monitor the Intraday Chart on tomorrow's High impact events and look for best opportunities across the board. Alt window: a fresh downtick in BTC Dominance could spark rotation; watch high-Open Interest majors if BTC ranges.
Orderflow

$BTC Daily OutlookBINANCE:BTCUSDT.P
Weekly Chart:
Bitcoin has now printed three consecutive weekly closes above the former higher-high threshold at $111 960. That series is enough to confirm a clean breakout of the prior HH-HL range and keeps the long-term bias pointed firmly higher.
That said, a near-term pullback is still on the table:
• First support — the breakout shelf at $111 960 (re-test of structure).
• Deeper support — the next V-level around $98 115.
Why the caution?
Last week’s candle left a small Failed Auction just above the new high, and Footprint data shows a cluster of aggressive buy-delta trapped in that wick. Those buyers may need to get washed out before the trend resumes.
Big picture: weekly structure is bullish; any dip into the levels above is a potential reload zone while the breakout holds.
Daily Chart:
Price action remains firmly bullish: multiple Failed-Auction rejections at the $116 860 higher-low vLevel keeps supply thin and reinforce the up-trend toward the prior ATH.
That said, remember Auction Market Theory rule #5: “When time or volume builds at the edge of balance, price often pushes through.”
• Each failed auction is absorbing resting bids.
• If sellers lean in again with size, the level can flip from support to resistance very quickly.
In practice that means:
•Base case – continuation to the highs while the Daily structure holds.
•Risk scenario – a clean break of $116 860 would open room for a deeper weekly pullback toward $107456.0
For now we treat the current weekly pullback as a fresh opportunity: scouting intraday longs as price reacts to the 1-Hourly zone.
From the footprint read-out, today’s bar finished with a neutral delta, but note where the profile is stacked: both the Value Area Low and the POC sit right at the bottom of the candle. That tells us the bulk of volume printed down at the session lows and it skewed negative, sellers were leaning hard, trying to extend the move lower.

EURUSD - Next Buy Zone? This one has some nice potential
We will see how it plays out if we get tagged in

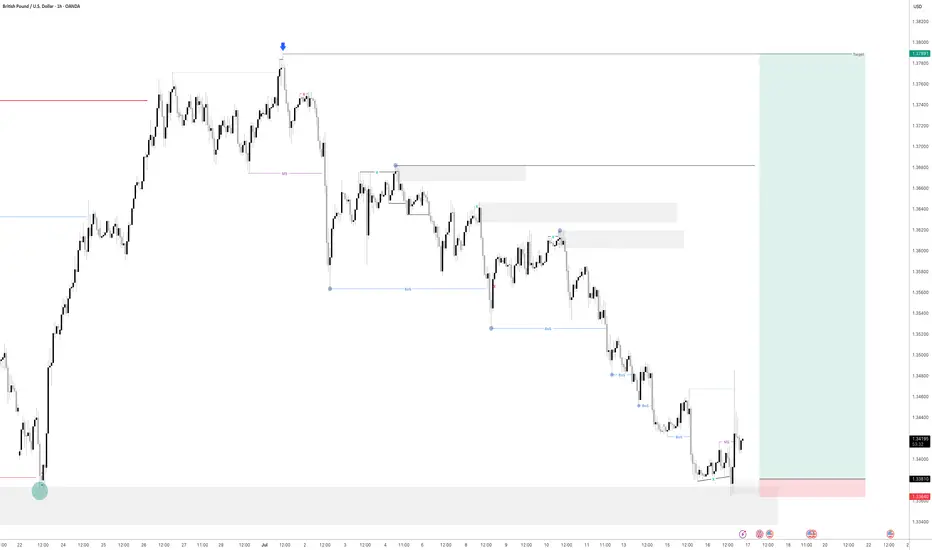
GBPUSD - Next buy from demandLooking here for potential further buying momentum to the upside.
Will see how this plays out tomorrow

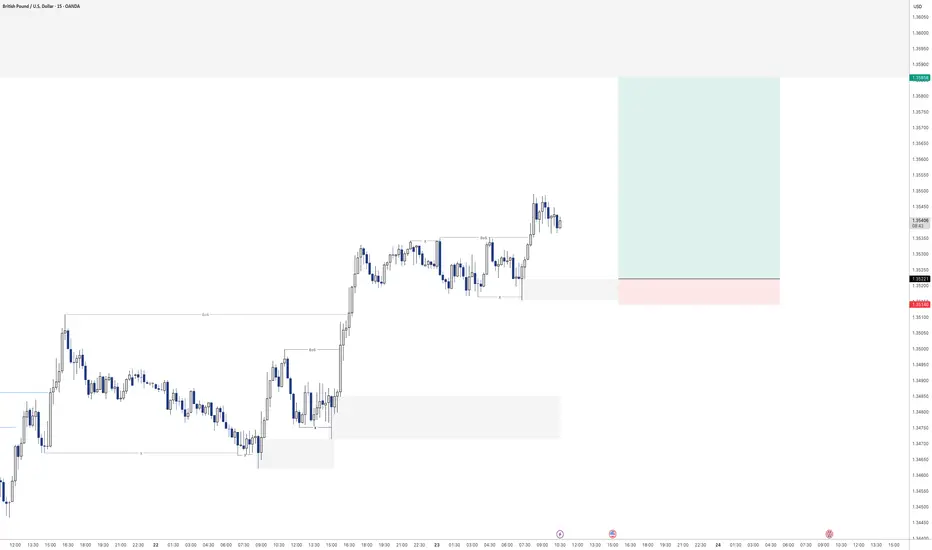
GBPUSD - Buying continuationLooking to keep buying the bullish orderflow on the 15min.
Had a nice sweep of liquidity before creating a new high. Will see how this one plays out over the day
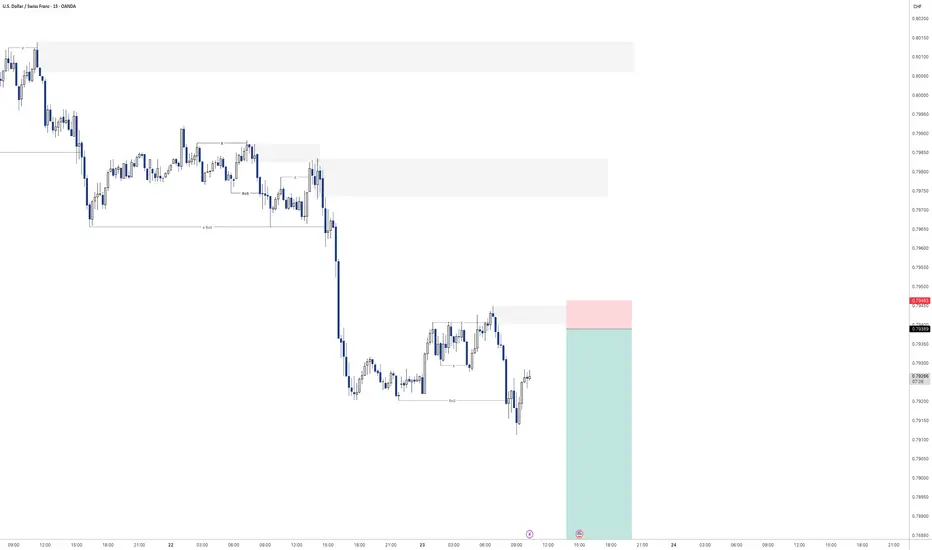
USDCHF - Sell off continuation?Looking for continuation of the selling pressure here on USDCHF
Will see how we play out for the rest of the day
$BTC Macro UpdateBitcoin Macro Outlook BINANCE:BTCUSDT.P
Weekly
Bias & momentum remain bullish. Price is pressing toward new ATHs despite last week’s pullback.
Next macro target: ~$133,550 (extension of the current DeCode V-Range: 111,959.5 – 77,111.0).
A weekly close back inside that range (<111,968.0) = Failed Auction → serious red flag for reversal.
Daily
Clean rejection off the 21-Day Rolling VWAP + bounce at the structural HL V-Level (116,862.4).
A strong bullish engulfing today would set the tone for follow-through this week.
10-Hour
Structure is still bullish. Multiple Failed Auctions from ~116,960.0 are driving price toward the ATH.
Intraday
Choppy and hugging range lows → harder read. That behavior near balance edges triggers AMT Rule #5: “If time/volume builds at the edge of balance, price is likely to push through.”
Auction Market Theory – Quick Reminders
Price : advertises opportunity
Time : regulates opportunity
Volume : tells you if the auction is succeeding or failing
Rule #5 (above) is in play right now. Stay patient, wait for confirmation, and don’t FOMO.


AUDJPY - POTENTIAL?USDJPY is getting super interesting.
If we can get some bearish intent to try and induce the early sellers to the downside creating some buyside liquidity then i will be all over this for a trade.
Lets see how price has moved by the morning as it does need a bit more development before we can consider entering for a short position

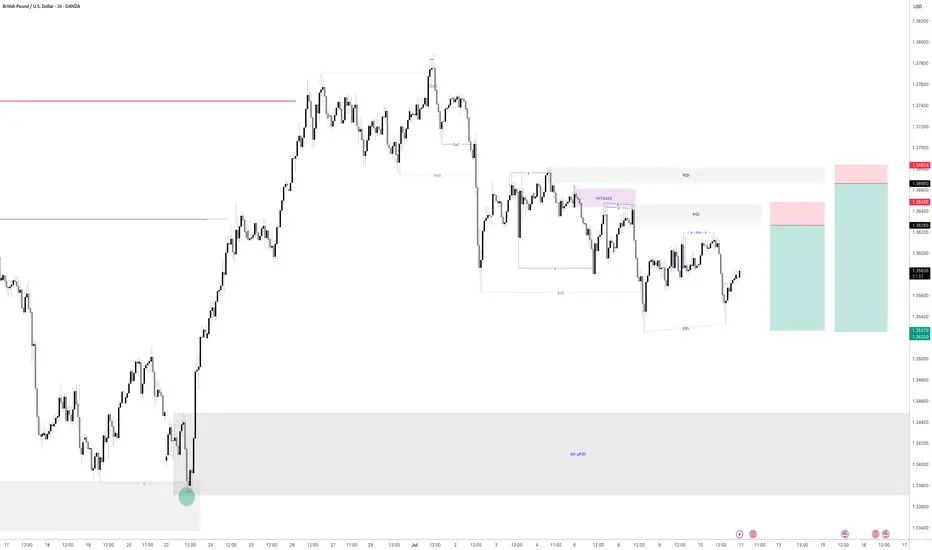
GBPUSD - Is it Ready? Looking at GBPUSD
We have had a Market shift to the upside from a HTF Point of Interest. I am now waiting for price to come back into a 15min demand area and hopefully price will take off to the upside from here.
We have also swept liquidity before a drastic move to the upside.
Lets see how this one plays out
USDJPY - Time to sell short term i believeHave a pending order waiting to be triggered on UJ
Will see how we go if we get tagged in

GBPUSD - Also continued downside continuationLooking at GU. This is a little bit ahead of its time in comparison to EU.
And what i mean by that is EU is a lot further away from its 4H demand zone compared to GBP so it will be super interesting to see how we react at the level we are fast approaching on GU.
I am in a short position as of Friday. I will be posting a video tomorrow showing exactly how and why i got short on GU so stay tuned for that one.
As always if there is anything else i can be of assistance with give me a message and i will be happy to answer any questions you may have

EURUSD - Still Orderflow remains bearishLooking at EU. The 1H Orderflow is still maintaining that bearish intent. My area is set now for where i want to take a potential sell to the downside seeing as everything else is pretty much mitigated.
The only issue with this potential sell of is that we never really had a sweep of liquidity before we rolled over and moved to the downside.
We do have a level of inducement before our POI but i think in an ideal world i would love to see us build up a bit more liquidity before the POI just to induce the early sellers before making that move to the downside.
For now. On the lower TF's i will be looking to take short term long positions back up to our POI before looking for the longer terms short. to our 4H POI in which i will be looking to get long once again.
Any questions feel free to give me a message

CL1! Short Setup – Fading Into Volume Shelf📉 CL1! Short Setup – Fading Into Volume Shelf
🔹 Context:
Price just tapped into a heavy upper volume shelf (68.35–68.50) — the exact area where the prior breakdown started. This zone aligns with rejection highs and the upper edge of the VRVP profile.
📌 Setup Logic:
🔺 Entry: 68.36–68.50 (into supply zone)
⛔ Stop: 68.75 (above liquidity peak)
🎯 Target: 66.78 (prior demand + volume node)
📐 RRR: ~4.0:1
⚠️ Trigger: Do not enter early — wait for rollover of price which it looks like we are getting now.
📊 Why It Matters:
📈 VRVP shows clear upper and lower volume shelves
📛 Price has overextended into a prior rejection zone
🔁 Potential for a mean-reversion leg once we confirm momentum breakdown
📷 See attached chart for full zone layout
🧠 Let me know if you’re entering or watching this one 👇
#CrudeOil #CL1 #FuturesTrading #VolumeProfile #SciQua #OrderFlow

GBPUSD - 2 Selling opportunitiesLooking at GBPUSD
We have 2 opportunities to get short. Both have a build of liquidity before the areas of supply before them. This means we are looking for the early seller to get into the market before we get in so that all the early seller get stopped out.
As we can see the order flow on this is still bearish. So until the market shows me it want to go higher then we will remain bearish
Keep a close eye on this for tomorrow
Gold - Sell inboundGold is looking very promising for another sell off. we are already showing signs that price has intent to move lower with some lower timeframe break of structure.
Just waiting for a manipulation now of the most recent highs put in before price moves lower.
Let's see if we get an entry tonight.
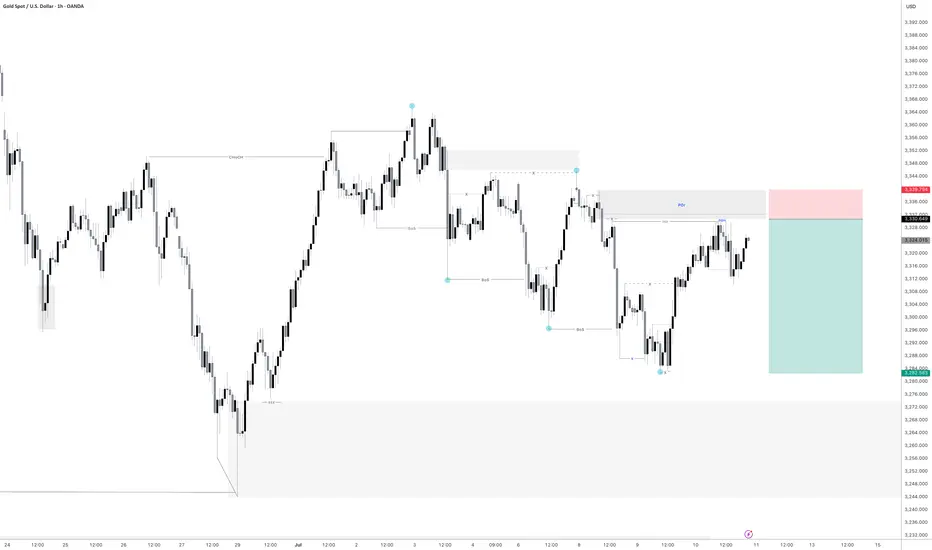

Gold - Sell before longer term buyLooking at gold we are a matter of a few pips away from entry. looking to play gold down till our larger 4H area of demand seeing as we have had a CHoCH to the upside.
There for i will be looking to take my sell position down to 3283.5 at a bare minimum as it was the previous structure level in which we turned around.
Lets see if we get tagged in. If not i will jump down to the lower TF and see if we can get a confirmation that price is going to turn from here.
GBPUSD - 2 potential selling opportunitiesLooking at GBPUSD
We have 2 potential selling POI's.
The first one being a point in which we will need to sit on our hands for a little bit to see what price does at there is no inducement in the push down in the impulse leg. With that being the case we will need to see some sort of inducement built before we enter that POI
IF we clear the first POI I think I will take a more aggressive entry on the secondary POI that sits a little bit higher. This is due to us having already put in some sort of liquidity in and around that POI before pushing lower.
Will wait and see what happens.
Tomorrow could be a very good trading day

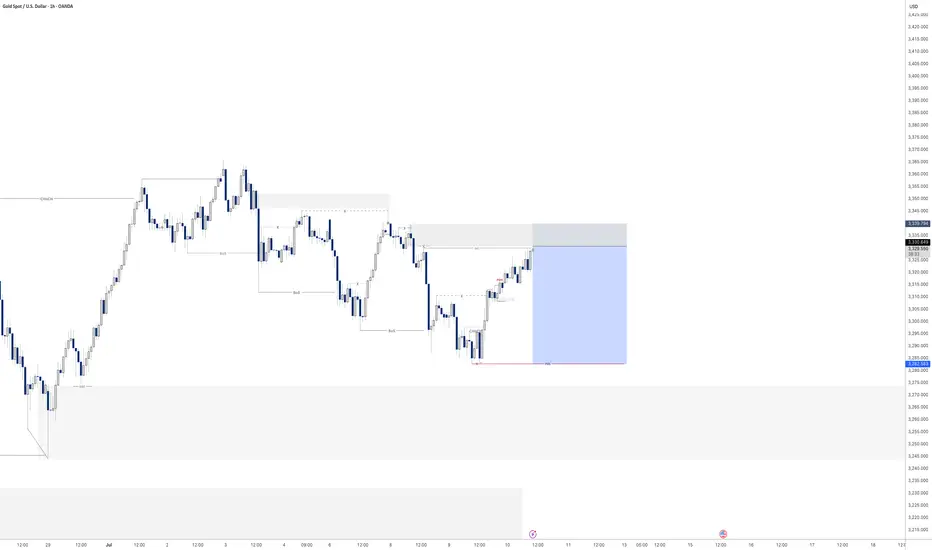
Gold sell off before continuation higher? Pending order set on this one before bed
Will see what develops overnight

EURUSD - Potential sell at LDN or NY openLooking for sell from the POI highlighted
We have raided buy side liquidity so now its time to look at the origin of the move and see if we can further capitalise on a similar set up I took yesterday in order to bank a lovely 8.5% profit on this single trade.
Will post the trade below

USDCHF - Potential downside incominglooking at UCHF we have just swept a level of liquidity.
We have had a Change of Character on the 15min to the downside and left a nice inducement / liquidity level alongside a nice FVG that has left a nice bearish orderblock
Once the spreads calm down I will set my pending order on this level and hope to be tagged into this position.
Due to the time it will be a reduced risk entry as I won't be able to manage the trade during the night.

GOLD - POTENTIALLooking at gold. Its still in a bit of limbo after the NFP reaction on Friday. However it is looking like the draw on liquidity is higher. Therefore my bias on gold for the start of the week is bullish so will be looking to get the most optimal entry to take some buys to the upside.
If we can manage to find a decent enough move price really could rally upwards.
