AUDCAD SHORTS COOKING UPHello friends, its a beautiful Tuesday morning and AUDCAD is cooking up something nice for us.. First the daily timeframe, Order flow is bearish, price has retraced into a Daily reversal zone marked with the red and blue fib. Price has taken liquidity at swing highs on the H4 and within the daily reversal zone price has printed a Weak hands pattern (1hr) increasing the probability of price dropping.. Isn't that what we all want as traders? to put probability on our side... So I have refined the Hourly Orderblock to the 15 minute and I will be looking for confirmations using the DM_FX entry model within that 15 min OB on the 1 min TF if price retraces into it... Our target is the Last Daily Low.
Orderflow

nas Bears perspective, hey guys quick idea, im bear this coming week with two scenarios . we just hit and reversed trend on the daily weekly orderblock. ill update yall as de week progresses.

Bitcoin (BTC) - Range Top Distribution - 22/7/2022 ideaBitcoin is currently struggled to push through todays' resistance at 22650 and puked down to around 22600 which signals heavy selling.
We can also observe some major breaks of bullish structures which adds very strong confluence and probability to this idea.

Bullishness from the marked zone InvalidatedIts important to have invalidation points for your trade ideas ... this will help you avoid FOMO and also enable you switch biases quickly and accurately. So far this week I have not entered any trades simply because I could not find any Good trades that meet all my rules... these rules have been tailored to put probability on my side ... isnt that what we want as traders? to put probability on our side? One good trade after one good trade.. regardless of the outcome , profit or loss, as long as all your rules were followed 100% it is a good trade.

GBP/AUD Long SignalI'm not an investment adviser, I will not be responsible for any loss you encounter. This is just an idea on my market analysis.

AUDJPY maintaining bullish structure Good day friends hope you're sticking to your plan and hope you're having a good week..
XJpy pairs sustained a downtrend majority of last week but coming into this week they have decided to resume the uptrending. With my style of analysis I'll be waiting patiently at the 4hr zone marked with a Red and blue fib (a demand zone) to see if I'll find an opportunity to join in on the uptrend... Overall I'm bullish on XJpy pairs until it ruptures bullish order flow and breaks structure downwards... *Not financial advice.

nas bulls perspective(still running)hey guys, been two weeks now and nas has been trickling up slowly, we almost at first target which is the weekly orderblock. if it happens that we break it we should definitely reach for higher prices. however if we see market structure shift to the downside when we reach the orderblock then we look to take nas further down. so its still looking good though, ill update you guys once we reach the weekly orderblock, which should be by the end of this week.

Millionaire's ROWLet's just watch price follow the script!
I'll explain after the LONG Manifests.
NEVER Over Leverage.
Trust your Objective Trade Set Up.
Have Fun.
I'll break this play down in the next chart.

EURUSD - Expecting Bearish WeekLINKS RELATED TO THIS PAIR (OTHER TIMEFRAMES)
(Use these pictures as reference for the description below)
Monthly Perspective:
Weekly Perspective:
Daily Perspective:
H2 Perspective :
ANALYSIS:
Monthly:
(check the picture above)
Price is trading through a Bullish Candle whilst being in a strong downtrend. This proves that Sellers are in control as buyers don't have enough volume to sustain bullish prices. Therefore, this candle will likely hold as a structure if price closes below it in 17 days.
Also, previous Monthly candle's wick low is "Previous Month Low", meaning It's an excellent Liquidity level for price to run to this current month.
And these Equal Lows are amazing for price to run to.
So Liquidity-wise, we have a Previous Month Low + Equal Lows. Can't get any better than that :)
Weekly:
As you can see on the Weekly, we have a Strong Downtrend. We want to follow it. "The trend is your friend" lol.
All imbalances above have been rebalanced. We have no Buy-Side Liquidity at all.
Check the Weekly FVG that price has just tested. See the reaction. We completely filled it WITHOUT closing above the FVG. That tells us that the FVG is being respected, and usually, price moves away from it when this happens.
At the same time we have a 3-Bar Swing High. That's another great indication that the next weekly candle should be Bearish to take out the previous week's Low.
And if that happens - where will price be? At the equal Lows (which is the ultimate target for this analysis).
At the Equal Lows target, I'm expecting price to run to and through these levels to Liquidate the resting orders there.
Daily:
The horizontal on the left annotated with an "x", was a high. The high had liquidity. Price ran to and through that high taking liquidity (bearish indication), before running into the Bearish OB above.
Price tested and reacted beautifully from the Orderblock. This Orderblock should keep pushing price lower.
H2:
Beautiful Distribution happened in the reaction of the OB.
Also, we have a Market Maker Sell Model (marked up with the grey boxes) for another confluence for Shorts.
Additional confluence:
I'm Bullish on the USD (DXY). If the DXY goes up should EURUSD go down.
Summary:
As I expect the next Weekly candle to be Bearish, I will have a Bearish perspective for price this upcoming week. I will look for Shorts entries on Lower timeframes.
This is my view on EU. Do your own research before taking any trades.

BTC Precision Discount to PremiumBTC Intraweek price action while in HTF Consolidation. The precision that can be seen even in crypto is undeniable.

BTC 12/7/22 pre-CPI anticipationMarket is currently at key level, waiting for CPI data to release on wednesday

EU SHORTHello Ladies and Gents ;
Another day is rising another opportunity to perfom better than the day before, to be a better version of ourselves, let’s take it!

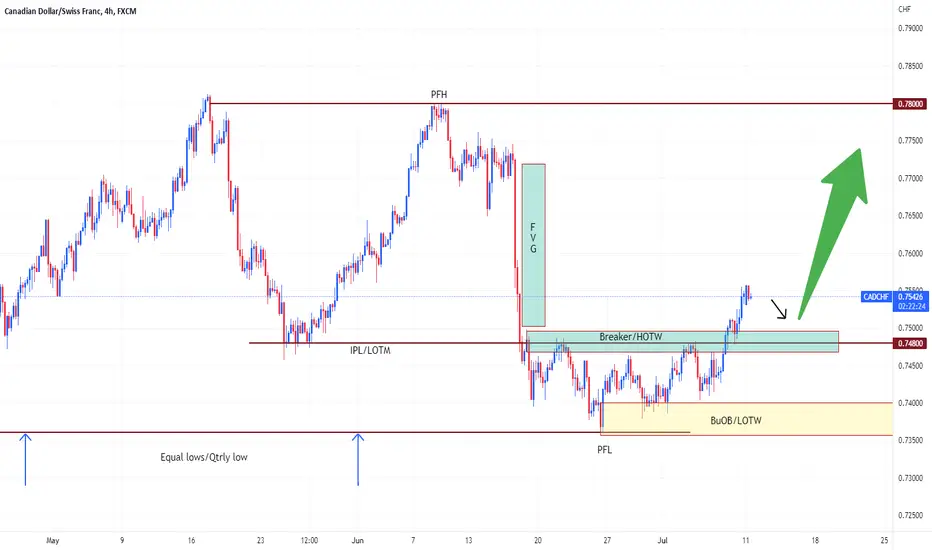
CADCHF bullish setup.Hello traders,
After the price made a quarterly low and created a Bullish Order block ( BuOB) the price rallied up to form a breaker to indicate a change in the order flow.
This week, catch the lowest price possible so that we can continue going long.
Wait for the price to come to the level around 0.75125.
Like and comment if you agree 💯
GBPCHF H4 - LONGPrices broke structure once more, looking for a pullback into demand, ensuring that it in at discounted range.

GJ SHORTHello Ladies and Gents ;
Another day is rising another opportunity to perfom better than the day before, to be a better version of ourselves, let’s take it!

EU SHORTHello Ladies and Gents;
Another day is rising another opportunity to perfom better than the day before, to be a better version of ourselves, let’s take it!

nas bulls perspectiveso yesterday i was looking to go bearish on nas based on the 1h timeframe support break. now on the 4h timeframe it looks like nas was just retesting the 4h orderblock. today as we see ,nas is on a bullish move currently and we would love to see a retracement so we can enter for more buys, however if price decides to shift structure on the 15min timeframe i will enter at this current level.(leave comment if you would like to know how i confirm structural shifts)

nasdaq intraday longs.So im riding the up wave on nasdaq guys. structure seems to have shifted on friday. now we continue, on fridays trade we are already on break even, and adding more trades as we go,(on private lessions). yesterdays trade is still neutral due to the impulsive move down , but it looks like we getting a new entry. the only time i will go bear again is if price breaks the red trend line and gives me a sweet retracement.

NZDUSD H4 - SHORTPrices broke structure, looking sell opportunities in the market. We have a POI at the extreme supply area.

BNB/USDT BINANCE COIN CHANGES CHARCTER TO THE BULL TRENDBNB is about to have some local pump agter taking sto loss of the last buyer and touch MM POI. entry on the lpwer timeframes

#analysis 21 - Key levels are still untouchedAfter a small dumping on Sunday, now the key levels are still untapped. Will wait for the price touching the areas of around 18.6k, or even 17.6k, and see how it goes.
If it left the lower lines untapped, I think it's going to consolidate at about 21.8k and get down.
Let's see.

$ES #ES_F Es1! S&P 500 futs levels to watch for week of 7/5-7/8Quick charting of levels to watch for spooz going into the short holiday week. Many bulls were created end of day Friday with a late trend day developing, but the close left me wanting and prevented me from scaling in to longs just yet.
What to watch: personal preference is for 3783 to get tested and hold, then reverse toward 3880/3900 and maybe even 3950 if bulls take charge. If we touch 3800 and volume floods in with aggressive buyers, then I will also scale into longs.
On the downside, if 3780 level goes, analysis leads me toward 3740 to retest PW lows. Scalpers should be able to catch 20-30 pts for a bounce here, but on a 3rd test we will likely see weakness back down to 3700/3660. The final result will be new YTD lows if bulls lose 3800 and don’t reclaim by weekly close.

EUR/USD Likely to fall!Hey tradomaniacs,
looking at EUR/USD I see a potential move down due to recent fakeouts with trapped buyers aswell as the absorption before (Market-depth).
AS long as risk-off continues we might see more dollar-strenght especially after that ridiculous statement by the ECB saying they dont see an upcomign recession as a likely scenario. (lul).
However, probably a good spot to short with a nice risk-reward-ratio.
Waht do you think?
