CADCHF... 16RR SHORT OPPORTUNITYHey traders,
Price hit monthly supply order block and has printed a massive weekly bearish engulfing candle which indicates momentum to the down side and a respect of the monthly supply order block. I am going short on this pair and I am anticipating that the daily equal lows will be taken out as liquidity sits there.
P.S: if you can not find it, just look at where my TP is and go on the daily timeframe to see it clearly.
Let me know what you think in the comments.
BR
David
Orderflow

GOLD to sink to $1780 after forming high of the week
Hopefully we get a move lower. Everything seems to be pointing south


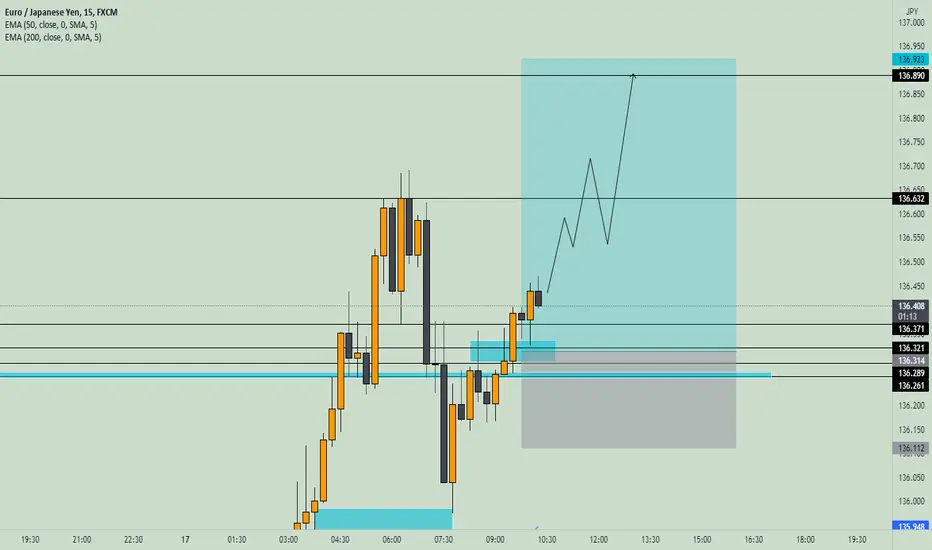
#EUR JPY# 1:3 RRR TRADE SETUPLooking for sell on EUR JPY possible continuation .. 136.320 to 136.890 target rejected with strong wick and closed above previous resistance. overall bullish momentum.
EURJPY Supply & DemandRead the chart then wait.
Read the chart then wait.
Read the chart then wait.
Read the chart then wait.
Read the chart then wait.

short term buy ,day trade. nas100meanwhile intraday we could see a nas retracement to 13486. before selling off. thats scenario 1. at that proce we will see if it breaks or reverses.
on the other hand if we see structural breaks to the downside then we continue selling. ,scenario 2.

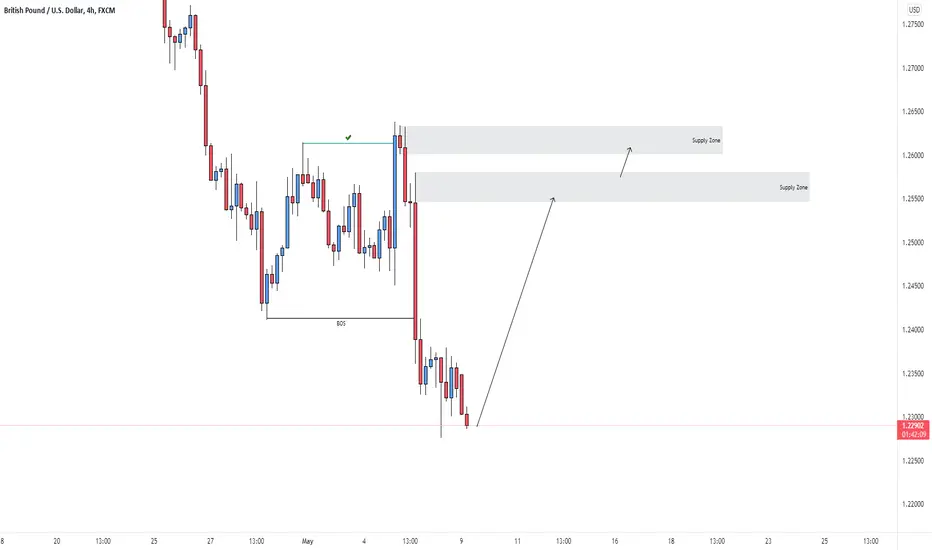
GBPUSD H4 - SHORTPrices swept liquidity, broke market structure to the downside and now, we are waiting for a pullback to the the supply areas to get involved in SELLS.
BTC - Sell Idea There is a Hidden Divergence in daily TF. It's strong. We should see a Big range day in this week.

BITCOIN BET MY SELL ENTRY ON FIRST TARGET Look on reaction of price cycle not on predictions, bitcoin almost to the first target,

EURNZD H4 - LONGPrices broke structure to the upside, we are looking for a pullback into the demand area then use the 15m BOS as our basis for entry. Otherwise, use your favourite entry technique for execution.

Sell AUDCHFOn the Daily timeframe, the peak formation high ( PFH ) is at the highs of both March and April. On the other hand, the peak formation low ( PFL ) is currently the low of the week whereas the PFH is the high of the week.
Narrowing down to the lower timeframe, yesterday the price created a breaker which is a clear indication of a change in order flow to bearish. The price will go lower to fill the liquidity void to more than 50%.
Like and Subscribe.

POTENTIAL SELL ON US30Price has potential to move lower from the retest of the minute 5 timeframe sell zone, wait for bearish price action to confirm the move.

Sell EURCADHello traders, Euro is still very weak as CAD seems to be gaining more strength in the past few weeks. I believe that the price has reached the high of the week both on Monday and Tuesday and it will not go higher than that.
The price is targeting the lower liquidities the first one being the previous low of the week.
Like and Subscribe

Sell the retracement on CADCHFHello traders,
On Friday CADCHF had a strong move to the upside and before the close of the week, there was a strong move to the downside. This move to the downside is an indication of the change in order flow from bullish to bearish. It was confirmed by the formation of a breaker block on the same day.
However, since I missed out on the opportunity to go short on Friday, today I still pull the trigger to go short. This is because the price is targeting the Bullish Order block below. Also, the price must move more than 50% between the peak formation low and the peak formation high.
Remember to apply proper risk management. Like and Subscribe


US30 POTENTIAL SHORTSPrice has a potential for the downside upon the retest of the sell zone.Wait for lower timeframe confirmation to confirm the move.

Is It Time To Buy EUR/USD? Yes Or No?
Hi Traders,
Happy Friday!
Today we are looking at a possible 4-Hour Order Block entry on EUR/USD
We have seen nothing but bearish price action for the past month on most FX pairs.
The DXY has been going parabolic
EUR/USD is currently sitting on support that hasn’t been seen since 2016.
Is this a good time to buy?
I only enter positions that match my setup and this could be a possible play.
Yes, it is a counter-trend which is not always advisable.
This is why I would only risk a very small position on this as I wouldn’t class this as an A grade Setup.
Hope you all have a fantastic weekend.
See you on the next one,
The Vortex Trader

XAUUSD GOLD - BUY TO SELLPrices broke structure to the upside, came back for a retest onto demand area. Look for ways to get involved in buys and sell at supply.

USDCAD - Bearish OrderflowThis is the USDCAD Monthly Chart.
USDCAD is testing a strong Bearish Breaker (the last down candle before an up-move for a raid on Buy-Side Liquidity).
While testing the Breaker, we are currently creating a Swing-High. It was forming Higher Highs, made a reversal point, and now making Lower Highs instead. This tells us that momentum was initially Bullish, but now that we are creating Lower Highs on the other side of the curve - we should see price mirror itself (aka do the exact same thing on the other side of the curve - meaning that momentum is shifting and it should go Lower).
There are relative Equal Lows residing below current price which I expect price to sweep through. A FVG is also resting right below these Equal Lows, so could expect the Lows to get swept down into the FVG.
Because USDCAD is testing such a strong Breaker, I expect an explosive move lower.
With this, I will be framing a huge Bearish Bias for USDCAD, for Lower-Timeframes trades. Knowing what the Higher Timeframes are doing is crucial to trading Lower Timeframes with highly probable setups...

EURUSD- Objective has been completed, remain patientLongs are still low probability, even from the extreme, the expectation is for the weak low to get taken, wait for more confirmation or look to continue to sell

AUDUSD- Follow the trend, look to SELLShorts from supplies make sense are are the HP trade idea, follow the money, the first supply zone could be used as inducement, however it could also hold as it is in a premium, just be careful and ensure you have the right confirmations to trade from

SPX500 likely to MOVE UP!Hey tradomaniacs,
previous sell-offs due to the fact that the market realizes FED is not kidding with rate-hikes were pretty strong, but will probably correct soon as the sentiment is too bearish and has oversold the indicies such as SPX500 and NASDAQ100.
We will probably see a move up to attract more buyers in order to get more liquidity for the sellers.
So far the day has been a mess, buit the previous breakout did not cause another rally which is a strong indication for a reversal due to exthaustion by sellers at the bottom of the day.
Liquidity turned out to be pretty bullish as we head into the after-lunch-session and I could imagine to see a strong breakout here to the upside (short squeeze).
Let`s see what happens =)

USD Index DXY - Potential MMBM Monthly Timeframe: (check the linked image)
- The market traded aggressively away from a Bullish Orderblock.
- Last Month, DXY created a Bullish 3- Bar Fractal (swing low) which lead to an explosively bullish move. We can easily see the next monthly candle being bullish as well.
- We have now disrespected a very strong Bearish PD Array: A Bearish Breaker. It showed no willingness of respecting it, which means that buyers are in control.
- 3 months ago, we traded through a bearish candle. This bearish candle works as its own structural Orderblock, and we shouldn't see price drop below this level (like the two green boxes below). If it does- we might see a reversal lower.
Daily Timeframe:
- We have a potential ICT Market Maker Buy Model playing out.
- We are in a massive uptrend, and we can easily see a continuation of it.
- We are getting closer to the Weekly FVG's High.
- At 101.000 (institutional number), we have very clean Equal Highs. Price can easily draw up to this level, as a massive liquidity pool resides here. Expecting a manipulation through this level, potentially up to the Volume Imbalance.
- At 101.640, we also have a daily Volume Imbalance Vaccum Block. This is a huge gap in price which likes to get traded to, and filled. Sometimes you'll see a reversal at this level as well.
Caution:
- This is just my view on the USD. Price may not play out as expected. This can especially be due to the current war situation in Ukraine. Price can create Black Swan events and massive volatility that can ruin the setup on a Daily TF.
- From 97.720 to 98.000 we have a volume imbalance below current price. DXY can easily retrace lower to fill this level. If this happens- it can respect this volume imbalance and go higher from there, or create a lower retracement.
