CL Analysis – May 28, 2025Currently, I believe Crude Oil (CL) is trading within a well-defined range. My strategy is clear:
🔴 Sell only at the red supply zone above, but only after confirmed seller reactions backed by order flow.
🟢 Buy only at the green demand zone below, once buyer strength is confirmed through price action and order flow.
No trades in between — I’m staying patient and letting the market come to my levels.
Orderflow

What Is Stock Tape Reading, and How Do Traders Use It?What Is Stock Tape Reading, and How Do Traders Use It?
Tape reading is a real-time market analysis method used to track buying and selling pressure. Unlike technical indicators, which rely on historical data, tape reading focuses on executed trades, order flow, and liquidity shifts. Traders use it to assess momentum, identify institutional activity, and refine trade timing. This article explores how tape reading works, its role in modern markets, and how traders apply it to short-term decision-making.
The Origins and Evolution of Tape Reading
Tape reading began in the late 19th century when stock prices were transmitted via ticker tape machines, printing a continuous stream of price updates on paper strips. Traders would gather around these machines, scanning for large trades and unusual activity to anticipate market moves. One of the earliest and most well-known tape readers, Jesse Livermore, built his fortune by studying these price changes and spotting institutional buying and selling patterns.
By the mid-20th century, as markets became faster and more complex, ticker tape machines were replaced by electronic order books. Instead of scanning printed numbers, traders began using Level 2 market data and time & sales windows to track order flow in real time. This transition allowed for more precise liquidity analysis, making it easier to see how large orders impacted price movement.
The rise of algorithmic and high-frequency trading (HFT) in the 2000s further changed the landscape. Today, market depth tools, order flow software, and footprint charts have replaced traditional tape reading, but the core principle remains the same: analysing how buyers and sellers interact in real time. While charts and indicators offer historical insight, tape reading provides a direct window into current market behaviour, giving traders an edge in fast-moving conditions.
How to Read the Tape
Nowadays, tape reading is all about real-time market data—watching when and how orders are placed and filled to gauge momentum and liquidity. Unlike technical indicators, reflecting past price action, tape reading focuses on what’s happening right now. Stock, forex, and commodity traders use it to assess buying and selling pressure, spot large orders, and understand market sentiment as it unfolds. Here is the key information provided by tape reading:
Time & Sales
The time & sales window (the tape) displays every completed trade. Each entry shows time, price, trade size, and whether it hit the bid or ask.
- Trades at the ask suggest aggressive buying, as buyers are willing to pay the market price.
- Trades at the bid indicate selling pressure, as sellers accept lower prices.
- Large block trades often signal institutional activity—tracking these can reveal where big players are positioning.
Bid-Ask Activity
Nowadays, an order book is a part of tape reading. The order book (Level 2 or DOM) shows the number of buy and sell orders at different price levels. While not all orders get filled, traders watch for:
- Stacked bids (a high concentration of buy orders) near a price level, which may indicate strong buying interest.
- Stacked offers (large sell orders) acting as resistance.
- Orders rapidly appearing or disappearing, suggesting hidden liquidity or fake orders meant to mislead traders.
Volume and Trade Size
Changes in trade size and volume help traders judge the conviction behind a move:
- Consistent large trades in one direction can suggest institutions accumulating or distributing a position.
- A surge in small trades may indicate retail participation rather than institutional moves.
- A sudden drop in trade activity after a sharp move may hint at exhaustion or a potential reversal.
Trade Speed
The pace of executions matters.
- Fast, continuous transactions suggest urgency—buyers or sellers are aggressively taking liquidity.
- A slowdown in transactions near a key level can indicate hesitation or a shift in sentiment.
Tape Reading vs Technical & Fundamental Analysis
Tape reading differs from technical and fundamental analysis in both approach and timeframe. While technical traders study historical price patterns and fundamental analysts focus on company performance and economic data, tape readers focus on real-time order flow to assess market direction as it develops.
Technical Analysis
Technical traders rely on chart patterns, moving averages, and oscillators to identify trends and potential turning points. These tools are built on past price data, meaning they lag behind actual market activity. For example, a trader using a moving average crossover strategy waits for confirmation before acting, whereas a tape reader sees momentum shifting as it happens by watching the flow of orders.
Fundamental Analysis
Fundamental analysis is longer-term, based on financial statements, earnings reports, and macroeconomic indicators. Investors using this approach focus on factors like revenue growth, interest rates, and industry trends to decide whether a stock is undervalued or overvalued. Tape reading, by contrast, ignores these metrics entirely—it’s used by short-term traders reacting to immediate buying and selling pressure.
Where Tape Reading Fits In
Many traders combine approaches. A day trader might use technical analysis to find key price levels and then apply tape reading to fine-tune entries and exits. Similarly, a swing trader tracking earnings reports may use tape reading to see how large players are reacting. Each method provides different insights, but tape reading offers a unique advantage: it reveals market sentiment in real time, helping traders assess momentum before price movements become obvious.
Advantages and Disadvantages of Tape Reading
Tape reading gives traders an inside look at real-time market activity, but it also comes with challenges, especially in modern electronic markets.
Advantages
- Immediate Market Insight: Unlike lagging indicators, tape reading reflects live buying and selling pressure, helping traders react before price changes become obvious.
- Identifying Large Buyers & Sellers: Institutions often execute orders in patterns, leaving clues in the stock market tape. Recognising these can help traders gauge potential price direction.
- Fine-Tuning Entries & Exits: By tracking order flow near key price levels, traders can time their trades more precisely rather than relying on static chart signals.
- Useful in Fast-Moving Markets: Tape reading can be particularly valuable in scalping and day trading, where short-term momentum plays a key role.
Disadvantages
- Algorithmic Trading Distortion: High-frequency trading firms place and cancel orders rapidly, making it harder to interpret true supply and demand.
- Steep Learning Curve: Unlike technical analysis, which provides visual patterns, tape reading requires experience in spotting meaningful order flow changes.
- Mentally Demanding: Constantly watching the tape can be exhausting, requiring a high level of focus and quick decision-making.
- Less Effective in Low-Volume Markets: When liquidity is thin, tape reading becomes unreliable, as fewer trades mean less actionable data.
Modern Footprint Charts and Order Flow Software
While some stock tape readers rely on raw order flow data, many use footprint charts and order flow software to visualise buying and selling pressure more effectively.
Footprint charts display executed trades within each price bar, showing volume distribution, bid-ask imbalances, and point of control (POC)—the price level with the highest traded volume. This helps traders see where liquidity is concentrated and whether buyers or sellers are in control.
Order flow software offers heatmaps, cumulative delta, and volume profile tools. Heatmaps highlight resting liquidity in the order book, revealing where large players may be positioned. Cumulative delta tracks the difference between market buys and sells, helping traders assess momentum shifts.
These tools provide a more structured approach to tape reading, filtering out noise and making it easier to spot large orders, absorption, and potential reversals. While experience is still essential, modern software gives traders a clearer view of market behaviour beyond just raw time & sales data.
The Bottom Line
Reading the tape remains a valuable tool for traders looking to analyse real-time order flow and market liquidity. While there are numerous algorithms that place trades, understanding executed trades and bid-ask dynamics can provide an edge in fast-moving conditions.
FAQ
Is Tape Reading Still Useful in Trading?
Yes, but the application of tape reading in trading has changed. While traditional tape reading focuses on printed ticker tape, modern traders use time & sales data, Level 2 order books, and footprint charts to analyse order flow. High-frequency trading and algorithmic activity have made tape reading more complex, but it remains valuable for scalpers, day traders, and those tracking institutional activity.
What Are the Principles of Tape Reading?
Tape trading is based on real-time order flow analysis. Traders focus on executed trades (time & sales), bid-ask activity (order book), volume shifts, and trade speed to gauge buying and selling pressure. The goal is to understand how liquidity moves in the market and spot signs of institutional accumulation or distribution.
What Is the Difference Between Order Book and Tape?
The order book (Level 2 or DOM) shows pending orders at different price levels, representing liquidity that may or may not get filled. The tape (time & sales) displays completed transactions, showing actual buying and selling activity in real time.
What Is the Difference Between Technical Analysis and Tape Reading?
Technical analysis relies on historical price patterns and indicators, while tape reading focuses on real-time executed trades and market depth. Technical traders look at charts, whereas tape readers analyse live order flow to assess momentum and liquidity shifts.
How to Read Ticker Tape?
Modern ticker tape is displayed in time & sales windows on trading platforms. Traders monitor price, trade size, and whether transactions occur at the bid or ask. Rapid buying at the ask suggests demand, while consistent selling at the bid indicates selling pressure.
This article represents the opinion of the Companies operating under the FXOpen brand only. It is not to be construed as an offer, solicitation, or recommendation with respect to products and services provided by the Companies operating under the FXOpen brand, nor is it to be considered financial advice.

EURCAD (Supply/Demand + OTE + Liquidity)Hello traders!
We have valid 705 fib level, there we can expect reversal + mitigation demand zone.
Now price go to local correction. In local 0.5 fib level you will see big volume like confirmation before impulse till Demand.
Entry: confirmation on LTF in POI
Target: First problem zone is OB 4H
MAIN MOVE IN SHORT - TILL 0.5 of GLOBAL FIB LEVEL. SEE PRIVOIUS IDEA.
Demand zone also can be like fuel, so
Have a profitable day and don't forget to subscribe for more updates!
If you like this idea drop a like, leave a comment.

NZDCAD | Strong Demand Zone DetectedIf we look at the daily chart for NZDCAD we can see a strong demand zone forming. This level will make a good target for order flow.
Typically, you want to wait for price to reach this level and take a long. However, you can also use this as a higher timeframe orderflow bias. But keep in mind you'll be lowering your odds of success compared to the long.

EURCAD (BOS 1D + Demand + OTE + Volume + OrderFlow)Hello traders!
As you can clearly see OF, daily structure(BOS 1D), expecting reversal from OTE zone. Alarm on 618 Fib level. In this moment we see divergence(also possible 3 tops). Price build liquidity to come back to our POI.(DEMAND)
Have a profitable day and don't forget to subscribe for updates!

EURCHF (Order Flow + BOS + Demand + OTE)Hello traders!
As you can see our previous OB was mitigated and now we have BOS 1 H - we see good reaction, but at least 1-5min confirmation and we have green light.
Target new HH.
Have a profitable day and don't forget to subscribe for updates!

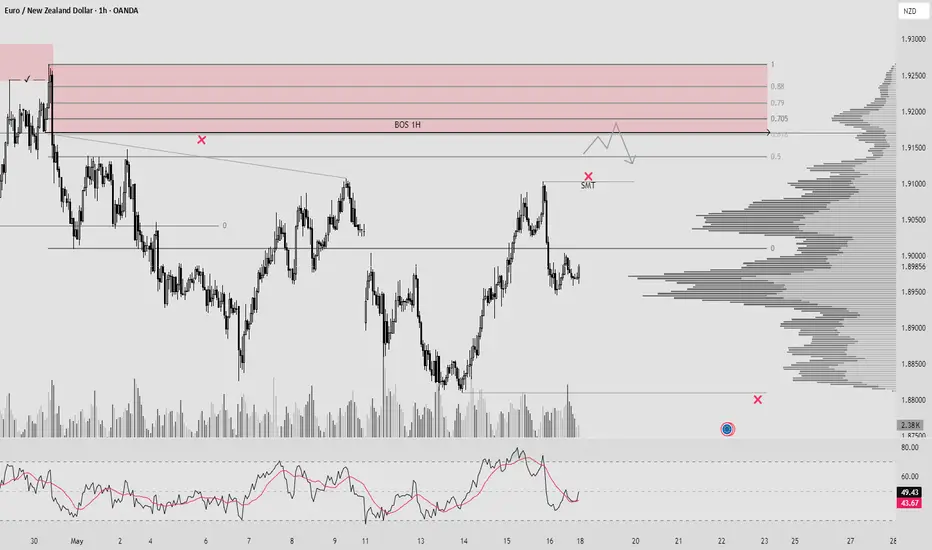
EURNZD (BOS 1H + INDUCEMENT + OTE + SMT + ORDER FLOW) Hello traders!
As you can noticed, we have unmitigated BOS on 1H - which is also our Supply Zone, under zone price built liquidity and make even SMT(Fake BOS). In Supply zone expecting reversal.
Have a profitable day and don't forget to subscribe for updates!
DXY (US Dollar): Bullish Order FlowA bullish order block has been identified on the H1 timeframe, situated below the Asian session range. With the US Dollar maintaining steady strength, there is potential for price to retrace into this order block for mitigation. Should this occur, a continuation of the bullish trend is anticipated, with price likely to rally and break above the recent structural high.

GBPUSD: Bullish Order FlowFollowing a decisive move away from the 1.32500 level, GBP/USD has gained bullish traction. This price action has left an unmitigated order block in its wake, which may act as a key area of interest for buyers and could support the continuation of the current upward trend.

USDJPY Bearish Forecast, More Bearish Order FlowAfter the recent change of character from Monday, UJ continued lower and broke the H1 structure. As we all know, whenever you get a break of structure, expect a pullback. On the H4 there is a nice bearish OB which serves as a nice point of interest for price to rally back towards, be mindful this OB is big so we don't know what to expect once price reaches it.
For now this is how I see the dollar heading towards.

USDCHF: More Bearish Order FlowSimilar to USDJPY , USDCHF has exhibited a change of character, initiating a bearish order flow for the week. Price has reached a key point of interest where a potential continuation to the downside could occur. The DXY is reflecting similar behaviour, supporting the bearish outlook.
An entry position has been established, and now it is a matter of monitoring the trade and allowing the market to develop accordingly.

SUI: Into the Trap — or Out of It?Looks like smart money just left breadcrumbs. We’ve got a clean structure break followed by a classic Fair Value Gap — price wicked into it and held. This kind of move often signals reaccumulation before expansion.
If this is a trap, it's beautifully laid. If it's a setup — it's surgical.
Expecting a bounce from the FVG zone back toward the recent highs around 2.36.
Entry: $2.21-2.23
Stop-loss: $2.19
Target: $2.36
Risk/Reward: 2.89
More thoughts in my profile @93balaclava
Personally I trade on a platform that offers low fees and strong execution. DM me if you're interested.

HOW To use Order Flow / Delta Volume Indicator to identify TrapOrder Flow / Delta Volume Indicator: Performance & Trap Identification Analysis
### Overview
The Order Flow / Delta Volume Indicator analyzes real-time buying and selling imbalances , accurately capturing momentum shifts and highlighting potential market traps . This analysis clearly demonstrates the indicator’s effectiveness in pinpointing trend reversals, momentum shifts, and identifying price traps.
Indicator Functionality
- ** Order Flow Dynamics **: Tracks cumulative buy/sell volumes, indicating shifts in market sentiment.
- ** Delta Volume Analysis* *: Highlights buyer-seller imbalances, pinpointing precise moments of significant market activity or divergences.
- **Signal Logic**:
- ** Buy Signals **: Generated when positive order flow aligns with positive delta, suggesting buying dominance.
- ** Sell Signals **: Produced when negative order flow and negative delta indicate increased selling pressure.
- ** Trap Identification **: Divergence between cumulative delta and price direction signals potential market traps . For instance, rising prices with declining cumulative delta suggest weakening buying pressure and possible bearish reversals (traps).
Performance Insights (from chart)
1. **Bullish & Bearish Signal Accuracy**
- Clear, timely bullish and bearish signals aligned precisely with genuine market momentum shifts.
- Robust performance capturing sharp upward and downward price movements, validated by volume spikes.
2. **Effective Market Trap Identification**
- Detected key divergences between cumulative delta and price movement, effectively highlighting potential market traps.
- Example highlighted: recent market scenario where price rose while cumulative delta declined, signaling weakening bullish momentum and indicating a potential bearish reversal.
3. **Momentum Shift Reliability**
- Successfully differentiated significant momentum changes from short-lived price movements.
- Signals consistently matched subsequent market behavior, reinforcing the indicator’s reliability.
Key Takeaways
✅ Accurate and timely identification of trend reversals and continuation.
✅ Effective in highlighting divergences, significantly aiding in identifying market traps.
✅ Clear volume-based signals, ensuring traders can easily interpret market conditions.
✅ Consistent performance across diverse market scenarios, demonstrating strong analytical capability.
The Order Flow / Delta Volume Indicator remains an essential tool, reliably capturing crucial market turns and effectively highlighting potential traps through clear cumulative delta divergences.

NZDJPY 4HNZDJPY 4h
Based on MMSM, IRL to ERL , weekly CRT and Order flow is bearish.
it's only my view though. Always check your analysis before taking trade. Thank you and happy trading .

How to Spot Market Turns using Order Flow & Delta Volume Ind.Overview
The Order Flow / Delta Volume Indicator combines order flow dynamics with delta volume analysis , pinpointing market shifts by tracking buying and selling pressure . This chart analysis demonstrates how effectively the indicator identifies precise moments of market turns and shifts in momentum.
How It Works
Order Flow Dynamics
Tracks cumulative buying and selling volumes.
Identifies potential reversals by highlighting shifts in order flow direction.
Delta Volume Analysis
Measures the difference between buying and selling volume (delta).
Pinpoints exact candles where buyer-seller imbalance occurs.
Signal Generation Logic
Buy signals emerge when order flow and delta volume confirm rising buying pressure.
Sell signals appear when order flow combined with negative delta signals increased selling activity.
Signal Confirmation (Magical part of this Indicator), Blue line inlines with trend to confirm the strength, else it's a trap move.
Performance in This Case Study
Market Reversal Precision
Accurately highlighted buy signals at key reversal points where bullish order flow resumed.
Provided timely sell signals precisely at points of bearish order flow dominance.
Trend Confirmation
Signals effectively filtered market noise, clearly distinguishing actual trend shifts from temporary price fluctuations.
Consistent alignment of signals with subsequent price action confirmed robust indicator performance.
Volume-Based Clarity (Blue Line)
Delta volume effectively differentiated real momentum changes from false breakouts.
Order flow dynamics reliably indicated market sentiment shifts, offering clarity in volatile conditions.
Key Takeaways
✅ Order flow shifts clearly indicated genuine trend reversals.
✅ Delta volume accurately pinpointed moments of market imbalance.
✅ Signals reliably differentiated between temporary fluctuations and meaningful market movements.
✅ Indicator performance remained robust across varying market conditions.
This indicator's precise alignment with market behavior underscores its practical utility in identifying and analyzing market turns.

03/24 SPX Weekly GEX Outlook, Options FlowYou can see that every expiry has shifted into a stronger bullish stance heading into Friday, with GEX exposure moving upward across the board—though total net GEX is still in negative territory, while net DEX (delta exposure) is positive. This combination points toward a likely near-term rebound this week, which makes sense after testing the 5600 range last week….
Here’s a more detailed breakdown of the key zones and likely moves this week:
Bullish Target:
The current uptrend could reach 5750 on its first attempt (already reached in Monday, thx bullsh :) ). If a positive gamma squeeze emerges at that level, we might see an extension to 5800 or even 5850 as a final profit-taking zone for bulls this week.
HVL (Gamma Slip Zone):
Placed at 5680, this threshold currently supports a low-volatility environment. A drop below 5680, however, could reignite fear and fuel bearish momentum.
Put Floors & Net OI:
The largest net negative open interest (OI) cluster is at 5650, with the next key level near 5600. At 5600, net DEX reads fully positive, suggesting strong buying support if the market tests that lower boundary.

Hidden Forces: Decoding Buyer & Seller Activity on ChartsTotal Volume vs. Volume Delta: The total volume on the chart includes both buys and sells, making it less useful for analysis. Volume Delta, however, shows whether buyers or sellers dominated within a candle.
A green Delta candle means more aggressive retail buying; a red one means more retail selling. This helps analyze market sentiment beyond price movement.
Price & Delta Relationships:
1. Price and Delta move together → Organic movement, likely driven by retail.
2. Delta moves, but price doesn’t → Retail is heavily biased in one direction, absorbing limit orders. Possible smart money trap.
3. Price moves, but Delta doesn’t → Retail didn’t participate in the move. Lack of belief or failed market-making attempt.
4. Price moves against Delta → Strong indication of market manipulation. Large players using aggressive strategies against retail.
Market Manipulation & Smart Money:
* Whales leverage retail psychology and order flow to position themselves.
* Retail often gets caught in fake moves, unknowingly providing liquidity to big players.
Final Thought: By analyzing Delta and price movement together, we can spot hidden large buyers and sellers and understand market dynamics beyond surface-level price action.

Will ES go more deeper ?The E-mini S&P 500 futures contract ( CME_MINI:ES1! ) exhibited a liquidation profile (Profile A), characterized by two distinct distributions. The subsequent session (Profile B) formed a balanced profile and remained entirely below the lower distribution of Profile A, indicating continued bearish sentiment.
Profile C emerged as a short-covering profile, with its upper boundary testing the high of Profile B by a minimal margin. Both Profile B and C exhibited trading activity around the lower distribution of Profile A without breaching its low. Profiles A, B, and C established a base at the C Line, identified as a longer-term support or demand zone.
Yesterday's session (Profile D) also presented a liquidation profile, briefly trading below the C Line before recovering and maintaining balance around this level. The market demonstrates reluctance for further downside, with lower prices consistently triggering short-covering rallies rather than initiating new selling. Even though Profile D traded lower, it did not exhibit significant selling conviction.
Given the prevailing geopolitical risks, including the ongoing tariff disputes and the unresolved Ukraine-Russia conflict, further liquidation during today's Regular Trading Hours (RTH) remains a possibility.
However, sustained buying interest above the balance of Profile C, driven by short covering and new long positions, would indicate a potential shift in market sentiment towards accumulation on a higher timeframe. The market's behavior during today's RTH session will be crucial in determining the next directional move.

DAX futures after Trump - Zeleansky clash meetingMarket Analysis: Anticipating March Volatility
The market is demonstrating superior collective intelligence through recent price action. The EUREX:FDXM1! index has established balanced profile patterns over several consecutive sessions, indicating a lack of directional conviction among participants. This consolidation phase suggests market participants are in a holding pattern, awaiting catalytic information before committing to directional positions .
Friday, February 28th marked both month-end rebalancing and a critical geopolitical event as markets positioned ahead of the Trump-Zelensky meeting. The subsequent contentious Oval Office exchange between the US and Ukrainian presidents on February 28th has created significant geopolitical uncertainty . This high-stakes diplomatic confrontation, which ended without the anticipated minerals agreement being signed, has introduced a new variable into market equations .
Projected Market Impact
Early March is likely to experience heightened volatility across multiple asset classes:
- **European and US Indices**: The breakdown in US-Ukraine relations and resulting implications for European security policy will likely trigger significant price swings in both US and European equity markets . With European leaders now forced to reconsider their defense strategies in light of potentially diminishing US support, market participants must reprice risk premiums accordingly .
- **Commodities**: Oil and gold NYMEX:CL1! COMEX_MINI:MGC1! markets should see amplified movement as geopolitical tensions typically drive safe-haven flows and energy price speculation .
- **Currency Markets**: The dollar CAPITALCOM:DXY is positioned to strengthen against major currencies as uncertainty typically benefits the world's reserve currency, particularly when European geopolitical stability comes into question .
The DAX futures, currently showing mixed signals from analysts with projections ranging from 17,500 to potentially higher levels by year-end, will likely experience increased volatility in the near term as markets digest these developments .

USD/JPY Market Analysis – Potential Reversal or Continuation?This 15-minute chart of USD/JPY displays a clear bullish impulse following a Change of Character (ChoCh) and a Break of Structure (BoS) . Price action has reached a key resistance zone, and traders are now anticipating the next move based on market reactions.
Key Observations :
1. Change of Character (ChoCh) :
- This indicates a shift from bearish to bullish sentiment.
- The market rejected lower prices and started forming higher highs and higher lows.
2. b]Break of Structure (BoS) :
- This confirms bullish momentum as previous resistance levels are broken.
- A strong bullish move suggests demand is dominating.
3. Current Price Action :
- The price has approached a liquidity zone (previous high).
- Potential rejection at this level suggests profit-taking or a shift in order flow.
Possible Scenarios:
✅ Bullish Continuation :
- If price retraces into the M15 demand zone (marked on the chart) and finds support, a continuation to the upside is likely.
- A break above the current high could push price towards 149.950 or even 150.000.
❌ Bearish Reversal :
- If price aggressively rejects the current high and breaks the M15 demand zone , we could see a bearish move towards **149.100 - 148.900**.
- This would indicate a deeper correction or potential trend reversal.
Trading Plan:
- **Wait for confirmation at the M15 demand zone.**
- **Look for bullish price action signals for continuation trades.**
- **If demand fails, shift bias to bearish setups.**
📌 Conclusion :
USD/JPY is at a critical decision point. The next move will depend on whether buyers defend the demand zone or if sellers step in to drive price lower. Stay patient and react to market structure shifts accordingly. 🚀📉

Is Liquidity Zones The Hidden Battleground of Smart Money In every market move, liquidity zones are the battlefields between buyers and sellers. Understanding these zones is crucial for spotting reversals and breakouts before they happen.
What Are Liquidity Zones?
High Liquidity Areas, Where large orders are placed, typically around key support/resistance or round numbers.
Low Liquidity Areas. Where price moves quickly due to fewer orders, often creating price imbalances.
Why Liquidity Matters
Smart money (institutions) seeks liquidity to execute large orders without massive slippage. Their footprints appear as wicks, sudden volume spikes, or rapid price reversals.
Spotting Liquidity Traps
False Breakouts, Price pierces a key level, triggers stop losses, and reverses quickly.
Stop Hunts, Sudden price spikes beyond a key level, only to return inside the range.
rading Strategy Example
1. Use volume profile or heat maps to spot high-interest price areas.
2. Wait for Reaction, Enter only after confirmation (e.g., a sharp wick or order flow shift).
3.Risk Management, Place stops beyond liquidity zones to avoid getting trapped.
Master liquidity zones, and you'll start seeing the market through the eyes of institutional players.

Scalper’s Paradise – Insights on Evolving Technical LevelsThis is my first post, and I’ll do my best. However, I might not know how to update the post or even view the comments. So, in advance, I apologize for any issues that may arise. :)
Now, let’s dive in with a snapshot of a 1-minute chart. Here, you can see the developing VPOC line along with the VWAP line. These aren’t just random indicators—they are volume-based indicators, meaning the data comes directly from the exchange system. This makes them highly relevant for traders, as they provide crucial insights into market activity.
But what exactly does this mean?
The developing VPOC line (Volume Point of Control) represents the price level with the highest traded volume of the day. It is often displayed when using a Volume Profile.
On the other hand, the VWAP (Volume Weighted Average Price) is a standalone indicator that calculates the average price based on volume. Essentially, the VWAP line divides the chart into two key areas:
Above VWAP → Favorable for short positions (or considered expensive for long positions).
Below VWAP → Favorable for long positions (or considered expensive for sellers).
These levels help traders gauge price efficiency and market sentiment throughout the day.
Insights from My Time as an Institutional Junior Trader
As a junior trader in the institution, my job was simple: follow orders. This meant I was told what to trade and in which direction—I was responsible for executing the trades at the best possible price.
Now, as an institutional trader, I execute thousands of trades a day, which naturally results in an average price due to the sheer number of trades executed at different price levels.
So, how is my execution evaluated throughout the day? Exactly—against the Volume Profile and VWAP.
For example, if I need to buy a large quantity and my executions are concentrated in the lower area of the VWAP-divided chart, it means I’ve done a good job—I’ve secured a better-than-average price. On the other hand, if my trades are mostly in the upper area, it means I haven't performed well, as I couldn’t even beat the average price.
Let’s put on our thinking cap and bring everything together.
Imagine you need to accumulate a long position, and you’ve been buying thousands of times, resulting in an average price.
Now, let’s assume you are an institutional junior trader, and your boss instructs you to buy. You’ve already accumulated 85% of the position, and your average price is in the lower area of the VWAP-divided chart. Suddenly, the price has risen, and you have the opportunity to buy the remaining 15% at the VWAP.
Would you take the trade? Of course, you would.
Why? Because 15% won’t significantly move your average price, and you’re still buying at a reasonable level.
And that’s exactly how institutional traders operate all the time. They are constantly evaluated against these key indicators (VWAP & Volume Profile)—just like I was.
How You Can Apply This as a Retail Trader
So far, we’ve discussed just a small aspect of trading, but now you understand that levels matter and that institutional traders think differently when it comes to buying.
While retail traders often focus on getting the best price, institutional traders prioritize average price. This fundamental difference leads to completely different trading styles.
Now that you know how institutions operate, you can start watching the key levels provided by indicators like VWAP and Volume Profile. These aren’t just static levels—they are developing levels, meaning you can use them multiple times throughout the day.
Monitor these key levels throughout the session.
Pay close attention to order flow when price approaches these levels.
Identify who is in control—buyers or sellers—so you can take action accordingly.
By combining these insights with the order flow, you can make more informed and precise trading decisions—just like the institutions do. 🚀
Sincerely,
Marco

1000BONKUSDT: Ready for a Breakout?
🔥 **1000BONKUSDT.P** has been consolidating under resistance for a long time, accumulating liquidity. The price has tested **0.017630 USDT** multiple times, and whales are clearly building positions. The question is: will we see a breakout, or will there be another dip before the pump?
---
🔑 **Key Levels:**
**Support:**
**0.017630 USDT** — Major demand zone. A breakdown below this level could trigger further declines.
**0.016800 USDT** — Last defense for bulls to maintain the uptrend.
**Resistance:**
**0.018481 USDT** — Initial liquidity zone, where a local rejection may occur.
**0.019000 USDT** — Key level that, if broken, opens the way to 0.020 USDT.
**0.024379 USDT** — Ultimate target where large players might start taking profits.
---
🚀 **Trading Strategy:**
**Entry Points:**
- Long upon breakout of **0.018481 USDT**, confirmed by volume increase.
- Alternative entry on a retest of **0.017630 USDT**, provided support volumes increase.
**Stop-Loss:**
- Below **0.016800 USDT** to avoid liquidity grabs before the potential move up.
**Take-Profit Targets:**
**0.019000 USDT** — Partial profit-taking, securing position.
**0.020000 USDT** — Major target if momentum follows through.
**0.024379 USDT** — Ideal scenario if a strong impulse move occurs.
---
📈 **Market Analysis:**
Price has been consolidating near resistance, suggesting an impending breakout.
Large orders in the order book indicate whale activity.
Volume is starting to pick up, signaling a potential phase transition.
---
💡 **Conclusion:**
1000BONKUSDT.P is at a decisive moment. A confirmed breakout above **0.018481 USDT** could lead to a strong bullish move. However, if another fakeout and dump happen, it's time to reassess. What’s your take—ready for the pump? 🚀💬
