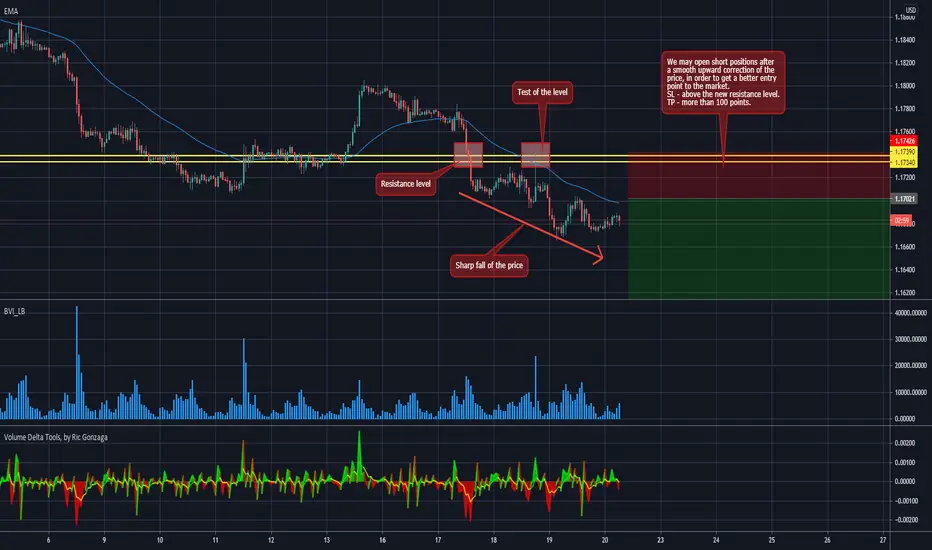
EURUSD SHORT on Order Flow - Follow the smart money! Strong Bearish Signal:
The price demonstrated a huge drop supported by the large institutional volume and broke through the previous support level.
Volume Zones:
This formed a new level of resistance, which contains large market participants volume and was created during this move from 1.1256 – 1.1267. Moreover, the price has already tested this mark and then resumed falling.
Sentiment:
This indicator shows that 76% retails traders are in long positions, which is a good additional signal for us (trading against the "crowd").
c.radikal.ru
Consider Short Positions:
Given all these factors, we should consider exceptionally short positions. We may enter the market after a smooth upward correction, in order to get a more profitable entry point. A stop loss may be placed above the new resistance.
Profit Potential:
More than 100 pips.
To learn more about order flow based volume trading, sentiment analysis and trading against the retail crowd see the educational article below -
Orderflow
GOLD H1 PROJECTIONReason:
1. Price trading inside LTF bearish channel
2. looking for a small push towards bearish OB
3. Then big dop

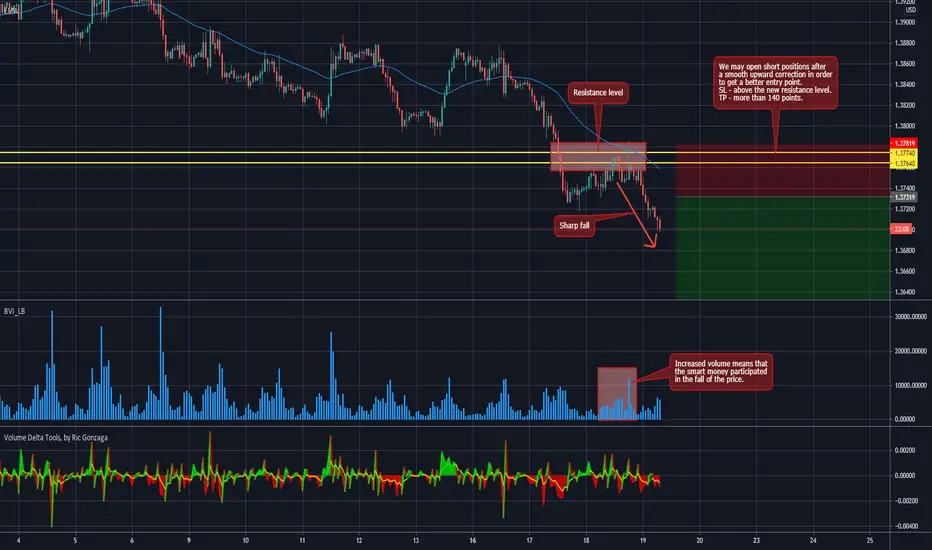
GBPUSD SHORT on Order Flow - Follow the smart money! Strong Bearish Signal:
The price demonstrated a huge drop supported by increased institutional volume and broke through the previous support level.
Volume Zones:
This formed a new level of resistance, which contains large market participants volume and was created during this move from 1.3764 - 1.3774.
Sentiment:
This indicator shows that 79% retails traders are in long positions, which is a good additional signal for us (trading against the "crowd").
a.radikal.ru
Consider Short Positions:
Given all these factors, we should consider exceptionally short positions. We may enter the market after a smooth upward correction, in order to get a more profitable entry point. A stop loss may be placed above the new resistance.
Profit Potential:
More than 140 pips.
To learn more about order flow based volume trading, sentiment analysis and trading against the retail crowd see the educational article below -
SWEET SWEET EURO TO 1.176After FOMC NEWS RELEASE we could see Euro make its was higher to old price range.

CHFJPY H1We could SELL to BUY, ultimately BUY-SIDE bias to catch a LONG position at lower prices, targeting the liquidity trendline for an upside move towards the supply zone.

GBPJPY H1 - SHORTWaiting for prices to move into our supply zone, give us a shift before taking sells.

EURUSD SHORT on Order Flow - Follow the smart money! Strong Bearish Signal:
The price showed a significant and sharp slump supported by both large volume and negative delta. It means that sellers are dominating among institutional players, which is a strong bearish signal.
Volume Zones:
It is necessary to allocate the support level/local minimum 1.1713, which contains the large volume. The price is currently testing it.
Sentiment:
This indicator shows that 75% retails traders are in long positions, which is a good additional signal for us (trading against the "crowd").
c.radikal.ru
Consider Short Positions:
Given all these factors, we should give preference to short positions. We may enter the market after keen breakdown of the support level. The move must be supported by the large volume, which will be a more precise signal for entering the market. A stop loss may be placed above the breakdown volume bar.
Profit Potential:
More than 120 points.
To learn more about order flow based volume trading, sentiment analysis and trading against the retail crowd see the educational article below -

6B - Bullish, but like to see dips! 🤩Technical Overview: - GBP/USD
Check out our previous posted analysis
Analysis is only 1 piece of the puzzle 🧩
Our analysis is a sentiment for the upcoming week, month.
Use this as a weather forecast, you are the person that has to put on a jacket when it’s raining.
Trade this sentiment based off your own entry strategy at the right time.
Flow with the Devil 😈
Trade with the manipulation👾
STAY UPDATED BELOW!

GBPCHF - Retracement then LongWe are currently inside a Discount Area, above a weekly bullish Orderblock and a daily Mitigation Block. A retracement should happen and it should test the mitigation block or Deeper into the Weekly bullish Orderblock. Targeting the Bearish Breaker (Our first PD Array), or the Weekly Orderblock area into Equilibrium. We also have a Liquidity Void (imbalance) to be targeted as extra confirmation.
This is just my perspective on the pair. Do your own research and good luck!

Back Testing GBPUSD One Loss Two wins Im continuing the OANDA:GBPUSD back test loss the first trade but quickly adjusted to win two back to back patience is the key understanding the higher time frames as well.

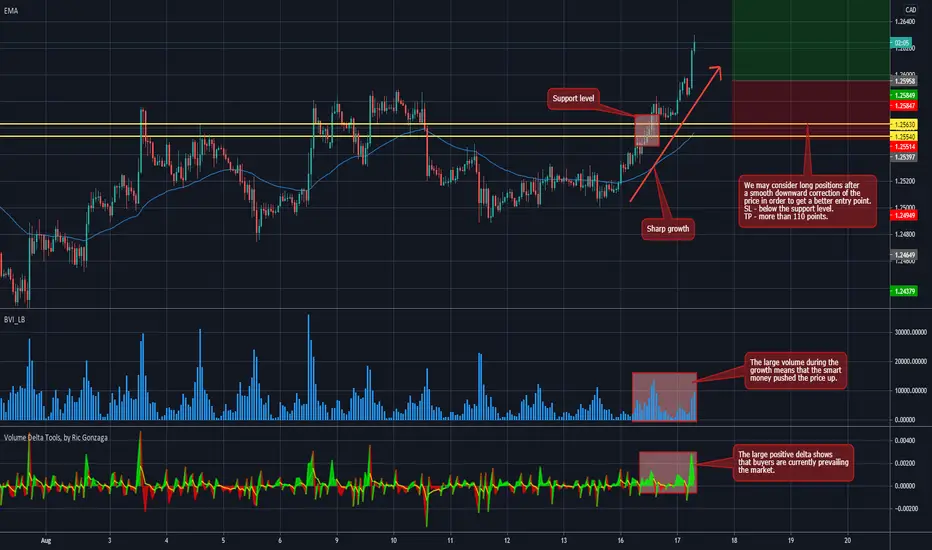
USDCAD LONG on Order Flow - Follow the smart money! Strong Bullish Signal:
The pair showed a sharp growth and broke out the previous resistance level, which shows the weakness of sellers. Moreover, the move was supported by the large volume and positive delta, which means that buyers are dominating the market now.
Volume Zones:
We need to allocate the new support level 1.2554 - 1.2563, which contains the large volume.
Sentiment:
This indicator shows that 63% retails traders are in short positions, which is a good additional signal for us (trading against the "crowd").
d.radikal.ru
Consider Long Positions:
Given all these factors, we may regard long positions after a smooth downward correction of the price in order to obtain a better entry point. A stop loss may be placed below the new support level.
Profit Potential:
More than 110 pips.
To learn more about order flow based volume trading, sentiment analysis and trading against the retail crowd see the educational article below -
CHFJPY H1 - LONGWe are waiting for prices to give us a break out of structure, leaving behind demand zones to get involved.

GBPCAD H1 - SHORTWaiting for prices to move into the supply zone, give us a shift in structure before taking SELLS.

NDQ Short Clear Shift in Structure and Break of Structure occured giving signs of a possible drop that will break the 14 900 level - this is also supported by the sell side liquidity left under 14 800. Entry opportunity might happen between the London or New York Session Killzone hours (which are 09:00 - 12:00 & 14:00 - 17:00 SAST)

CADJPY H1 - SHORTSaw this chart and it looks good for sells if we can get a pullback.
Optimum price: 88.290

CADJPY H1 - SHORTSaw this chart and it looks good for sells if we can get a pullback.
Optimum price: 88.290

EURAUD H4 - LONGBOS > Demand zone, wait for confirmations onto these POIs before taking BUY positions.

GBPJPY H1 - SHORTPrices are looking to clear equal highs, tapping into the supply zone, giving us a UTAD (Up thrust after distribution), and potentially shift.

CADCHF H1 - SHORTWaiting for prices to break equal highs, test the supply zone, give us a shift from SH>WH before a sell-side move.

USDJPY H1 - SHORTPrices are in our H1 supply zone, made a secondary push phase creating a new high within our supply, liquidating previous swing high. With this, we are looking for a clean breakdown of structure for potential sells onto unmitigated areas.

AUDCHF H1 - LONGPrices broke out of structure, tapped onto our demand zone and now looking for a secondary BOS for a shift in structure to take prices higher.

AUDCAD H1 - LONGPrices tapped into a H4 demand zone, gave us a minor BOS and now we can look for unmitigated areas on the LTF to catch buys.

EURUSD 15M - SHORTPrices tapped into a supply zone, looking for a shift in structure before taking sells into liquidity lows.
