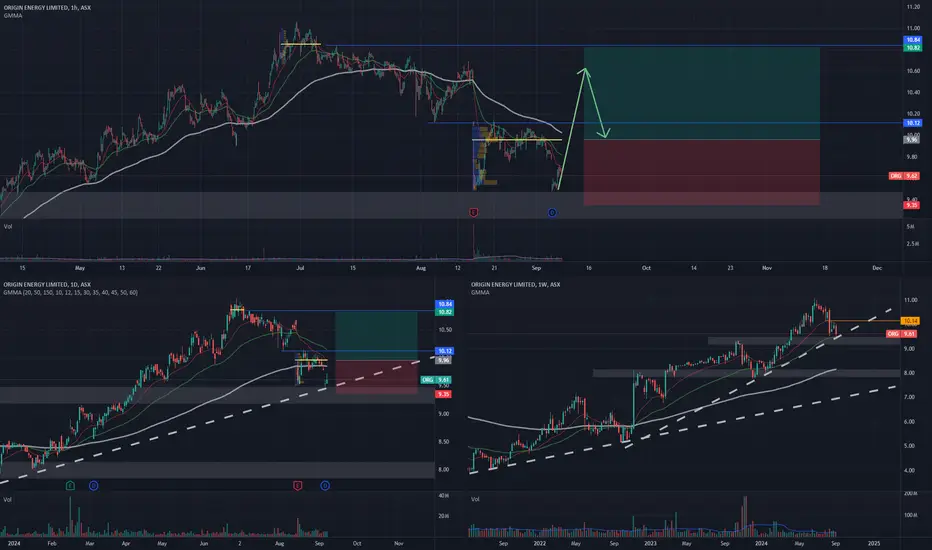
ORG buy on next pullback, trend followORG is looking good on the weekly, holding trendline.
Daily shows earnings disappointment but post divs, price still held 9.50 and is now breaking past the $10 PoC set by that range.
Look for a pullback from here for long entry, partial on ATH, hold the rest for trend follow.
ORG

ORG trend followORG bouncing off weekly trendline.
Confirmation on W reversal hourly, then watch for entry on pullback to around PoC or aggressive entry at the neck of the reversal.
ORG - Potential Buying OpportunityORG has pulled back and is showing support at the current support level. This could be a sign that this pullback may be over and it could potentially move higher. I am targeting the Resistance level of $5.30 with a tight stop below the swing low (potential 22% gain).
Please note these are my own notes, by no means trading advice. Please do your own research before entering into any trade.

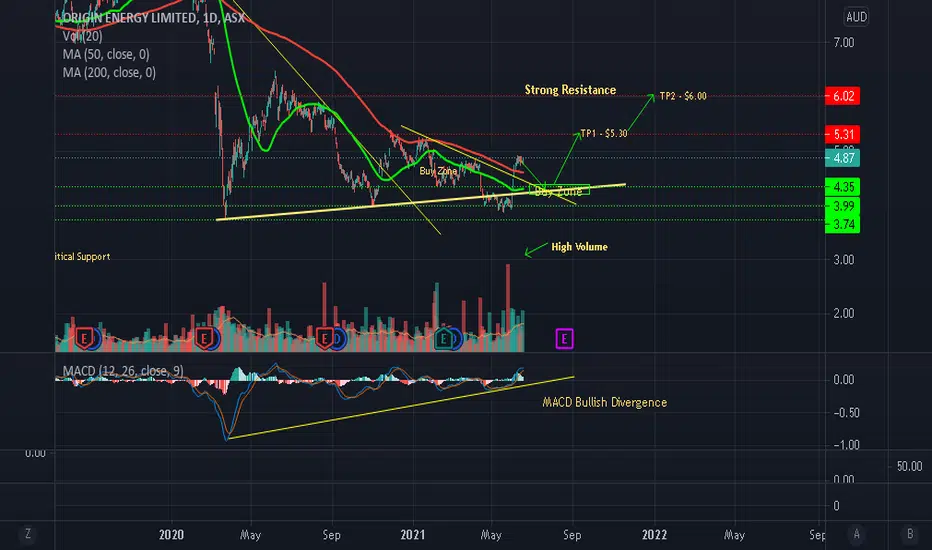
ORG - Bullish Trade PlanORG has bounced off strongly off Support with very High Volume, confirming its Bullish reversal. I expect a little correction to the downside as it looks like it is currently facing some resistance. There is also MACD Bullish Divergence on the Daily Timeframe and I expect a small correction or maybe a backtest of support near $4.20 - $4.35 zone which could give a fantastic opportunity to get long with a target towards TP1 - $5.30 and TP2 - $6.00.
Please note these are my own notes, by no means trading advice. Please do your own research before entering into any trade.
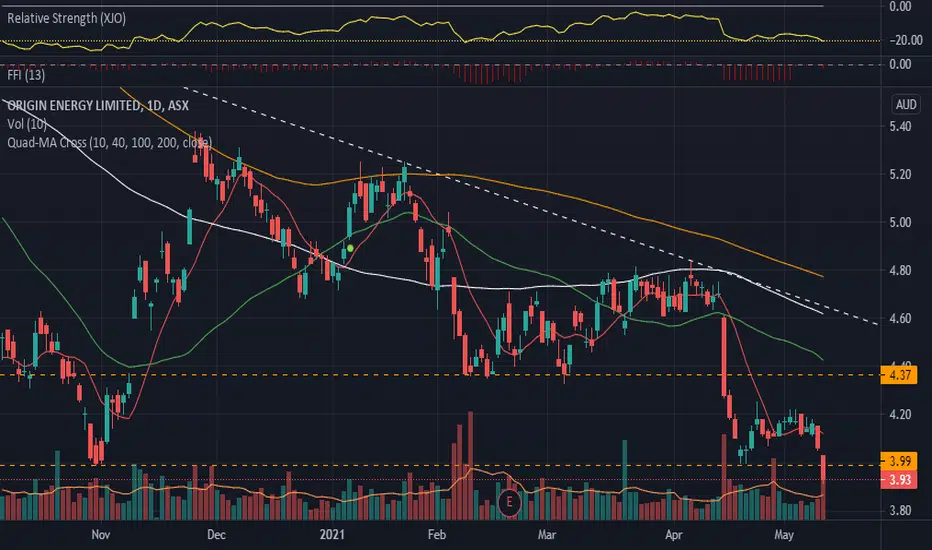
ORG.ASX_Range Breakout Trade_ShortENTRY: 3.93
SL: 4.17
TP: 3.44
- ADX>20
- RSI<50, RSI<30
- Daily RS -ve
- Daily FFI -ve
- Daily MACD -ve
- Weekly RS -ve
- Weekly FFI -ve
- Weekly MACD -ve
- Breakout from range with good volume
ORG - Potential Buying OpportunityBullish trend confirmation indications:
1. Impulsive price action at the break of the Downtrend line.
2. Price Broke out of the Downtrend Line with High Volume .
3. Price is retracing to the Buy Zone (Fib Retracement Level of 38.2% - 61.8%) between $4.50 - $4.85 Zone
4. MACD Histogram showing a potential shift from Selling Momentum to Buying Momentum.
5. Good Buying Opportunity when it confirms Bullish Price Action.
Please note these are my own notes, by no means trading advise. Please do your own research before entering into any trade.

ORG-ASX: On the way to the target and closing the GapThe purchase was at 9.43 and Target is at 10.07. We are on the way ... money walking ...
#luizdenot #xbroker #org #energy

Origin Energy - Ascending Wedge Reversal Completion Looms CloserCurrently within the small ascending dotted wedge. We still have some growth ahead of us (up to around 10.50) before we break to downside which is likely to occur around full year results announcement (16th of August). When we break downwards we will bounce back up off the support around 9.50 to retest the breakout level as resistance (around 10.25). We will then retrace further to the green support zone between 9 and 9.20.
Although many things can change, if the above scenario plays out then from here it is likely we will build some nice momentum to try and break through the light 9:50 resistance, the 10.20-10.50 medium resistance zone; and then ultimately have a failed first crack at the heavy resistance around 11.20ish.

