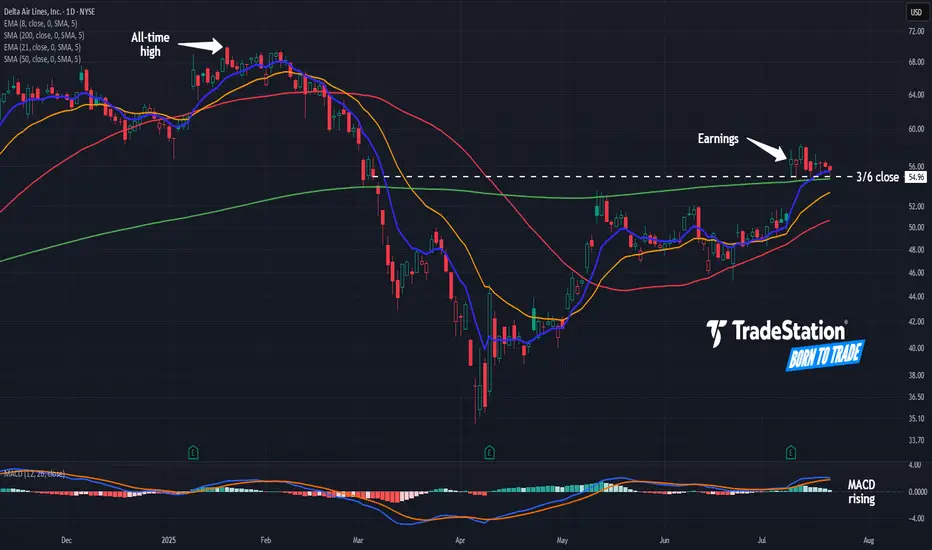
Delta Airlines: Where’s the Pullback?Delta Airlines rallied two weeks ago on strong earnings, and some traders may see further upside.
The first pattern on today’s chart is the tight consolidation pattern since July 10. The lack of pullback could reflect a lack of selling pressure in the transport stock.
Second, DAL has remained above the March 6 closing price of $54.96 and its 200-day simple moving average. Has new support been established above the pre-earnings highs?
Third, the 8-day exponential moving average (EMA) is above the 21-day EMA. MACD is also rising. Those signals may be consistent with short-term bullishness.
TradeStation has, for decades, advanced the trading industry, providing access to stocks, options and futures. If you're born to trade, we could be for you. See our Overview for more.
Past performance, whether actual or indicated by historical tests of strategies, is no guarantee of future performance or success. There is a possibility that you may sustain a loss equal to or greater than your entire investment regardless of which asset class you trade (equities, options or futures); therefore, you should not invest or risk money that you cannot afford to lose. Online trading is not suitable for all investors. View the document titled Characteristics and Risks of Standardized Options at www.TradeStation.com . Before trading any asset class, customers must read the relevant risk disclosure statements on www.TradeStation.com . System access and trade placement and execution may be delayed or fail due to market volatility and volume, quote delays, system and software errors, Internet traffic, outages and other factors.
Securities and futures trading is offered to self-directed customers by TradeStation Securities, Inc., a broker-dealer registered with the Securities and Exchange Commission and a futures commission merchant licensed with the Commodity Futures Trading Commission). TradeStation Securities is a member of the Financial Industry Regulatory Authority, the National Futures Association, and a number of exchanges.
TradeStation Securities, Inc. and TradeStation Technologies, Inc. are each wholly owned subsidiaries of TradeStation Group, Inc., both operating, and providing products and services, under the TradeStation brand and trademark. When applying for, or purchasing, accounts, subscriptions, products and services, it is important that you know which company you will be dealing with. Visit www.TradeStation.com for further important information explaining what this means.
Oscillators
Potential 14% Gain in CLANKER/USD PairUsing Dual Time Frame (1HR and 5HR charts), we can see that the 5HR chart shows custom indicator, Data Distribution with Extreme Clusters in extreme price (overextended to the downside), as shown by the yellow dots. This is also shown using the shorter time frame of 1HR as shown with yellows dots as well.
Also, another custom indicator, Zero-Lag USI Quantum Pulse PRO has changed on 1HR chart to green background, showing an entry point. Also, Zero-Lag USI shows confluence on the 5HR chart as the background changed from red to black, showing a potential change in momentum.

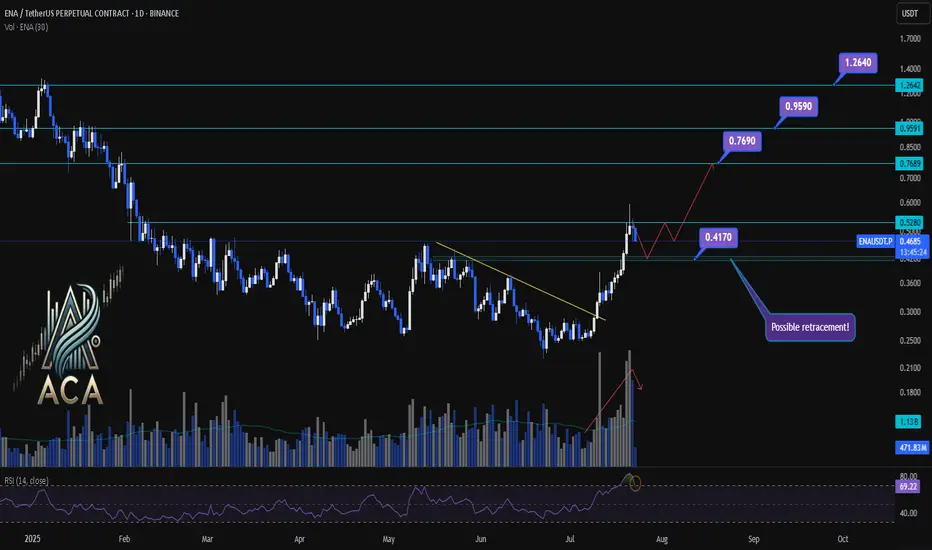
ENA/USDT Chart Analysis | Volatility Signals & Bullish TriggersENA/USDT Chart Analysis | Volatility Signals & Bullish Triggers
🔍 Let’s dive into the ENA/USDT perpetual contract and analyze recent price action, focusing on momentum shifts and key breakout scenarios.
⏳ Daily Overview
The daily chart shows that ENA recently reentered the overbought zone on the RSI, which can serve as a potential trigger for traders watching momentum shifts. Earlier, price action broke decisively above a long-standing descending trendline, resulting in a rapid, nearly 100% surge, a classic RR2 move off the trendline. This breakout coincided with a visible uptick in trading volume, confirming strong demand behind the move.
Now, during the ensuing rest or correction phase, trading volume is decreasing—often a constructive sign suggesting either profit-taking or a healthy pullback rather than panic selling.
🔺 Bullish Trigger & Setup:
- RSI Signal: Reentry into the RSI overbought zone is a potential long trigger, especially if confirmed by price action.
- Confirmation Level: A daily close with strong volume above $0.528 would add conviction to a bullish setup.
- Trendline Reference: The break above the recent trendline fueled the rapid advance, showing the importance of watching such key resistance levels.
📊 Key Targets (on further bullish confirmation):
- $0.769 — First upside resistance.
- $0.959 — Next bullish target.
- $1.264 — Extension target if momentum continues and broader market sentiment remains supportive.
🚨 Conclusion:
Eyes are on the $0.528 level—closing above it with volume, especially while RSI holds in the overbought zone, could provide the next strong entry signal. Current declining volume during pullbacks suggests this is likely a profit-taking phase or standard correction, not bearish capitulation. Keep monitoring RSI, volume profile, and price closes for the next actionable opportunity.
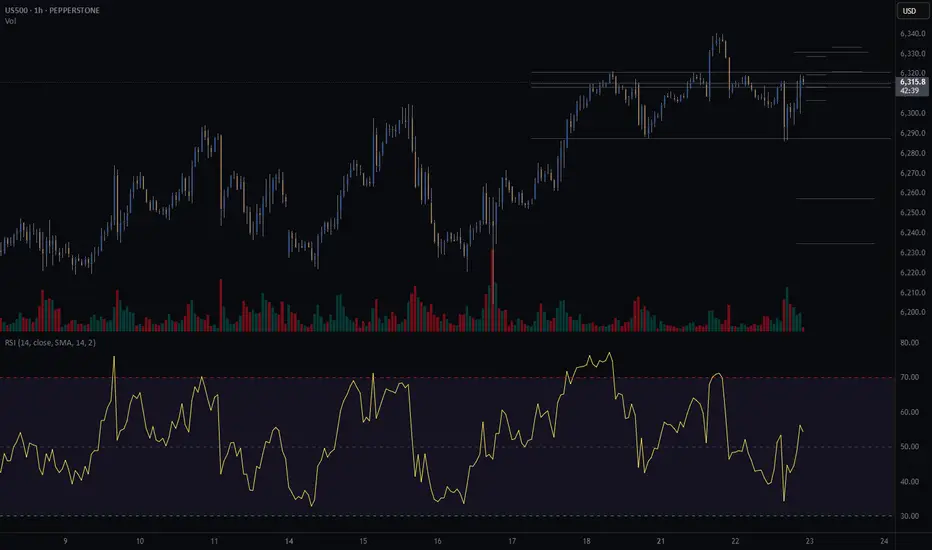
S&P500 (CASH500) SHORT - Head and shoulders Risk/reward = 5.8
Entry price = 6321.1
Stop loss price = 6333.5
Take profit level 1 (50%) = 6257.3
Take profit level 2 (50%) = 6234.9
Still waiting for confirmation on a few variables before I enter the trade.
News mentions of Nuclear this & Uranium that, whats the Macro?This is a look into the macro developments happening currently in UROY.
This is strictly a TA look into the big picture. We zoom out to Timeframes bigger than 1W.
At times zooming in to check (3 Day, 5 Day, maybe 1D) for potential swing trades.
I tend to look into things like price action, indicators, volume and other data to sway probabilities of where an asset may go and determine best opportunities of supply and demand zones based on my interpretations.
So jumping right in this is a look into price action on the 1 Month timeframe.
Looks to me like a massive macro falling wedge.
But theres massive volume. So thats a little contradicting.
In anycase always look for confirmation of breakouts.
On another negative note: this is only 5 years of data. Would have loved more price data.
Also note potential bullish cross of STOCH RSI, a momentum indicator. Still need confirmation though. If blue and orange line above 20 level on STOCH at monthly candle close.
COuld be a positive.
But key is to watch for confluence of many signs and or indicators.
I will be keeping my eyes on this.
Look for more posts as things develop on UROY.
DISCLAIMER: This is not financial advice, i am not a financial advisor. The thoughts expressed in the posts are my opinion and for educational purposes. Do not use my ideas for the basis of your trading strategy, make sure to work out your own strategy and when trading always spend majority of your time on risk management strategy.

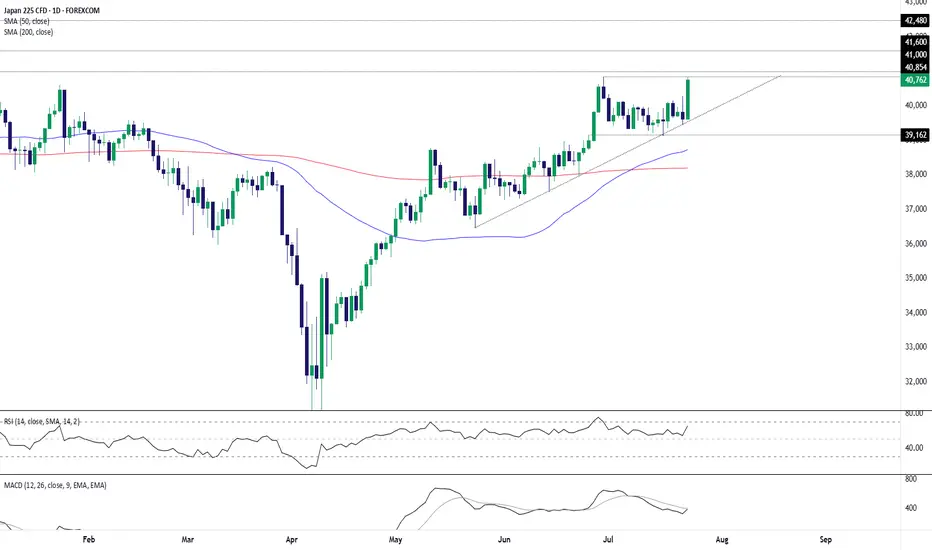
Japan 225: Breakout Watch as Tariff Cut Fuels RallyThe Japan 225 contract is ripping higher today on a trade deal being reached between the U.S. and Japan, including the apparent lowering of auto tariffs to 15%.
The price has already bounced strongly from uptrend support established in May, putting a potential retest of the June 30 high of 40854 on the cards. With momentum indicators perking up—pointing to building bullish momentum—the case for a topside break is improving.
If the price can break and hold above the June 30 high, watch for a potential run towards 41000—a level that saw plenty of action back in 2024. It looms as a decent level to build setups around.
If the price breaks and holds above 41000, consider establishing longs with a tight stop beneath the level for protection. 41600 and 42480 screen as potential targets, depending on desired risk-reward.
While the setup could be flipped if the price stalls beneath 41000, just how much downside would be forthcoming given the current mood is questionable.
Good luck!
DS
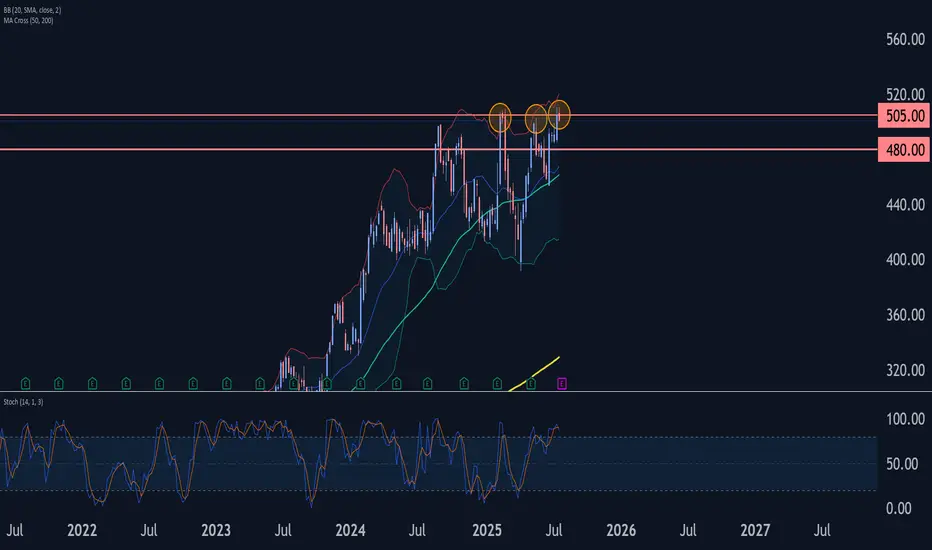
Race Wave Analysis – 22 July 2025
- Race reversed from long-term resistance level 505.00
- Likely to fall to support level 480.00
Race recently reversed down from the strong long-term resistance level 505.00, which has been reversing the price from the start of 2025, as can be seen below.
The resistance level 505.00 was strengthened by the upper daily and weekly Bollinger Bands.
Given the strength of the resistance level 505.00 and the overbought weekly Stochastic, Race can be expected to fall to the next support level 480.00.
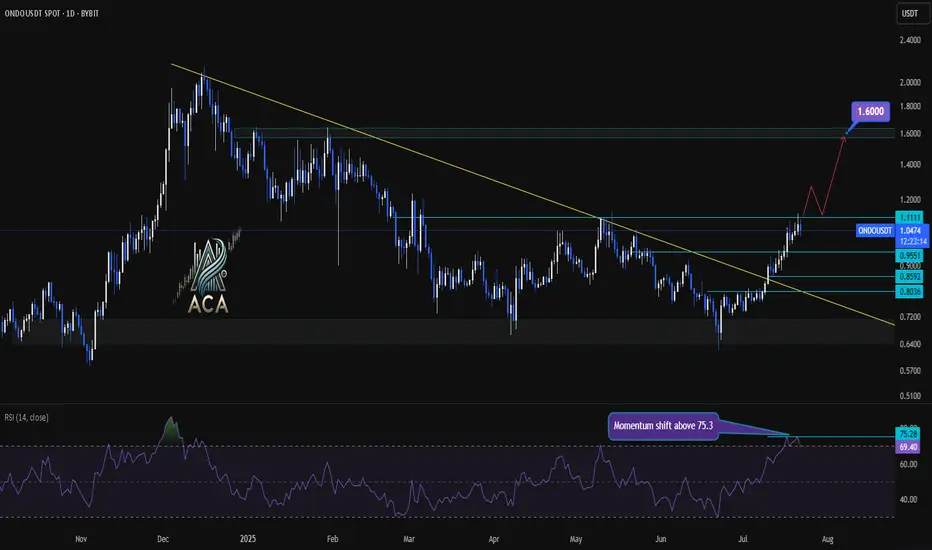
ONDOUSDT Daily Chart Analysis | Momentum Shift & Breakout LevelsONDOUSDT Daily Chart Analysis | Momentum Shift & Breakout Levels
🔍 Let’s dive into the ONDO/USDT daily chart and break down the latest momentum signals, key breakout areas, and targets for bulls.
⏳ Daily Chart Overview
The daily trend shows significant recovery after prolonged downward pressure, with price action now testing critical resistance levels. A key descending trend line has recently been challenged, highlighting a potential shift in market structure.
🔺 Bullish Setup
- Momentum Trigger: The RSI has closed above 75.3, signaling a strong momentum shift and upping the odds for continued upside.
- Breakout Confirmation: Watch for a daily candle close above the $1.1111 resistance level. This would confirm a bullish breakout and could serve as a solid trigger for further upside.
- Trend Line Dynamics: The price has decisively broken above the major descending trend line, which had capped rallies for months—removing a significant area of supply and emboldening bulls.
- Upside Target: Once confirmed, this setup opens the door for an advance towards the $1.60 area, where the next major resistance sits.
📊 Key Highlights
- Daily RSI closing above 75.3 reflects strong market momentum and buyer dominance.
- A daily candle close above $1.1111 can be used as a bullish trigger.
- The long-term descending trend line has been broken, indicating a major momentum shift.
- Immediate upside target stands at $1.60, representing a clear resistance level for profits or further evaluation.
🚨 Conclusion
Momentum is clearly shifting in favor of the bulls as technical barriers fall by the wayside. For traders looking to position long, confirmation above $1.1111 combined with the powerful RSI reading sets the stage for a move towards $1.60—keep these levels on your radar as the setup plays out!
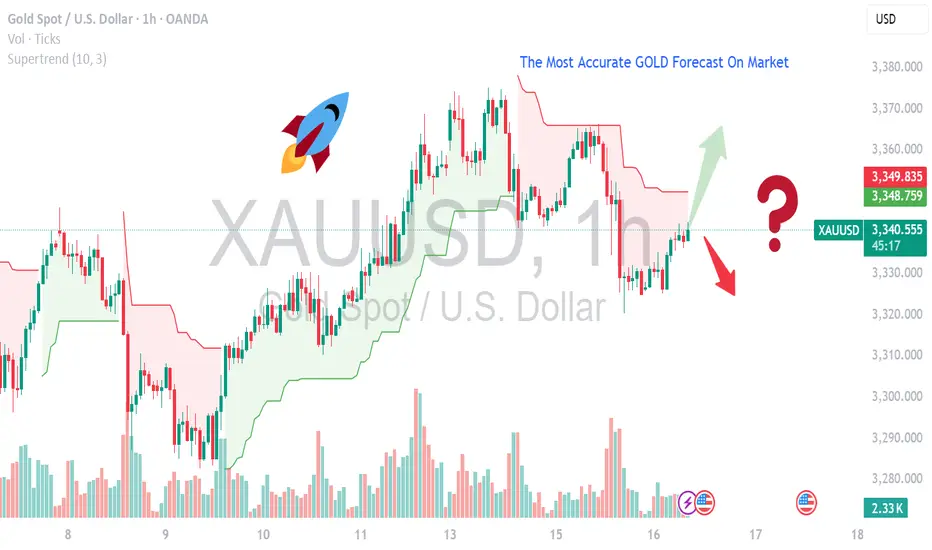
MOST ACCURATE XAUUSD GOLD FORECAST ANALYSIS MARKETCurrent Setup & Technical Outlook
Consolidation & Pennant Formation: Gold is building a bullish pennant and trading above its 50‑day MA — a classic continuation pattern suggesting a breakout toward new highs if momentum resumes .
Key Levels:
Support: $3,330–3,340 — confirmed by multiple technical sources .
Resistance/Breakout Zone: $3,360–3,375 — clearing this could trigger a rally toward $3,400+ .
Upside Targets: $3,390, then possibly $3,500–$3,535 per weekly forecast .
Alternate Bearish Scenario: A failure around the 0.618 Fibonacci resistance (~$3,374) and overbought RSI could spark a pullback to $3,356 or lower .
---
🧠 Fundamental Drivers
Inflation & U.S. Macro Data: Market awaits June CPI/PPI and Fed commentary — cooler inflation could boost gold via dovish expectations, while hotter data may strengthen the USD and weigh on bullion .
Geopolitical & Safe-Haven Demand: Trade tensions (e.g., tariffs) are keeping gold elevated near $3,350–$3,360 .
Central Bank & Real Yields Watch: Continued gold purchases and lower real rates are supportive, although mid-term easing in risks (like global trade) could curb momentum .
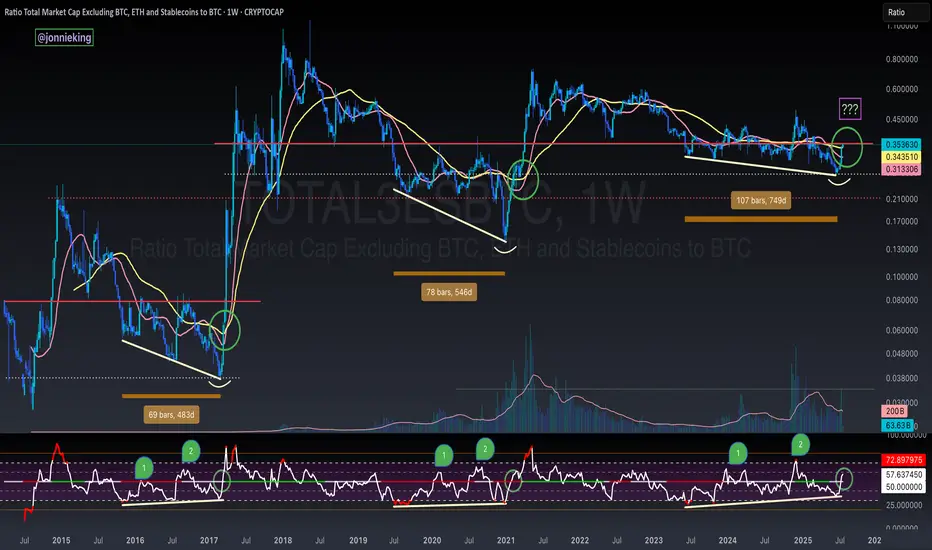
TOTAL3 / BTC - ALT SEASON BREAKOUT - Bullish Divergence SpottedBULLISH DIVERGENCE on CRYPTOCAP:TOTAL3 against CRYPTOCAP:BTC 🏁
You will see every time the RSI passed 50 on the Weekly chart in the post-Halving year it signaled Alt Season 🚀
This coincided with 3 tests of this level at 50, with the 3rd test being the real breakout 🤌🏼
Volume confirms change in trend 🏁
AWAITING CONFIRMATION 🚨
🅾️ Close several Weeks above key neckline resistance (currently here)
🅾️ Bullish Cross on the 20 / 50WMA
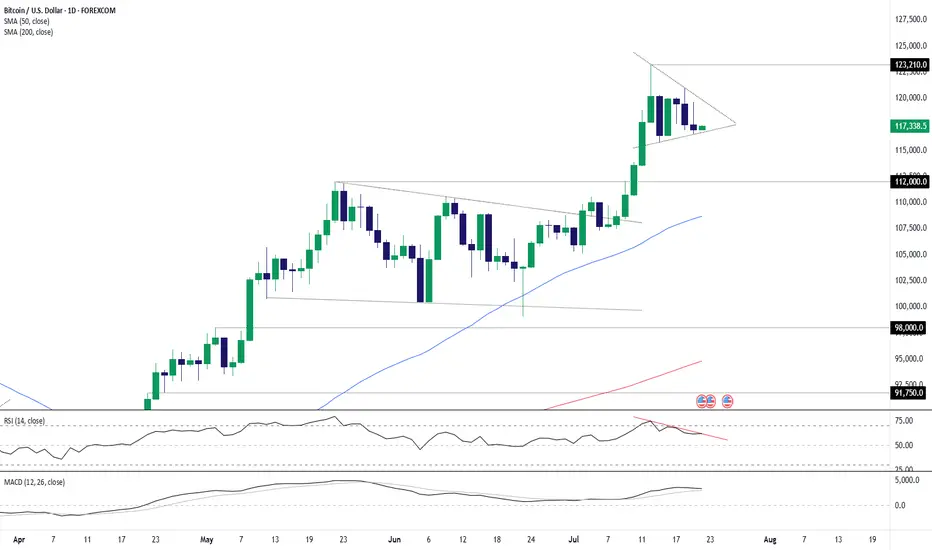
Bitcoin: Setup Builds for a Run Back Towards the HighsBitcoin is coiling within what resembles a bull pennant pattern, hinting at another bout of consolidation before the rally resumes. Trading near the lower end of the recent range, Monday’s pullback offers an appealing entry point, allowing longs to be established around current levels with a stop beneath the July 15 low for protection.
The downtrend from the record highs looms as the first hurdle, sitting around $119,700 today. A break above that level could prompt an accelerated move towards the current record high just above $123,000—an appropriate target for the trade.
Good luck!
DS
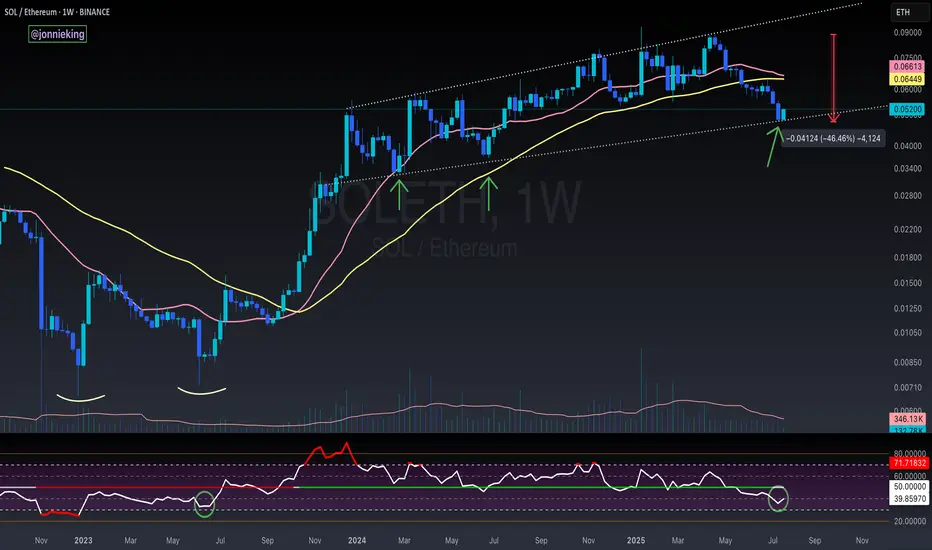
SOL / ETH - Reversal Signs FormingI suspect CRYPTOCAP:ETH has a bit more gas in the tank, but the early signs for the real Alt Season are nearing.
RSI on the weekly is nearing the June 2023 bottom which kicked off the massive bull flag formed on SOL / ETH for the next 2 years.
Still too early to call at this point tho.
Need volume to really burst through in the next week or two.
I’d also like to see BOATS:SOL close the week with a massive bullish engulfing candle.
The bearish cross on the 20 / 50WMA should mark the bottom when it occurs soon.
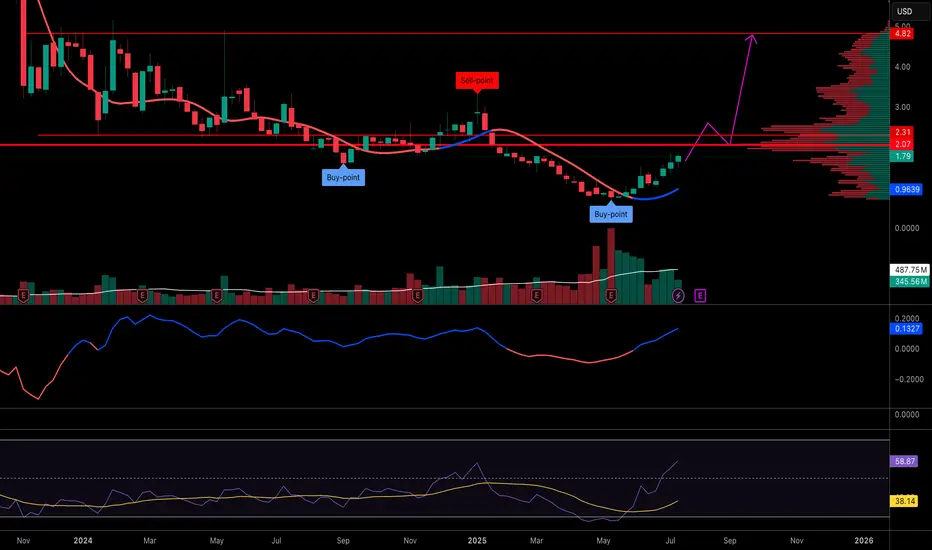
XRP Eyes Explosive Growth: A Path to $10 and a 2025 "Euphoria PhThe cryptocurrency market is charged with renewed optimism, and much of the focus is now turning to established digital assets like XRP. After a prolonged period of consolidation, a powerful combination of bullish technical indicators, evolving market dynamics, and a compelling value proposition is fueling forecasts of a significant price surge. Market analysis now points to a potential future where XRP could trade in the $6 to $10 range, a move that hinges on Bitcoin achieving a landmark price of $144,000.
Adding to this momentum, detailed chart analysis suggests that XRP may be on the cusp of entering a "euphoria phase" between August and October of 2025, a window that could see unprecedented growth. As market leaders Bitcoin and Ethereum become increasingly expensive for the average investor, a strong argument is emerging that XRP currently offers a superior entry point, blending high potential with accessibility. This convergence of factors is positioning XRP as a token to watch, with many believing its next major bull run is not a matter of if, but when.
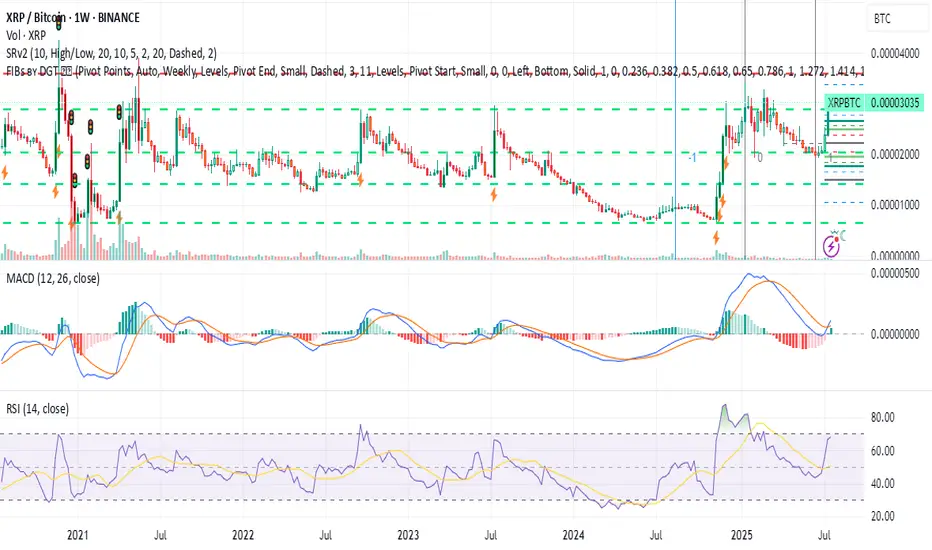
The Bitcoin Catalyst: Charting XRP's Trajectory to $10
A significant component of XRP's bullish outlook is directly tied to the performance of Bitcoin. The relationship between the two assets, often measured by the XRP/BTC trading pair, is showing signs of a historic shift. Technical analysis of the XRP/BTC monthly chart reveals that its price is coiling tightly just below a critical resistance level. A definitive monthly close above this threshold would represent a major technical breakout, signaling a powerful reversal of its long-term trend against Bitcoin. Such a move would be the first of its kind since 2018 and could unleash substantial upward momentum.
Should this breakout on the XRP/BTC chart materialize, technical projections indicate an initial move toward a higher valuation, with a primary target zone identified. If this rally in the trading pair coincides with Bitcoin’s price climbing to the projected $144,000 level, the math translates to a U.S. dollar valuation for XRP of between $6 and $10. The timing for such a move is projected for late 2025, assuming Bitcoin’s own bull run accelerates as anticipated.
The XRP/USD chart independently supports this constructive outlook. A recent weekly close above a key price level has flipped several long-term indicators to a bullish stance, generating a classic breakout signal. Using standard technical projection models, such as Fibonacci extensions, price objectives for XRP now stand at approximately $4.53, $6.31, and even as high as $9.22. The journey to these targets, however, remains heavily dependent on the broader market strength led by Bitcoin. A stall in Bitcoin's advance would likely moderate the upside potential for XRP.
The "Euphoria Phase": Why Late 2025 Could Be Explosive
Beyond its relationship with Bitcoin, XRP's own price chart is signaling immense latent potential. After trading within a defined range for years, the token is now exhibiting powerful bullish signals on its weekly chart, suggesting a breakout from a multi-year consolidation pattern is underway.
Several key technical indicators are aligning to confirm the start of a new, sustained uptrend. A clear bullish crossover on the weekly Moving Average Convergence Divergence (MACD) indicator—a trusted measure of market momentum—has already occurred. At the same time, the Relative Strength Index (RSI) is climbing steadily but has yet to enter the overbought territory that has historically marked the peak of major cycles. This indicates that there is still significant room for price appreciation before the rally becomes exhausted.
A critical psychological and technical price level now stands at $5. A firm weekly close above this mark would be a monumental event, likely triggering a wave of intense buying pressure and shifting market sentiment from simple optimism into full-blown euphoria. If this breakout is confirmed, the next macro price targets are projected to be in the $8 to $11 range, levels consistent with the price action seen in XRP's previous parabolic advances. Based on historical cycle patterns and the current technical structure, this explosive phase could unfold between August and October of 2025.
The Value Proposition: Why XRP Stands Out in a High-Priced Market
As Bitcoin and Ethereum command prices that put them out of reach for many new participants, a psychological barrier to entry has formed. It is in this environment that XRP’s unique market position becomes a powerful advantage. The investment case for XRP is straightforward and highly attractive to first-time crypto buyers who may be experiencing "sticker shock" from the market leaders.
With its high market capitalization and global recognition, combined with a low per-unit price, XRP presents an appealing proposition. This dynamic, often referred to as "unit bias," makes investors feel they are getting better value by being able to purchase a larger quantity of tokens. This behavioral pattern has historically driven significant retail inflows into assets perceived as more affordable.
This appeal is not merely psychological. XRP is underpinned by a clear and functional use case: facilitating fast, low-cost cross-border payments. The XRP Ledger’s ability to settle international transactions in seconds for a fraction of a penny provides a fundamental strength that distinguishes it from purely speculative assets. This utility, aimed at disrupting the enormous traditional finance market, offers a layer of long-term credibility. The broad distribution of XRP across millions of digital wallets highlights its widespread accessibility and deep retail base, a demographic that could be instrumental in fueling its next major run.
A Prudent Perspective
Despite the compelling bullish case, it is essential to approach these forecasts with a clear understanding of the risks involved. The cryptocurrency market is defined by its volatility, and price targets are speculative projections, not guarantees. XRP's path is still influenced by external factors, most notably the ongoing regulatory landscape, which could have a significant impact on its future.
Furthermore, the most optimistic scenarios for XRP are heavily reliant on Bitcoin maintaining its powerful upward trajectory. Any weakness in the flagship cryptocurrency would undoubtedly impact the entire altcoin market, including XRP. While the technical and fundamental outlook appears increasingly bright, a disciplined and well-researched approach remains the cornerstone of navigating this exciting but unpredictable market.
Aave proposal tolaunch centralized lending on Kraken’s Ink movesAave’s community overwhelmingly approved a proposal to license a centralized version of its lending protocol for deployment on Kraken’s Ink blockchain.
A proposal for the decentralized finance (DeFi) lending protocol Aave to launch a centralized version of its service on the crypto exchange Kraken’s Ink blockchain has received widespread approval among the community.
An Aave request for comment (ARFC) for the deployment of a whitelabel version of Aave v3 for the Ink Foundation, the organization behind the Ink blockchain, was approved with 99.8% of the votes cast in favor.
An ARFC acts as a preliminary offchain vote before proceeding with a full decentralized autonomous organization (DAO) vote. The next phase involves drafting an Aave improvement proposal (AIP) that will be voted onchain.
The ARFC states that “by granting a license to deploy a centralized version of the Aave (AAVE) codebase, Aave can expand its technology adoption while creating new revenue streams.”
Aave had not responded to a request for comment by publication time.
Kraken unveiled its Ink blockchain in late 2024, following an October announcement. The chain aims to serve as a compliant layer-2 platform for tokenized assets and institutional DeFi.
Aave eyes institutional lending market
The proposal states that the partnership could be “an opportunity for Aave to expand its influence in the institutional lending space,” creating additional revenue streams for the protocol.
The Aave DAO would receive a share “greater than or equal to the equivalent of a Reserve Factor of 5% based on borrow volume in all pools.” The Ink Foundation also committed funds to the development of the new protocol

ELLIOTT WAVE XAUUSD H4 update
EW Trade Set Up H4
monitoring the end of subminuette wave ii
subminuette wave ii is going to end in a double zigzag.
Waiting for an accumulation in the price range 3250/3315 before subminuette iii starts.
daily key levels (area)
3315
3275 POC
3250

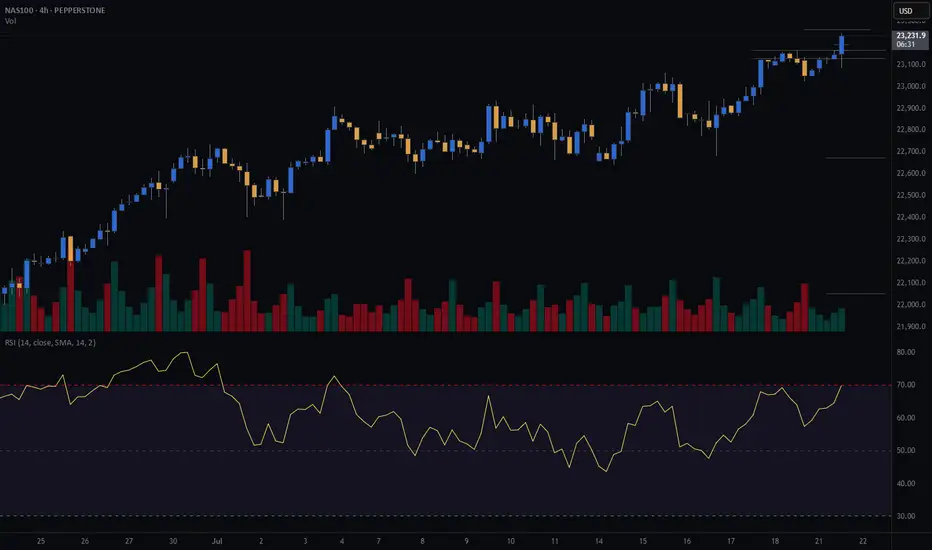
NASDAQ (CASH100) SHORT - Double TOP H4Risk/reward = 11.3
Entry price = 23 190
Stop loss price = 23 270.4
Take profit level 1 (50%) = 22 674
Take profit level 2 (50%) = 22 053
All variables met, and entered the trade.
What is everyone's thoughts on shorting or longing cash100?
BTCUSD - BEARISH DIVERGENCE DETECTEDCAPITALCOM:BTCUSD
BTCUSD has been in a bullish trend over the past few hours and is now approaching the resistance at 119,500.00.
On the hourly chart, a bearish hammer has formed alongside a stochastic divergence, signaling potential downside.
⚡ This signal is reinforced by a strong resistance level above, adding weight to a possible pullback scenario.
📉 If BTCUSD rebounds from this level, consider Sell setups with take profit at the nearest support.
📈 If it breaks out, look for Buy opportunities on confirmation.
⚡ We use Stoch (14) to spot potential reversals when it exits overbought or oversold zones — helping you catch clear, confident entries.

Bitcoin monthly RSI CYCLEEvery time Bitcoin peaked in previous cycles, its monthly RSI exceeded 90. In this cycle, the RSI hasn't surpassed 75, but I expect a breakout through 75 to at least 86 in the coming months.

3-Year Euro Uptrend — An Absurdity Amid a Weak EconomyCMCMARKETS:EURUSD
The euro is climbing, hitting its highest levels since late 2021 near $1.18. This surge is driven by diverging central bank policies—with the ECB holding rates steady while the Fed leans dovish—amid global tensions that push gold higher and rattle markets, weakening the dollar even though the eurozone economy remains fragile.
📉 1️⃣ Dollar Weakness Takes Center Stage
Since its January 2025 peak, the U.S. Dollar Index (DXY) has fallen by over 11% 📉—one of its worst starts in decades, comparable to the slumps of 1986 and 1989. As inflation cools, markets are betting on Fed rate cuts, pulling U.S. Treasury yields lower. Coupled with monetary policy divergence and tariff drama, the dollar’s usual safe-haven appeal is fading, even amid ongoing geopolitical tensions.
📊 2️⃣ Fed–ECB Policy Divergence
While the ECB has signaled the possibility of one or two cuts this year, markets are pricing in a milder path. By contrast, the Fed is tilting dovish, with swaps markets expecting a rate cut in September and another by December 🗓️. This widening yield differential supports EUR/USD, even though eurozone growth remains soft.
⚖️ 3️⃣ Trump Tariff Risks and Sentiment Shift
Uncertainty around U.S. trade policy—especially the threat of renewed tariffs—has weighed more heavily on USD sentiment than on eurozone currencies. Markets view these tariffs as inflationary and damaging to U.S. growth prospects. Speculative positioning data confirms record bearish sentiment on the dollar, with funds underweight USD for the first time in 20 years 💼.
💶 4️⃣ Eurozone’s Fiscal Shift
Germany has begun spending and borrowing, marking a dramatic pivot from years of fiscal restraint. This has raised hopes for an investment-driven recovery across the eurozone. Meanwhile, ECB President Christine Lagarde is avoiding signaling aggressive cuts, stabilizing market expectations and maintaining a sense of monetary calm—for now 🛡️.
🛡️ 5️⃣ Safe-Haven Flows Shifting
Traditionally, geopolitical stress boosts the USD as a safe haven. This cycle is different: investors are increasingly turning to gold, the Swiss franc, and the yen as defensive assets, indirectly supporting the euro. In April, when Trump delayed tariff plans, safe-haven USD flows unwound further, fueling euro gains 💰.
⚠️ Risks Ahead for EUR/USD:
💔 Weak Eurozone Fundamentals:
The eurozone economy is not booming. The IMF projects just 0.9% growth for 2025, with Germany, France, and Italy struggling to regain momentum. The ECB’s Financial Stability Review flags worsening credit conditions, weak private investment, and deteriorating balance sheets, none of which support sustained euro appreciation 📉.
🚢 A Strong Euro Hurts Exports:
Eurozone exporters in machinery, chemicals, and autos are already facing squeezed margins from rising input costs and global protectionism. A stronger euro makes exports less competitive, shrinking the eurozone’s current account surplus, which dropped sharply from €50.9 billion in March to €19.8 billion in April, according to the ECB 📊.
⚡ Political Risks Looming:
Fragile coalitions in Germany, budget battles in France, and rising anti-EU sentiment in Italy and the Netherlands could swiftly unwind euro gains if tensions escalate. Should the ECB turn dovish to support a weakening labor market, the euro’s rally could reverse quickly 🗳️.
📈 7️⃣ Technical Picture: Overextension Warning
In addition to the macro drivers, EUR/USD is now technically overextended. The pair has already retraced exactly 78.6% of its major bearish trend that started in January 2021 and ended in September of that year. Ahead lies a strong resistance zone at 1.18000–1.20000, which will be difficult to break without a significant catalyst.
Notably, the daily chart shows bearish RSI divergence, indicating fading momentum beneath the surface of this rally. A pullback toward the 1.13000 level would not be surprising, even as near-term momentum remains strong. This technical setup calls for caution while the pair tests these critical levels.
📈 Technical Outlook: EUR/USD Showing Signs of Overextension
Beyond macroeconomic factors, EUR/USD is currently technically overextended. The pair has retraced exactly 78.6% of its major bearish trend that began in January 2021 and concluded in September the same year. It is now approaching the upper boundary of a 3-year ascending channel, facing a significant resistance zone between 1.18000 and 1.20000—a hurdle unlikely to be crossed without a strong catalyst.
Additionally, the weekly chart reveals a bearish RSI divergence, signaling that underlying momentum is weakening despite the recent rally. Given this, a pullback toward the 1.13000 level is plausible, even as short-term momentum remains robust. This technical setup advises caution as the pair navigates these critical resistance levels.

Australia 200: Pullback Presents Second Chance for LongsThe Australia 200 contract continues to trade above former horizontal resistance at 8627, with Monday’s pullback offering an improved entry level for longs looking to buy the breakout.
Bullish positions could be established ahead of 8627, with a stop beneath for protection. The session high of 8727 looms as an initial test for longs, with a push above that level opening the door for further upside.
While some like to use extension targets, the preference would be to wait for a clear topping pattern before exiting the trade. Others may prefer to adopt a target based on the desired risk–reward of the trade.
Bullish price momentum is showing signs of picking up again, favouring a similar bias. Iron ore futures are also flying in Asia, likely assisting gains across the underlying materials sector.
Good luck!
DS

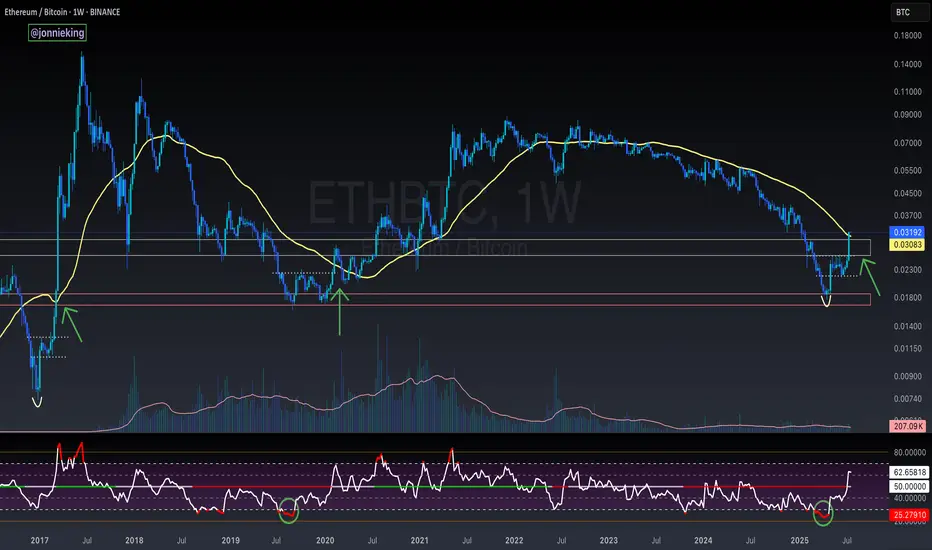
$ETH Closes Above the 50WMA - Alt Season Signal ALT SEASON ALERT 🚨
CRYPTOCAP:ETH Closed the Week ABOVE the 50WMA
Historically this has signaled the start of ALT SEASON.
*NOTE* 2020 had the pandemic hiccup.
This bottoming pattern looks very similar to the 2017 explosion.
Also the RSI matches the 2019 bottom.
Dare I call it yet bros? 🤓
**BTC/USDT Monthly Analysis: Navigating Key Resistance****Overview:**
On the monthly timeframe, Bitcoin (BTC) is exhibiting significant strength as it approaches a pivotal historical resistance zone. This multi-year resistance, ranging approximately from **$115,000 to $120,000**, represents a critical inflection point for the asset.
**Key Observations:**
1. **Historical Resistance Test:** The current price action sees BTC challenging a formidable resistance level that has previously acted as a major ceiling. A decisive breakout above this zone, supported by strong volume, would signal a continuation of the bullish trend towards new all-time highs.
2. **RSI Bearish Divergence:** A notable observation on the Monthly Relative Strength Index (RSI) is the presence of **bearish divergence**. While price has made higher highs, the RSI has printed lower highs, indicating a potential weakening in bullish momentum. This divergence suggests that the current upward move might be losing steam and could precede a healthy price correction or consolidation phase. This is a crucial cautionary signal for long-term holders and potential new entrants.
**Outlook:**
The bullish macro trend for Bitcoin remains intact, yet the confluence of strong historical resistance and a developing bearish divergence on the monthly RSI warrants caution. Traders should closely monitor for a clear break and sustained close above the $120,000 level to confirm further upside. Conversely, a rejection from this resistance zone could lead to a significant retracement to key support levels.
**Disclaimer:** This analysis is for informational purposes only and does not constitute financial advice. Always conduct your own research and manage your risk appropriately.
**M. Kiani**
```ش

$PLUG long waiting for price to reclaim the base supportAfter base support i'll long after confirmation and change of character, the rsi on weely has crossed the eq and all indicators confirm a reversal and uptrend.