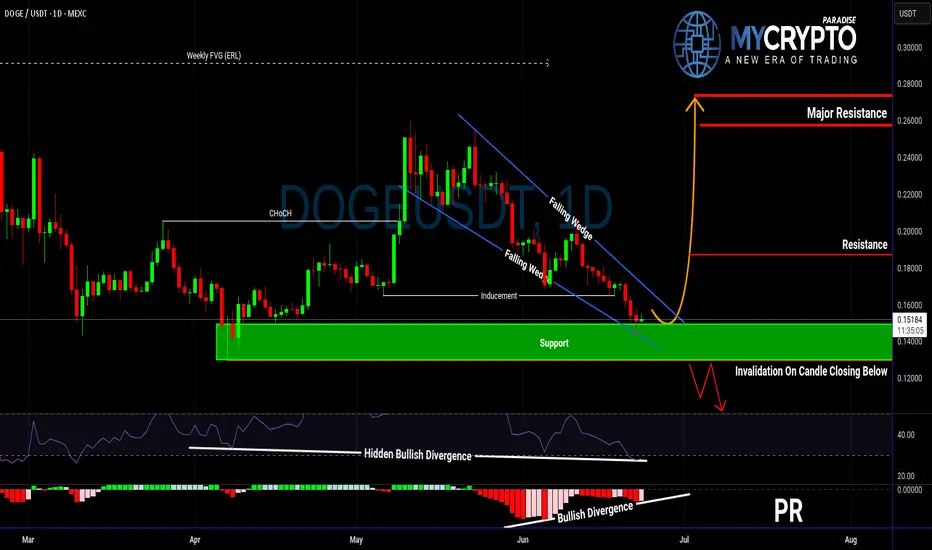
Is DOGE About to Explode or Collapse?Yello Paradisers! Are you ready for what could be DOGE’s most explosive move in weeks? DOGEUSDT is currently developing a very interesting bullish setup that deserves attention.
💎The pair has formed a falling wedge — a pattern that often precedes a breakout to the upside. This comes right after a confirmed bullish Change of Character (CHoCH), indicating that buyers are quietly stepping back in.
💎Even more important, we’ve seen a classic inducement grab, meaning early liquidity has been taken out, clearing the way for a potential real move. On top of that, there’s hidden bullish divergence on the RSI and clear bullish divergence on the MACD. This combination of signals significantly increases the probability of a bullish reversal from the current support zone.
💎If DOGE prints a convincing bullish candlestick pattern at these levels, it could offer a high-probability long opportunity with a strong risk-to-reward ratio. But be careful — if the price breaksdown and closes candle below this key support, the bullish scenario becomes invalid, and it’s better to wait for a more favorable structure to develop.
Strive for consistency, not quick profits. Treat the market as a businessman, not as a gambler. This is the only way you will make it far in your crypto trading journey. Be a PRO.
MyCryptoParadise
iFeel the success🌴
Oscillators
July 2025 - Duolingo trading opportunityGood news for Duolingo... The chart is now showing some promising signs that it might be ready to turn things around and head higher. Some simple clues why:
RSI resistance breakout:
The "RSI" indicator (bottom of chart) tells us strength is returning. A break of resistance that has been active over the last month is now no more. This usually means the buyers are taking control again.
Hidden strength:
Even though the price might look a bit sleepy, oscillators now print significant bullish divergence with price action.
Past resistance confirms support:
Certainly one of the most simplest concepts to take advantage of, previous resistance now confirms support. This test occurs as price action strikes the 50% Fibonacci level.
20% Forecast
Look left, previously market structure failed. Typically past breaks of structure shall be tested to confirm resistance, which is between 20-30% away.
Is it possible price action continues to print lower lows? Sure.
Is it probable? No.
Ww

Nike Looks Ready — A Smart Time to Consider InvestingOn the monthly chart, NIKE has been in a downtrend since November 2021, but the signs are pointing toward a potential trend reversal. Here's why I believe the bottom may already be in:
✅ MACD Histogram shows a strong positive divergence, signaling weakening bearish momentum.
✅ The RSI downtrend line has been broken and successfully retested, confirming bullish strength.
✅ A clear hammer candle has formed at a historical wide support zone, showing strong demand.
Now, price is facing three consecutive resistance levels — and with each breakout, the next zone becomes the new target, (87.5 → 102 → 122).
The structure suggests a step-by-step move higher if momentum holds. Keep an eye on the breakout above the descending trendline — that’s where things could accelerate.

GBP/USD – Bearish Shift Confirmed | Structure Breakout + AO DiveThe market just gave us a textbook setup on GBP/USD!
🔍 Analysis Overview:
A clear bearish divergence has formed between price and the AO (Awesome Oscillator), signaling potential trend exhaustion at the top.
We saw a rising wedge break to the downside, with a structure breakout confirming a shift in momentum.
Price decisively broke below the 1.36109 support level, indicating bearish control.
📊 Technical Confluence:
AO shows bearish divergence, confirming weakening bullish momentum.
Structure breakout from the wedge pattern aligns with AO signals.
Fibonacci retracement and extension levels give a clear target zone:
🎯 TP1 area: 1.35805 – 1.35895 (Fib 1.618–1.786 extensions)
⏳ What I'm Watching:
I'm now waiting for a pullback to retest the broken structure (possibly around the 0.382–0.618 Fib levels: 1.36242–1.36323). A bearish reaction here could provide a high-probability reentry opportunity.
💡Trade Idea Summary:
Bias: Bearish
Signal: Divergence + Structure Break
TP Zone: 1.35805 – 1.35895
Watch for: Pullback to retest broken structure before continuation
📈 Stay alert and manage your risk wisely!

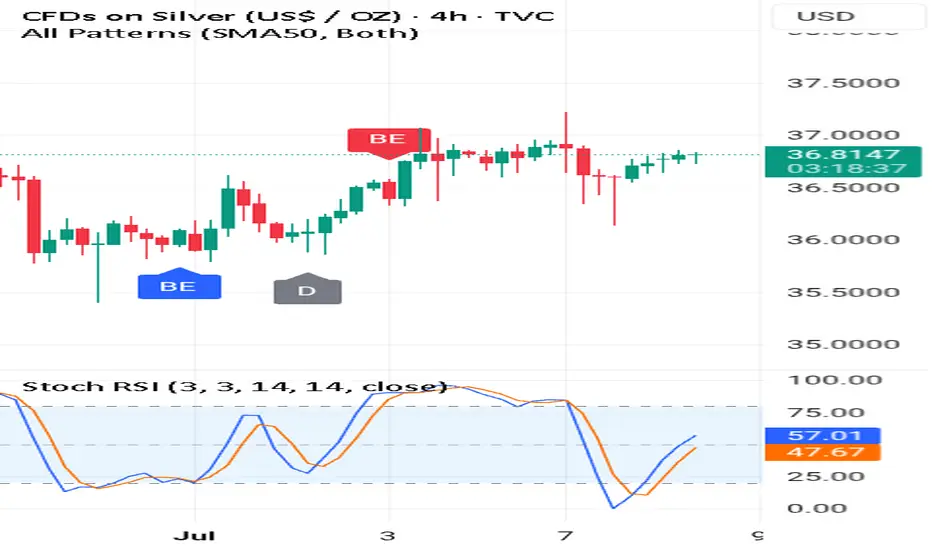
#1 Breaking News: Silver The Bullet Price Am listening to a podcast online this podcast mainly focusses on :
1-Gold
2-Silver
3-Mining Stocks
I always wondered what is it about these sectors that makes them "special"
Well I have recently mastered how to trade the double or triple tops.
And I can see why the experts in this commodity industry love double tops and triple tops.
Silver is hitting a top and has bounced from the neckline.
This is very important for you to understand.Also am using the 🚀 Rocket Booster strategy.
This strategy helps me pick the strength of the price trending.
It can also be used as a stop loss.This means you can use the moving averages for risk management.
Now I dont want you to worry too much about the technicals in this article but I just want us to have a conversation.
Sometimes technical analysis ca be boring but you will learn from conversations such as podcasts as well.
Rocket Boost This Content To Learn More.
Disclaimer ⚠️ Trading is risky please learn more about risk management and profit taking strategies and feel free to use a simulation trading account before you use real money.
How a Triple Breakout and Daily Reversal Signal Point to a 25%..How a Triple Breakout and Daily Reversal Signal Point to a 25% Bullish Opportunity on EURCAD
Introduction
A strong bullish signal has formed on the EURCAD currency pair, capturing the attention of traders using a combination of
breakout confirmation and daily chart reversal signals. With a clear confluence across the 4-hour, daily, and weekly timeframes,
this technical setup offers a well-supported case for a buy position with an estimated 25% upside, targeting the 1.6100 level.
Whether traded intraday or held for a few days, the structure of this trade offers exceptional technical clarity and reward
potential.
✅ Key Technical Highlights
🔹 4-Hour Breakout Confirmation
The EURCAD pair has broken decisively above a recent range high on the 4-hour chart. This breakout occurred on increased volume,
which validates the move as more than a false spike. Price action shows bullish momentum building as candles close strongly above
the 50-period EMA, indicating short-term strength.
🔹 Weekly Chart Breakout Structure
Zooming out, the weekly chart reveals that EURCAD has cleanly broken through a key resistance zone, which had previously
capped price several times. The breakout aligns with the long-term trend shift, reinforcing the bullish narrative from a macro
perspective. Support now sits firmly below at previous resistance.
🔹 Daily Chart Reversal Signal
The daily chart offers the most critical insight: a strong reversal pattern, potentially a bullish engulfing or morning star, has
formed near the breakout area. This suggests a change in sentiment and invites buying pressure as traders react to the clear
reversal signal after a recent pullback. This reversal provides
timing precision for the trade.
🎯 Take-Profit and Target Projection
The price target is placed at 1.6100, which corresponds to:
A previous structural high
A Fibonacci extension zone
A round psychological number respected historically
The move to this level offers a potential 25% profit window, depending on entry price and lot size. This makes it attractive for both day traders and short-term swing traders.
🕒 Trade Duration Outlook
While this breakout setup is forming across the weekly and daily charts, the 4-hour entry makes it highly suitable for day trading.
Traders who prefer intraday execution can look for a pullback to breakout support for entry, followed by momentum confirmation
from RSI or volume spikes.
Swing traders may hold the position over several days, aiming for the full stretch to the 1.6100 target, while trailing stops to lock in profits.
⚠️ Risk and News Awareness
Traders must remain cautious of:
Oil price movements, which directly impact CAD strength
Economic data from the Eurozone or Canada (GDP, employment, interest rate updates)
Central bank speeches that may introduce volatility
Risk should be limited by placing stop-loss orders just below the 4-hour breakout level or the low of the daily reversal candle.
📌 Why This EURCAD Setup Matters
This setup is more than just a breakout—it combines:
Multi-timeframe confirmation
Momentum breakout on the 4-hour chart
Weekly structure validation
Daily chart reversal timing
These factors build a strong technical case for bullish continuation and provide high confidence for experienced and new traders alike.
Conclusion
EURCAD presents a powerful trading opportunity backed by clear technical signals across major timeframes. With a 25% upside and
precise entry timing from a daily reversal pattern, this is the kind of setup traders seek for both fast profits and well-structured
trades. Whether approached as a day trade or a swing play, the EURCAD breakout is one to watch.
Disclaimer: This content is for educational and informational purposes only. It does not constitute financial advice or a
recommendation to buy or sell any financial instrument. Use a simulation trading account before you trade with real money and learn risk management and profit taking strategies.

Bitcoin - The ultimate breakdown for 2025/2026Welcome to my channel and this analysis. In this analysis I will dive deep in the current Bitcoin’s bullmarket. I will examine charts from the monthly, weekly, daily and 4H charts, and also on chain data. This will be a complete insight in Bitcoin’s price.
------------------------
Monthly timeframe
Logarithmic BTC chart
This chart presents a long-term logarithmic analysis of Bitcoin using monthly candles, covering the period from around 2013 to mid-2025. The structure is defined by two major curved lines representing a logarithmic resistance and support channel, which frames Bitcoin's price movement over more than a decade. These lines form a dynamic, upward-sloping price corridor, capturing Bitcoin's historically exponential price behavior and cyclical nature. The vertical axis uses a logarithmic scale to better reflect percentage-based changes, which is critical when analyzing an asset like Bitcoin that has grown from under $100 to over $100,000 in just a few years.
The chart displays clear multi-year cycles. The first notable cycle begins in 2013, followed by a significant correction in 2014–2015. A new bullish phase emerges between 2016 and 2018, peaking near $20,000. This is followed by a crash into 2018. A longer accumulation period precedes the 2020–2021 rally, which reaches a high around $69,000 before another sharp decline. From the bottom in late 2022 or early 2023, Bitcoin begins another uptrend, forming a steep rise along a newly established bullmarket support trendline. This trendline represents a more aggressive, linear support structure within the broader logarithmic curve, showing the strong momentum driving the current bull phase.
By July 2025, Bitcoin is trading around $108,000, advancing steadily toward the upper boundary of the long-term logarithmic resistance. A key element of this chart is the target level marked at approximately $150,000, which aligns closely with the point where the current trajectory intersects the upper logarithmic resistance. This zone has been highlighted as a likely area of interest, possibly signaling a market top or at least significant resistance, based on Bitcoin's past behavior. Historically, Bitcoin has tended to reverse sharply or consolidate after reaching this upper boundary, making the target zone an area of potential distribution or heightened volatility.
The bullmarket support trendline serves as a short- to medium-term structure within the larger logarithmic channel. As long as price holds above this line, the current bullish structure remains intact. A breakdown below this trendline could indicate a loss of momentum and trigger a broader correction.
The use of logarithmic trendlines underscores Bitcoin’s tendency to move in exponential growth cycles, shaped by macroeconomic trends, halving events, and adoption waves. The resistance and support boundaries function as dynamic guides for long-term expectations rather than rigid barriers.
The stoch RSI crosses
This chart provides a technical overview of Bitcoin on a monthly timeframe using candlestick analysis and the Stochastic RSI (Stoch RSI) oscillator to distinguish between bull and bear market phases. The Stochastic RSI, shown at the bottom of the chart, is a momentum oscillator derived from the RSI rather than price directly, making it particularly useful for identifying overbought and oversold conditions in trending markets. The key thresholds are the 80 level at the top and the 20 level at the bottom, which respectively indicate overbought and oversold zones.
The chart spans from 2017 to mid-2025, clearly separating bull and bear markets using vertical red lines and labeled annotations. Each major cycle aligns with movements in the Stoch RSI indicator. Notably, crosses above the 80 line (into overbought territory) are often associated with late-stage bull market tops or strong bullish continuations. Crosses below the 20 line (into oversold territory) typically align with bear market bottoms or the start of new accumulation phases.
Starting with the December 2017 peak, the Stoch RSI crossed above the 80 level, reaching extreme overbought territory. This cross occurred at the height of that bull cycle, signaling a likely exhaustion of momentum. Not long after this peak, the market entered a bear phase, confirmed by the downward cross of the Stoch RSI below the 80 level, and eventually below 20, leading into the 2018–2019 bear market.
By August 2019, the Stoch RSI crossed below the 20 level, signaling oversold conditions. Although this did not immediately launch a new bull market, it did suggest the market was bottoming out. This was followed by a gradual recovery and another decisive upward cross above 80 around April 2021, right in the midst of the strong 2020–2021 bull run. That cross confirmed the continuation of upward momentum and coincided with Bitcoin reaching new all-time highs.
As the price peaked in late 2021 and early 2022, the Stoch RSI again turned downward and dropped below the 20 threshold, marking another prolonged bear market. This downtrend was confirmed as the oscillator remained suppressed in the oversold zone for most of 2022.
The Stoch RSI is now moving again towards the overbought territory. This means that bulls have the control in the market and likely to push higher.
RSI with the consolidation and resistance trendline
This chart presents a broader monthly view of Bitcoin's price action alongside the Relative Strength Index (RSI), revealing a compelling structural alignment between price momentum and long-term resistance dynamics.
At the top of the chart, the candlestick pattern shows a clear upward trend spanning across multiple market cycles. A long-term resistance trendline has been drawn that connects the major highs from the two previous bull markets, specifically the peaks in late 2017 and late 2021. This resistance line acts as an upper boundary to the macro trend and, so far, the current price action in 2025 has not yet tested this long-term resistance. In fact, while Bitcoin has recently reached above $100,000, it remains below the ascending resistance trendline, suggesting that there could still be room for price to move higher before encountering the next major overhead challenge. The structure implies a potential upward continuation if momentum sustains, and the price may attempt to test this historical trendline in the near future.
Below the price chart, the RSI indicator offers additional insight into the underlying strength of this move. A descending RSI trendline connects the previous overbought peaks from 2017 and 2021, forming a macro resistance trendline in momentum that mirrors the structure seen in price. This declining RSI resistance has not yet been reached in the current cycle, implying that momentum still has space to grow before hitting a potential exhaustion point. The RSI is currently capped within a relatively tight consolidation box, with values fluctuating between the mid-60s and low-70s.
200W SMA crosses above the previous ATH
This chart illustrates the long-term price action of Bitcoin, focusing on the relationship between the 200-week simple moving average (SMA) and previous all-time highs (ATHs). Historically, when the 200-week SMA crosses above the previous cycle’s ATH, it has coincided with periods near the cycle tops. For example, in December 2017 and January 2022, the 200-week SMA moved above the prior ATH, which closely aligned with significant market peaks.
In the current cycle, however, the 200-week SMA has not yet crossed above the previous ATH from 2021, which is around $68,889.04. This is notable because, in past cycles, this crossover has typically marked the later stages of a bull run. The fact that this crossover has not yet occurred suggests that Bitcoin may still have room to move higher before reaching a new cycle top. However, it is important to recognize that this does not guarantee further upward movement. Even if Bitcoin’s price consolidates or moves sideways for an extended period, the 200-week SMA will gradually rise due to its lagging nature and could eventually cross above the previous ATH without a significant price rally.
Lets now move to the weekly charts and analyse where we are.
------------------------
Weekly timeframe
Support and resistance trendlines
This chart shows Bitcoin’s price action on a weekly timeframe, highlighting three key trendlines. Two resistance trendlines are drawn from the peaks of the last two major cycles, forming an upper boundary for price action. These lines act as potential resistance zones, indicating areas where previous rallies have topped out and where the current price could face selling pressure if it approaches these levels again.
Additionally, there is a clearly defined rising trendline that serves as bull market support. This trendline has been respected throughout the current cycle, connecting the higher lows since the market bottomed out in late 2022. As long as Bitcoin’s price continues to hold above this bull market support trendline, the overall bullish structure remains intact. This suggests that the uptrend is still healthy and that corrections or pullbacks, as long as they stay above this line, are part of a normal, sustainable bull market. If the price were to break below this support, it could signal a shift in market sentiment and potentially a deeper correction. For now, maintaining support on this trendline is a positive sign for the ongoing bull market.
Bearish divergence
The chart shows that Bitcoin has formed three consecutive price peaks, with each new high surpassing the previous one. This indicates that, from a price perspective, the market has maintained its upward momentum over this period. However, when looking at the Relative Strength Index (RSI) below the price chart, a different pattern emerges. Each time the price has made a new high, the RSI has registered a lower high, resulting in a clear bearish divergence. This is visually reinforced by the downsloping trendline that can be drawn across the RSI highs, in contrast to the uptrend in price.
Bearish divergence between price and RSI, as seen here, often signals underlying weakness in the buying momentum, even as price continues to rise. It suggests that each successive rally is being driven by less enthusiasm or participation from buyers. Given this setup, it is possible that the RSI could revisit the downsloping trendline in the near future. If this occurs, the price might make a marginally higher high, potentially forming a third peak slightly above the current level. This would maintain the divergence and could act as a warning sign for traders to be cautious about the sustainability of the current uptrend.
Stoch RSI
This chart presents the weekly price action of Bitcoin alongside the Stochastic RSI indicator. What stands out is the clear cyclical pattern in the Stoch RSI, where it tends to reach oversold levels roughly once every half year. These oversold readings have historically aligned with significant local bottoms in the price, signaling favorable buying opportunities for traders and investors. After reaching these low points, the Stoch RSI typically trends upward, eventually entering the overbought zone.
When the Stoch RSI enters overbought territory, as it does several times on this chart, it often coincides with local price peaks. These moments serve as warnings that the market may be overheated in the short term, and traders should be cautious about opening new long positions. The overbought readings suggest that a pullback or period of consolidation could be imminent, as the market works off excess bullish momentum.
Currently, the Stoch RSI is once again in the overbought zone. This suggests that Bitcoin may be vulnerable to a further pullback or at least a pause in its upward movement. While this does not guarantee an immediate reversal, it does mean that risk is elevated.
Failed breakout/liquidity grab
This weekly Bitcoin chart illustrates a strong and consistent uptrend that has been developing since late 2023. Each major move begins with a clear breakout above previous consolidation zones, followed by a retest of the broken resistance, which then acts as support, confirming the trend's strength. These retests tend to hold well, setting up for new bullish impulses.
In the earlier stages, we see BTC breaking out of a range around the $48,851 support level. After a successful retest of that zone, the price surged and entered a new consolidation phase just below $73,643. A second breakout occurred from this level, again followed by a retest that confirmed it as a new support level. This pattern reflects textbook bullish market structure: breakout, retest, and continuation.
However, the current price action shows something different. BTC has returned to its previous high around the $109,301 resistance level. Unlike the previous times, where strong bullish candles closed above resistance, this attempt has only pierced above the level with a wick, indicating potential exhaustion or hesitation. The highlighted label "Failed breakouts / Liquidity grab" suggests that these wick movements may have been attempts to trigger stop orders and gather liquidity before a possible retracement.
Now we will dive deep into the daily timeframe.
------------------------
Daily timeframe
Resistance, bullflag and Stoch RSI
This daily chart of Bitcoin reveals a period of consolidation just below a key resistance zone, which aligns with the previous all-time high area. BTC has been ranging within this red-marked resistance block, showing clear hesitation from buyers to push beyond it with conviction.
During this consolidation, a well-formed bull flag structure appeared, a bullish continuation pattern, signaling potential for further upside. The breakout from this bull flag occurred earlier this week, providing initial bullish confirmation as price pushed briefly above the upper boundary of the flag. However, the breakout lacked follow-through. Instead of sustaining momentum and closing decisively above resistance, BTC appears to have experienced a fake-out, with price now retracing back inside the prior range.
This failed breakout is particularly notable given the context of the Stochastic RSI indicator, which is currently in the overbought zone.
------------------------
4H timeframe
4H FVG and liquidity grab
This 4-hour chart of Bitcoin shows a clear structure where price has recently formed an equal high around the $110,612 level. Equal highs are often seen as zones where liquidity builds up, since many stop-loss orders from short positions typically rest just above them. This makes the area particularly attractive for a potential liquidity grab.
At the moment, BTC appears to be in a short-term retracement phase after rejecting from this equal high region. During this move, price left behind a bullish Fair Value Gap (FVG), which is a zone of inefficiency where price moved too quickly to fill orders. This FVG is now acting as a potential support zone. The chart suggests that BTC may revisit this FVG to rebalance before making another attempt to break through the equal highs.
If BTC can hold the FVG and generate upward momentum, a move above the equal highs becomes more likely. In that case, the resting liquidity just above those highs could be targeted, leading to a quick wick or breakout move before price potentially reverses again.
------------------------
Liquidation heatmap
1 month
This Binance BTC/USDT liquidation heatmap clearly shows that the majority of the liquidity is stacked to the upside. The bright yellow and green bands, which represent areas of high liquidation potential and leverage exposure, are heavily concentrated just above the current price levels, especially around the $111,000 to $114,000 zone. This indicates that many traders have short positions with stop-losses placed above these highs, making them prime targets for potential liquidation events.
As price moves closer to these high-liquidity zones, the probability increases that market participants, particularly larger players or algorithms, may push BTC upwards to trigger those stops and liquidate those positions.
1 week
The current price is hovering around the $108,000 range, with clear liquidity clusters forming both below and above this level. What stands out is the dense liquidation zone just below the current price, this suggests that many traders have placed long positions with stop-losses slightly under this support range. These positions create an opportunity for a liquidity sweep, where price briefly dips down to trigger liquidations, fill larger buy orders, and shake out weaker hands.
After such a sweep, the heatmap shows an even larger cluster of liquidation liquidity sitting just above the highs, especially around the $110,000 to $114,000 region. This is likely composed of stop-losses from short positions and breakout traders who entered too early. The concentration of liquidity here creates a strong incentive for price to target this zone after clearing the downside liquidity.
------------------------
Fear and greed index
Today
The Fear and greed today is at 66, meaning greed. This level suggests that market sentiment is optimistic, but not yet euphoric or irrational. In practice, it often means buyers are confident, and there’s still room for price continuation before we enter extreme greed territory
1 year chart
This chart displays the Crypto Fear & Greed Index over time, offering a visual representation of sentiment cycles in the Bitcoin market.
When examining the past year, you can see how sentiment has recovered significantly from the fear zone (below 30), especially from late 2024 into early 2025. This shift in sentiment aligned with BTC's price climbing back toward previous highs, indicating that sentiment is responding directly to price structure and bullish momentum.
------------------------
BTC exchange reserve
This chart, sourced from CryptoQuant, provides a clear visualization of the relationship between Bitcoin’s exchange reserves (blue line) and BTC price (white line), over a multi-year period. The key insight is the rapid and consistent decline in Bitcoin held on exchanges, especially noticeable from mid-2023 onward.
From around 2022, the amount of BTC on exchanges remained relatively stable. However, beginning in late 2022 and accelerating through 2023 into 2025, we see a shart and uninterrupted drop in exchange reserves.
This ongoing withdrawal trend typically signals accumulation behavior by investors. When BTC is withdrawn from exchanges and moved into cold storage or long-term wallets, it often reflects growing conviction among holders that price will rise and they don’t intend to sell in the short term.
------------------------
Final thoughts
This is a complete Bitcoin analysis for the community with a top-down analysis!
I have worked out a complete insight in the Bitcoin price with different analysis and on-chain data.
I would be excited if you boost, comment and share the analysis with your friends for the work that I have put in this analysis for everyone.

BTC in DistributionHi everyone. I am going to be moving my trading commentary back to Ideas rather than Minds so I can stay focused during the day, as well as having the added benefit of retrospective analysis. I do not trade BTC but have been tracking the price recently and believe it is gearing up for a big move. The current structure supports a bearish bias based on the Wyckoff Distribution pattern, which the price has been following in a textbook fashion. If this pattern continues, I believe Bitcoin will enter a bearish trend.
For the indexes I will try to post ideas for a bullish and bearish bias but for this quick post on Bitcoin, I am going to stick to the bear side.
Using Renko (Traditional, $500 window size) as my main chart, you can see the price broke out of a strong uptrend after the peak on May 22 (Buying Climax) and entered a potential distribution pattern. The secondary test (ST) set the lower band of the resistance zone, which the price has been testing and rejecting up until this point.
The labels are subjective but what we can confirm is that the price has broken through the bottom range (Sign of Weakness or Spring) but has been unable to break through the top of the range. An upthrust/false breakout above the top of the range would be a key level to go short, as this would take out the last remaining buyers, however the price continuing to stay below the resistance could be a sign of persistent weakness.
A rejection here would suggest that we are in Phase C, which is where momentum will build up on the sell side, eventually pushing the price through the bottom of the range and into a bearish trend.
Since Renko is the smoothest chart, I am also using range bars (less smooth) and standard candle sticks (most noise) to analyze closer setups.
On the range chart (20000R or $200), the price looks to be in an inverse cup and handle pattern, which if it holds would support the idea that we are in Phase C of the distribution pattern and the price will fail to break above the range again. Volume indicates that there is low interest at the upper levels, which resulted in the price moving down in Friday. We could see another push down after another period of low interest at the upper level.
Lastly, the 1h candle chart shows that the price has been relatively flat since June 25th and is being supported by a large volume node on the Volume Profile. There was large buying volume at the lower level, so if the price can stay above this node (~$106,700) there is a good chance that it will get pushed above the range, however if sellers are able to push it through this level of high volume, further downside could follow. This is why I would suggest waiting to see if this level holds before entering a trade. A false upside breakout (above $112,000) would be a safe area to go short, as it would be a quality setup with good risk/reward.
If the price is in Phase C and cannot break above the range, it would be a less ideal short setup, as the market could make a push to the top of the range at any time to clear out buyers. If this were to happen, I would prefer to wait for more confirmation.
To conclude, my idea here is:
Short (Solid Line): False breakout above $112,000 (preferred) or below $107,000 (higher risk)
Long (Dotted Lines): True breakout above $112,000 (preferred) or reversal $103,000-$98,000 (higher risk)
Thank you for reading and let me know what you think. More ideas to come.

GBPAUD M15 - Bearish Setup Based on Divergence & Structure Break📉 GBPAUD M15 - Bearish Setup Based on Divergence & Structure Break 📉
Pair: GBPAUD
Timeframe: 15M
Strategy: Wave Analysis + Supply Zone + AO Divergence + Structure Break
⸻
🔍 Market Overview:
The current price action on GBP/AUD M15 reveals a 5-wave impulsive structure with clear signs of exhaustion at the top. Price recently tapped into a well-defined supply zone (2.08858 - 2.08710), showing bearish divergence on the Awesome Oscillator (AO) between Wave 3 and Wave 5, signaling potential reversal.
⸻
📌 Key Confluences for the Sell Setup:
1️⃣ Supply Zone (2.08858 - 2.08710):
Price has entered a strong area of previous rejection. Watch how price reacts here.
2️⃣ Bearish Divergence (AO):
• AO Histogram shows lower highs while price makes higher highs between Wave 3 and Wave 5.
• This is a classic bearish divergence—a potential early sign of trend reversal or deeper correction.
3️⃣ Break of Structure (2.08658):
A clean break below the minor structure support at 2.08658 will confirm weakness in bullish momentum and open the door for short opportunities.
4️⃣ Entry Confirmation:
• Wait for a clear M15 bearish candle close below 2.08658.
• Ideal confirmation would be a break-retest scenario, or a rejection wick back into the supply zone followed by bearish continuation.
⸻
🔽 Trade Plan (Sell Bias):
Entry Trigger: Break of 2.08658 structure
SL (Stop Loss): Above 2.08858 (Above Supply Zone / Wave 5 high)
TP1: 2.08250 (Recent minor support)
TP2: 2.07800 (Deeper correction area)
TP3: 2.07500 (Previous demand zone)
⸻
⚠️ Risk Management & Notes:
• Risk-reward ratio: Aim for at least 1:2 to 1:3 depending on entry.
• Avoid premature entries before structure is broken.
• Be cautious of news impact around AUD/GBP (as marked on chart).
⸻
📎 Conclusion:
A clean divergence setup has formed near a supply zone, with signs of bullish momentum fading. If structure breaks, this could be a high-probability short setup. Always wait for confirmation and manage risk properly.
⸻
💬 Feel free to like, comment, or share your views below. Good luck and safe trading! 🚀
#GBPAUD #PriceAction #WaveAnalysis #SupplyZone #Divergence #AO #BearishSetup #StructureBreak #ForexAnalysis #M15Setup #TradingView

7/3/25 - NOAH: new SELL mechanical trading signal.7/3/25 - NOAH: new SELL signal chosen by a rules based, mechanical trading system.
NOAH - SELL SHORT
Stop Loss @ 12.59
Entry SELL SHORT @ 11.25
Target Profit @ 9.13
Analysis:
Higher timeframe: Prices have stayed below the upper channel line of the ATR (Average True Range) Keltner Channel and reversed.
Higher timeframe: Victor Sperandeo's (Trader Vic) classic 1-2-3/2B SELL pattern...where the current highest top breakout price is less or only slightly peaking higher than the preceding top price.

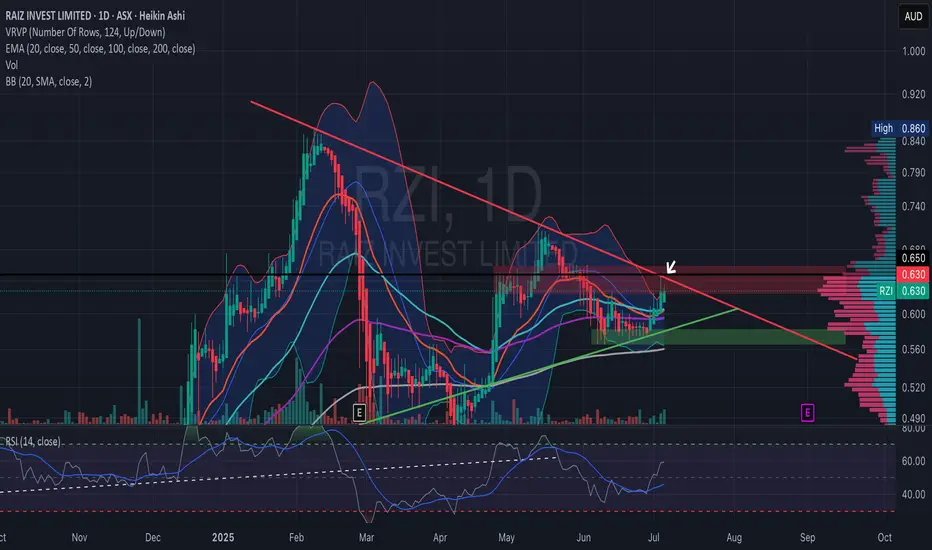
RZI Bullish BreakoutThe price is currently testing resistance around 0.63, after rising from 0.575. The volume profile indicates high activity around 0.58-0.62, showing strong interest.
The EMAs reflect a bullish shift, with the 20 EMA approaching a crossover above the 50 EMA.
After a period of squeeze inside the triangle, the bands are beginning to open.
The RSI is neutral to bullish, trending upward around 50. Overall, the chart suggests a potential breakout. No clear over-bought yet, there is room to run if bulls stay in control.
Key Scenarios
Bullish Breakout: A daily close above the red trendline + A$0.63–0.65 resistance zone would confirm.
First target: A$0.70–0.72 (next volume-profile “valley” and previous swing highs)
Secondary: A$0.80+ (upper Bollinger band confluence from the Feb top)
False Break / Rejection:
Look for a swift pullback into the green ascending line (~A$0.60) or the broader support box around A$0.57–0.58.
Watch EMAs for signs of rolling over (20 EMA crossing back below 50 EMA would turn neutral-to-bearish).
PORTALUSDT.P 4H SHORTPrice is currently heading towards resistance trendline and horizontal resistance zone @ 0.04372. Expecting bearish reaction on resistance trend line third touch. A strong bearish engulfing pattern will signal this reversal to at least 0.03604.

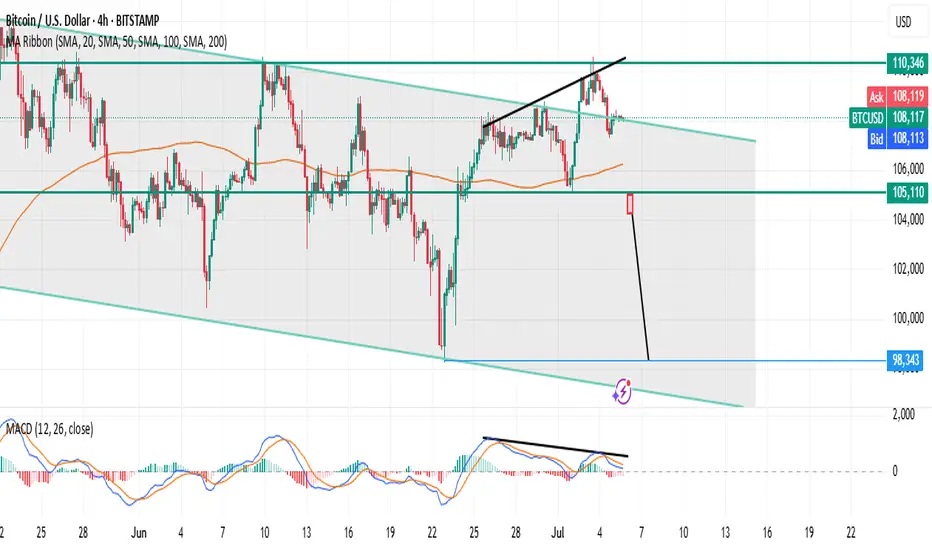
BTC/USD (4H): Classic FRL short setup unfoldingTrading = capital management under uncertainty.
Bitcoin is trading inside a clear descending channel on H4.
Price recently tested the upper boundary of this channel while forming a bearish divergence on MACD. This divergence hints at a weakening upward phase, signaling a possible phase shift according to Fractal Reversal Law (FRL).
Why is this a classic FRL setup?
✅ Phase Identification:
The prior local upward phase within the descending channel is weakening.
✅ Reversal Pattern:
A double top / wedge has formed at the upper boundary with a bearish divergence.
✅ Neckline:
The neckline aligns with the MA100 cluster on H4, now acting as a horizontal rubicon.
✅ Confirmation:
We wait for a full candle close below the neckline on H4 to confirm the phase shift.
✅ Targets:
– TP1: Mid-channel grey zone.
– TP2: Lower boundary of the channel.
✅ Stop:
Above the recent highs or channel top, depending on your risk management.
Plan:
Wait for H4 close below neckline → enter short.
Use the channel structure for target planning.
Manage risk with a tight, structure-based stop.
This is a clean FRL textbook scenario:
Phase → Pattern → Neckline → Confirmation → Target.
It aligns with the larger market structure, using the combination of price action, divergence, and structure clarity to guide your trade decisions.
Why FPT?Starting first looking at what the company is doing.
AI
The buzz word of most news headlines.
$200 Million Investment: FPT has committed to a landmark $200 million investment to build an AI Factory in partnership with global chip giant NVIDIA. The goal is to create a complete ecosystem for AI development, offering not just the raw computing power (GPU infrastructure) but also the software platforms (FPT AI Studio) and expert consulting needed to build and deploy AI solutions.
This one ties AI and chips together:
University Collaboration: FPT University is a strategic asset. They are working directly with NVIDIA and other institutions like the VNU University of Technology to incorporate AI into their curriculum, aiming to help train the 30,000 to 50,000 AI and semiconductor engineers Vietnam needs by 2030.
Chips
FPT is targeting the design aspect of making chips and there is a lot of international demand to cut into China's monopoly. FPT being in Vietnam is already in a strategically significant area. Samsung is Vietnam's single largest foreign investor and happens to be able to fabricate chips. They also have multiple existing partnerships with FPT and are no strangers to working together. Compute is hottest commodity of the modern age. Though compute is the final product I'll go over how we get there.
First stage mine it
Vietnam has an estimated 3.5 million metric tons Rare Earth Reserves. The world's sixth largest reserves. The key challenge is converting this immense potential into actual production and processed materials. In 2024 Vietnam produced 300 metric ton. So there is a lot of room to grow.
Why this matters:
This national ambition is backed by a new, aggressive legal framework. Key policies like Resolution 10-NQ/TW and the new Law on Geology and Minerals (effective July 1, 2025) mandate that raw ores must be processed in-country and explicitly push for Vietnamese companies and their partners to lead the charge. This strategy aims to prevent the export of raw minerals and build a complete high-value supply chain within Vietnam.
While FPT is not a mining company, these laws are designed to create a stable domestic supply of processed rare earths and high-value materials. This is a critical long-term advantage for a company like FPT aiming to build a world-class semiconductor design center, as it ensures future access to a secure, local supply chain.
Stage 2 is processing
Multiple countries are working on doing this. It's very complicated and the struggle seems to be making in cost effective outside of China.
Stage 3 Design
Conceptualizing the chip's architecture. (Fabless companies like NVIDIA do this). This is precisely the high-value role FPT is targeting.
Stage 4 Fabrication
This is mostly TSMC and Samsung. It's why Taiwan and chips is so related. Also worth mentioning Samsung not do fabrication in Vietnam. It does it in South Korea.
Stage 5 Assembly, Test, and Packaging (ATP)
Cutting the finished wafers into individual chips, assembling them into protective packages, and testing them to ensure they work. Companies like Intel and Samsung already do this in Vietnam.
Telecommunications Segment
While its growth is more modest (around +11.3% in 2024), it is highly profitable and provides consistent, predictable cash flow that helps fund the high-growth initiatives in the Technology segment.
Education & Other Investments
The education section has 1 simple con and that's birthrates in Vietnam. Currently below the replacement rate but effort is being made to change that. Other then that it's all good news. Over the last 50 years Vietnam has gone from it being common to have some elementary school education but no high school or university or English. To pumping out highly educated English and Vietnamese speaking students ready to take on global competition. This factory of new skilled workers means both proud parents and a nation about to steal the spotlight on a global stage. Vietnam while a small country by land mass makes up for it in a population of 100 million and a relentless work ethic. It's the definition of hard times make strong people and strong people make good times. The good times are coming. Why this matters to FPT Education? Good education costs money but it also makes $$$. With this new labor force they will be able to afford great education for the next generation. What else? Well when you got great education other people will use it. Looking forward, as Vietnam solidifies its status as a stable, high-tech hub, it's plausible that its top-tier educational institutions, like FPT University, will attract foreign students, creating an entirely new, high-margin revenue stream that is likely not on most investors' radar today.
Price Chart
Price is sitting on the weekly 8 SMA. Waiting for a move above 122000 VND this is the next FIB retracement level. Right now we have a possible low at 106000 VND and possible higher low at 115000 VND . Stoploss at 110 000 VND means that upside potential is way bigger then the downside risk. To be clear the stoploss can't be at 114900 while this might work with low volatility stocks on larger US exchanges. The risk of getting wicked out of a position here on HOSE is way different. My optimistic target right now would be 190 000 VND and FIB retracement projection is 192 500 VND. Most likely I'll take profit before that.
MACD cross
MACD is still bearish there is a chance of a cross in the next few weeks.
Daily saw a nice move up. It's also very close to attempting a cross up. It's bearish but allows for an asymmetric trade when down side stop loss can be small. While upside can be huge. Lose small and win big. I opted for tight stoploss rather then waiting for signals to all line up. Some people might be less aggressive but not waiting here is about identifying in the price favorable conditions for minimal downside. Meaning it's clear where the position become invalid.
RSI
The daily RSI has a really nice double bottom. To me this increases the likelihood of a reversal substantially.
Stoch RSI
With Stochastic RSI continuing to move up we should know soon if this position is correct of not.
Disclaimer:
The information provided in this post is for educational and informational purposes only. It does not constitute financial advice, investment recommendations, or a solicitation to buy or sell any financial instruments. All investments involve risk, and the past performance of a security, market, or trading strategy does not guarantee future results. I am not a financial advisor. Please conduct your own thorough research and consult with a qualified financial professional before making any investment decisions. You are solely responsible for any investment decisions you make.

Strong multimonth breakout BPCLThe oil major company witnessed a consolidation breakout and closed at multimonth highs on weekly scale ..
volumes are healthy
rsi very strong
stock above key ema areas .

Bitcoin Wave Analysis – 4 July 2025- Bitcoin reversed from long-term resistance level 110000.00
- Likely to fall to support level 105000.00
Bitcoin cryptocurrency recently reversed down from the major long-term resistance level 110000.00 (which has been steadily reversing the price from the start of this year, as can be seen below) – intersecting with the upper daily Bollinger Band.
The downward reversal from the resistance level 110000.00 stopped the previous medium-term impulse wave (3) from the start of June.
Given the strength of the resistance level 110000.00 and the overbought daily Stochastic, Bitcoin cryptocurrency pair can be expected to fall to the next support level 105000.00 (low of the previous correction (2)).

AAVE Breakdown Could Trigger Major DropYello Paradisers — did you spot the bearish setup forming on AAVEUSDT? If not, you might already be a step behind, but there’s still a high-risk-reward opportunity on the table — if you approach it with discipline.
💎Currently, AAVEUSDT is looking increasingly bearish. The asset has confirmed a bearish Change of Character (CHoCH), broken down from a rising wedge pattern, and is showing clear bearish divergence on the chart. These combined signals suggest that the probability of further downside is increasing.
💎From here, there are two main scenarios we’re monitoring. First, AAVE could attempt a pullback to fill the Fair Value Gap (FVG) above, which would offer a clean short-entry zone with strong risk-reward potential. Alternatively, price could reject directly from the nearby Bearish Order Block (OB), offering another chance for well-structured entries. Both setups depend on confirmation and timing, so patience is key.
💎However, if AAVE breaks and closes decisively above the current resistance zone, the bearish thesis becomes invalid. In that case, the best move is to wait on the sidelines and allow new, higher-quality price action to form before re-engaging.
💎This market demands patience and discipline. You don’t need to catch every move — just the right ones. Stay sharp, stay focused, and let the market come to you.
Strive for consistency, not quick profits. Treat the market as a businessman, not as a gambler.
MyCryptoParadise
iFeel the success🌴

EURCAD Wave Analysis – 3 July 2025- EURCAD reversed from resistance zone
- Likely to fall to support level 1.5800
EURCAD currency pair recently reversed down from the major resistance zone located between the strong resistance level 1.6150 (former yearly high from 2018) and the resistance level 1.5965 (former Double Top from 2020).
The downward reversal from this resistance zone stopped the previous impulse waves 5 and (3).
Given the strength of the resistance level 1.6150 and the bearish divergence on the weekly Stochastic indicator, EURCAD currency pair can be expected to fall further to the next support level 1.5800.

Mastering the RSI - How to use it in trading?What will be discussed?
- What is the RSI?
- RSI overbought
- RSI oversold
- RSI divergences
- How to use the RSI
- How to trade with the RSI
What is the RSI?
The Relative Strength Index (RSI) is a popular momentum oscillator used in technical analysis to measure the speed and change of price movements. Developed by J. Welles Wilder Jr., it ranges from 0 to 100 and helps traders evaluate whether a security is overbought or oversold. The RSI typically uses a 14-period timeframe and is calculated based on the average gains and losses over that period. A rising RSI suggests increasing buying momentum, while a falling RSI indicates growing selling pressure.
RSI overbought
When the RSI rises above 70, the asset is generally considered overbought. This condition indicates that the price may have risen too quickly and could be due for a correction or pullback. However, being overbought doesn't automatically mean a reversal will occur, it signals that bullish momentum is strong, and traders should be cautious of potential trend exhaustion.
RSI oversold
Conversely, an RSI reading below 30 is typically seen as a sign that the asset is oversold. This condition suggests the price may have fallen too sharply and could be primed for a rebound. Just like with the overbought condition, an oversold RSI doesn’t guarantee an immediate reversal but serves as a warning that bearish momentum may be overextended.
RSI divergences
Divergences occur when the RSI and the price of the asset move in opposite directions. A bullish divergence happens when the price makes a lower low, but the RSI forms a higher low, potentially signaling a reversal to the upside. A bearish divergence occurs when the price makes a higher high, but the RSI creates a lower high, possibly indicating a downward reversal. Divergences are often used to spot early signs of trend changes.
How to use the RSI?
To use the RSI effectively, traders typically look for overbought and oversold conditions to time entries and exits, combine it with other technical indicators for confirmation, and watch for divergences as a sign of potential reversals. RSI can also be adapted for different timeframes or strategies, depending on whether the trader is looking for short-term swings or long-term trend analysis. While it’s a powerful tool, RSI should not be used in isolation, it works best as part of a broader trading plan that considers market context and risk management.
How to trade with the RSI?
The RSI can be a powerful tool for identifying potential trade setups. When the price approaches a key support zone while the RSI remains in overbought territory, this may signal an early warning of a possible market reversal. However, rather than acting immediately, it's wise to wait for confirmation. A clear candlestick reversal pattern, such as a bullish engulfing candle or a pin bar, a provide stronger evidence that momentum is shifting. By combining RSI readings with price action and support levels, traders can improve the accuracy and timing of their entries.
Disclosure: I am part of Trade Nation's Influencer program and receive a monthly fee for using their TradingView charts in my analysis.
Thanks for your support.
- Make sure to follow me so you don't miss out on the next analysis!
- Drop a like and leave a comment!

CLX Clean-Up RallyClorox NYSE:CLX is rebounding from the $117 swing low on rising volume.
Fibonacci measured from the Jul-’24 high ($171.37) to that low shows the 50 % retrace at $144.36 .
A nine-wave corrective drop has completed, and the daily RSI crossover mirrors the two prior bottoms highlighted on the chart.
Confluence to the upside
Bullish RSI divergence off the 30-line
Price back above the 9-EMA ribbon: targets 23.6 % ($130.10), 38.2 % ($137.99), 50 % ($144.36)
200-DMA ≈ $150 — often acts as a magnet once 50 % breaks
Street context
Consensus 12-mo target sits around $150–152 (FactSet), with the high at $165 and low at $130 .
Short interest ≈ 3 % of float—no squeeze fuel, but little overhead supply until the $140s.
Next catalyst: FY-Q4 earnings – guidance indicates week of Jul 29 to Aug 2 (date TBD); options price an implied ±4 % move.
Trade Setup
Entry zone: $123–126
Primary target: $144 (50 % fib).
Secondary target: $149–150 200-DMA / analyst mean.
Invalidation: Daily close back below $118.
NOT FINANCIAL ADVICE! Always manage risk!

CAD/CHF 4H Reversal Setup – Stoch RSI Signals Exhaustion CAD/CHF 4H Reversal Setup – Stoch RSI Signals Exhaustion 📉📈
Pair: CAD/CHF
Timeframe: 4H
Date: July 3, 2025
---
Market Overview
The CAD/CHF pair remains in a strong downtrend. Price is trading below both the 50 EMA and 200 MA, which are sloping downward. This confirms bearish momentum. After a small bullish bounce, the pair is testing the dynamic resistance zone formed by the 50 EMA.
---
Indicator Confluence
Stochastic RSI (3,3,14) is deep in the overbought zone (above 94), suggesting bullish momentum may be fading.
Price has failed to break above the 50 EMA (0.58564), which could serve as a resistance barrier.
EMA and MA crossover shows 50 EMA remains below the 200 MA, confirming the dominant trend is bearish.
---
Trade Idea: Short Setup
Entry Zone: 0.58240 – 0.58300 (wait for bearish confirmation candle)
Stop Loss: Above 0.58600 (just beyond the 50 EMA)
Take Profit Targets:
TP1: 0.57200 (recent swing low)
TP2: 0.56000 (next support zone)
---
Strategy Logic
This is a trend-continuation reversal entry, catching the top of a pullback within a bearish structure. The Stochastic RSI overbought condition, combined with resistance at the 50 EMA and overall trend alignment, makes this setup attractive for swing or intraday short trades.
---
Risk Disclaimer
This idea is for educational purposes only. Always apply proper risk management and confirm setups with your trading plan.
---
If you found this helpful, feel free to like, comment, or share your thoughts below. Are you short on CAD/CHF too?
\#CADCHF #Forex #TradingView #StochasticRSI #BearishReversal #EMA #4HSetup #ForexEducation #TrendTrading #PriceAction
---

GBPUSD 30m – Elliott Wave + AO ConfirmationPrice is currently testing the 1.36277 zone. I’m closely monitoring for a break of structure below this level. If it breaks, I’ll be watching for a pullback setup to short, ideally aligning with BBMA/EMA confluence.
The wave structure looks clean:
• ✅ Wave (1), (2), (3), and (4) are completed.
• ✅ AO histogram also confirms momentum waves (1) to (4), with the current move likely to complete Wave (5) to the downside.
• 🔻 Wave (4) retraced into the previous imbalance zone and respected resistance, giving further confluence for bearish continuation.
Looking to target below 1.3500 for Wave (5) completion.
Key Levels to Watch:
• 🔑 Break below 1.36277 = Bearish confirmation
• 🎯 Potential TP Zone: 1.3450 – 1.3425
• 🚫 Invalidation if price closes above 1.3700 with momentum
Let’s see how price reacts at this key level 👀
#GBPUSD #ElliottWave #AO #PriceAction #BreakOfStructure #TradingView

80% drop into the abyss for Solana? - July 2025** The months ahead **
Examination of the 3-week chart for SOLANA reveals several compelling technical signals that suggest a potential bearish trend reversal. This analysis highlights crucial patterns traders and investors of Solana should consider.
1. Formation of a 3-Week Death Cross:
A notable bearish signal prints on the chart: a ‘3-week death cross’. This follows a ‘2-week death cross’ that preceded a significant downward movement, just as in early 2022. The death cross, where a shorter-term moving average crosses below a longer-term one, is a strong indicator of a shift towards a bearish trend, especially on higher timeframes like this 3-week chart.
2. Broken Market Structure:
The chart clearly indicates a “broken market structure.” This typically occurs when the price fails to create higher highs and higher lows during an uptrend, or in this case, breaks below a significant support level that had previously held. It is absolutely possible price action backtests past support for a resistance confirmation, however on looking left, such a test never occurred on the last death cross.
3. Resistance from Previous Peaks (Head and Shoulders Pattern):
Price action leading up to the recent highs resembles a potential ‘Head and Shoulders’ pattern. The three distinct peaks, with the middle peak being the highest, suggest a classic reversal pattern. A subsequent break below the ‘neckline’ (implied support level below the peaks) would confirm the bearish outlook.
4. RSI Oscillator (bottom of chart) resistance
The lower panel of the chart displays an RSI oscillator indicator, which shows a clear pattern of "resistance." following a period of support since 2023. The RSI has clearly confirmed resistance from almost 3 years of support.
5. Solana vs Bitcoin
All the bearish observations made on the SOL-USD trading pair can be observed on the same 3 week time frame for the SOLANA - BITCOIN trading pair:
6. Potential for Significant Downside Target:
Based on the measured move from the previous death cross and breakdown and Fibonacci extension, the chart illustrates a potential downside target of approximately -70% from current levels toward the $30-40 area. While this is a projected target and not guaranteed, the historical precedent following similar bearish signals provides a context for the potential severity of the downturn if the bearish momentum continues.
Conclusion:
Considering the confluence of a 3-week death cross, broken market structure, resistance from previous peaks (suggesting a potential Head and Shoulders pattern), and the confirmation of RSI resistance, the outlook for SOLANA on the 3-week timeframe appears distinctly bearish.
Is it possible price action continues upwards after a 3200% rally? Sure.
Is it probable? No
Ww
