OTE: Stock Breathes Again After Romania Exit OTE: Stock Breathes Again After Romania Exit – Strong Support from AXIA – Bullish Rebound from Key Support Zone (TECHNICAL ANALYSIS)
KONSTANTINOS GKOUGKAKIS – July 30, 2025, 07:31
Romania is over, shareholder returns are next. OTE’s strategic exit from the loss-making Romanian mobile market (Telekom Romania Mobile) gives the Group renewed momentum. AXIA Ventures sees clear positive impact on liquidity and OTE’s investment profile.
A Move the Market Was Waiting For
The green light from Romanian authorities for the sale of Telekom Romania Mobile (TKRM) didn’t come as a surprise—but the market reaction revealed how eagerly it was anticipated. For years, OTE was trapped in a challenging investment in Romania. Now, the Group breathes easier, freeing itself from a burden that dragged down cash flows, operations, and stock dynamics.
What AXIA Says – Capital Relief, Liquidity and Shareholder Rewards
AXIA Ventures is clear and direct: the deal will have a positive effect on free cash flow and capital returns to shareholders. AXIA estimates an immediate cash flow benefit of €10 million for 2025, with €20–30 million annually thereafter. At the same time, they foresee a €40–50 million increase in shareholder capital returns, translating to at least a 10% boost in total yield to shareholders for 2025.
Cash Flows Without TKRM – OTE Gets Breathing Room
TKRM was expected to have a negative €70 million cash flow impact in 2025—a figure already baked into OTE’s guidance of €460 million free cash flow, of which €451 million (or 98%) is planned for distribution:
€298 million in dividends
€153 million in share buybacks
With the Romania exit, OTE gains a fresh window for special capital returns beyond what’s already planned. Management has confirmed that any additional net cash benefit from the transaction will be returned to shareholders, reinforcing market confidence.
A Costly Chapter Closes – The Numbers Speak
TKRM came at a high price. In 2024 alone, the subsidiary posted €143 million in losses, adding to a decade-long total exceeding €440 million. Equity was wiped out, and the operation was sustained only by Group funding. While the sale doesn’t command a high price tag, it helps avoid hundreds of millions in future losses and unlocks a tax credit of over €100 million, according to AXIA.
The total estimated benefit stands at €560 million—or €1.39 per share.
Stability and Strategic Clarity
OTE stock needed a catalyst like this. Despite solid fundamentals and international momentum, the uncertainty around TKRM was a drag. Now, the picture is clear:
Strategic cleanup is complete
Focus shifts fully to profitability and Greece
The investment story becomes positive, predictable, and scalable
No surprise that AXIA maintains a “buy” rating with a €19.5 price target. Similarly, NBG Securities sees a 29% upside (targeting €19.8), calling OTE an “ideal pick for defensive portfolios.”
A Two-Step Deal – Vodafone and Digi Split the Assets
The Romanian deal involves two separate transactions:
Digi Communications will acquire TKRM’s prepaid mobile customers, spectrum licenses, and part of the base station infrastructure.
Vodafone Romania will acquire the rest of TKRM’s equity, excluding 7 shares owned by Radiocomunicații.
Final closing is pending approval from ANCOM (Romanian telecom regulator) and is expected within Q3 2025.
The Bigger Picture: OTE on a New Trajectory
The Romania exit is part of a wider strategic transformation. OTE is betting on technological leadership, leveraging the global Telekom brand, and targeted capital returns.
COSMOTE leads with 70% 5G SA coverage and 99% total population reach.
Investments in FTTH, FWA, AI-RAN, and MagentaONE build an integrated digital services ecosystem.
Srini Gopalan’s “un-carrier mindset” strategy signals OTE is no longer playing defense—it's attacking with tech and international scale.
Why Now? Why This Way?
Simple answer: it had to happen. The Romanian mobile venture had failed. Exiting now—while tough at first—paves the way for better capital allocation, higher returns, and strategic clarity.
The market got the message. AXIA confirmed it. And the stock finally took the breather it needed to restart its climb.
OTE Technical Analysis – July 30, 2025
Short-Term Picture: Bullish Reaction from Strong Support Zone
OTE stock shows clear signs of recovery after a period of pressure. Accumulation around €15.00–15.20 created a solid support base, confirmed by Buy signals and strong green volume spikes.
The current price sits at €15.83, posting a +0.44% daily gain, and approaches the critical 0.5 Fibonacci retracement level at €16.12—a key intermediate resistance between the low of €15.02 and the high of €17.89.
Fibonacci Retracement Levels
0.382 at €15.79: already breached (bullish sign)
0.5 at €16.12: immediate resistance
0.618 at €16.45: strong resistance level; a break here could lead to retesting €17.00–17.80
A clean breakout above €16.12 would be a bullish confirmation, targeting €16.80–17.20.
MACD – Momentum Strengthening
The MACD is turning bullish:
MACD Line: -0.0188, rising toward
Signal Line: -0.0884
Histogram: +0.0696, indicating momentum buildup
A bullish crossover is expected soon, reinforcing the positive bias.
RSI – No Overbought Signals, Room to Rise
The RSI is at 59.91, not yet in overbought territory, suggesting room for further gains before any pullback. The RSI-based moving average sits at 45.53, confirming upward momentum.
Exponential Moving Averages (EMA)
EMA 20: €15.50
EMA 50: €15.72
EMA 100: €15.97
EMA 200: €15.93
Price is currently above all major EMAs, reinforcing the bullish scenario. A possible Golden Cross could materialize on the 4-hour chart. Staying above EMA 100 (€15.97) will be key.
Volume – Breakout Confirmed by Strong Demand
Volume surged significantly during the breakout above €15.60, validating buyer interest. Green bars dominate the latest sessions, showing a shift in sentiment and confirming demand.
Momentum with Structure, But Watch Key Zones
OTE’s stock has entered a positive momentum phase, with several technical indicators (MACD, RSI, Fibonacci) pointing to potential continuation. Recent news about the TKRM sale adds fuel.
Still, the €16.12–16.45 zone is critical. A clean breakout on strong volume could lead to a full recovery of June’s losses and pave the way for new 2025 highs.
OTE

EURAUD (BOS 1H + DEMAND + OTE)Hello traders!
Description: Now we already in 0,5 of fib level, price want to close imb and mitigate demand + 705 OTE in case BOS 1H.
Entry: Confirmation on LTF in POI
Target: New HH
P.S: check also previous idea.
Have a profitable day and don't forget to subscribe for more updates!
If you like this idea drop a like, leave a comment.

EURUSD (STOP LOSSES SUPPLY + CONFIRMATION ON LTF)1) On top we have MSS + 705 Fib level.
2) Now price grab ST from demand and we can wait for confirmation on LFT.
3) NON mitigate Demand zone is OB 1H, i think price come back because 0.5 is still valid.
Entry: confirmation on LTF in POI
Target: First problem zone is OB 4H
Have a profitable day and don't forget to subscribe for more updates!
If you like this idea drop a like, leave a comment.

EURCAD (Supply/Demand + OTE + Liquidity)Hello traders!
We have valid 705 fib level, there we can expect reversal + mitigation demand zone.
Now price go to local correction. In local 0.5 fib level you will see big volume like confirmation before impulse till Demand.
Entry: confirmation on LTF in POI
Target: First problem zone is OB 4H
MAIN MOVE IN SHORT - TILL 0.5 of GLOBAL FIB LEVEL. SEE PRIVOIUS IDEA.
Demand zone also can be like fuel, so
Have a profitable day and don't forget to subscribe for more updates!
If you like this idea drop a like, leave a comment.

AUDNZD (SUPPLY+BOS+OTE)Hello traders!
We have supply + OTE.
Now we can expect reversal on LTF from 705 fib level + 0.5 Supply zone.
Have a profitable day and don't forget to subscribe for more updates!
If you like this idea drop a like, leave a comment.

NAS100 (BOS 1H + SUPPLY + OTE)Hello traders!
Now reaction from 705 fib level, Supply = OB 4H. But we can expect mitigation supply and confirmation on LTF. We have BOS on 1H.
Target: till 0.5 global fib level.
P.S: We have also on top OB 2H + OTE
Have a profitable day and don't forget to subscribe for more updates!
If you like this idea drop a like, leave a comment.

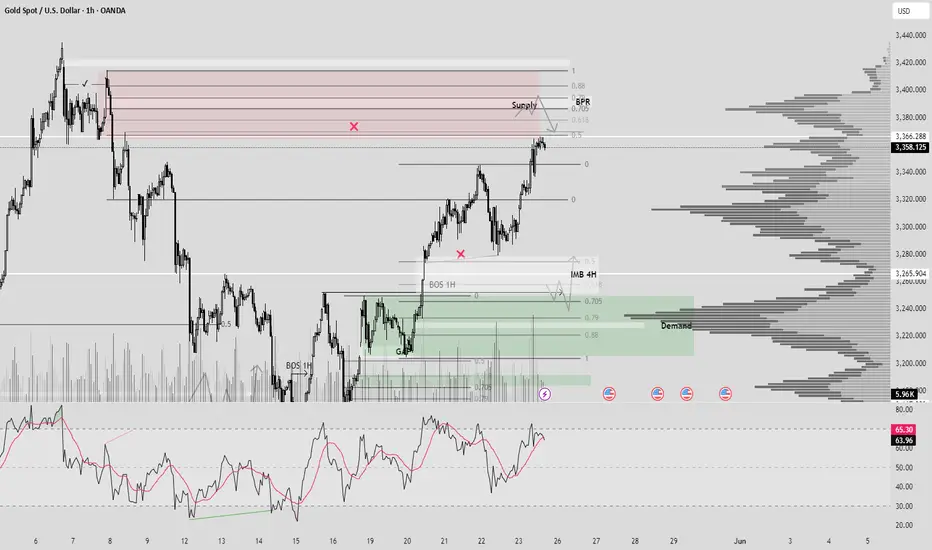
XAUUSD (BPR + SUPPLY + VOLUME + OTE)Hello traders!
1) Price come back to our demand zone, and for me 0.5 Supply still strong zone for selling +BPR 1H + Volume + OTE. RSI in oversold.
2) Also we have open BOS 1H + Demand 0.5 + Volume + Close IMB + OTE.
Have a profitable day and don't forget to subscribe for updates!
EURCAD (BOS 1D + Demand + OTE + Volume + OrderFlow)Hello traders!
As you can clearly see OF, daily structure(BOS 1D), expecting reversal from OTE zone. Alarm on 618 Fib level. In this moment we see divergence(also possible 3 tops). Price build liquidity to come back to our POI.(DEMAND)
Have a profitable day and don't forget to subscribe for updates!

EURUSD (CONFIRMATION + DEMAND + OTE)Hello traders!
Price mitigated demand and after we have confirmation on 1H TF. As you noticed our demand unmitigated. I expecting reversal on LTF after closing IMB.
Have a profitable day and don't forget to subscribe for updates!

XAUUSD (CONFIRMATION + OB + OTE)Hello traders!
From our previous analysis we expected reversal in 705 zone, now we have confirmation already and our target to close imbalance. Last open zone for interest is OB and mitigation(possible pullback with LG)
Have a profitable day and don't forget to subscribe for updates!

Understanding Fibonacci In TradingUnlock the secrets of Fibonacci and its powerful applications in trading. Learn how to use Fibonacci tools to identify optimal entry and exit points, manage risk, and refine your trading strategies. While many traders are familiar with basic Fibonacci retracements, this guide will also explore advanced techniques and lesser-known concepts.
📚 The Foundation of Market Geometry
🔢 What is Fibonacci?
The Fibonacci sequence is a series where each number is the sum of the two preceding ones:
0, 1, 1, 2, 3, 5, 8, 13, 21, 34...
This mathematical principle, introduced by Leonardo Fibonacci in Liber Abaci (1202), is foundational to nature, architecture, and financial markets. The key ratio derived from this sequence is 1.618, known as the Golden Ratio.
✨ The Golden Ratio and Market Significance
The Golden Ratio (1.618) and its inverse (0.618) appear frequently in natural patterns and price movements. In trading, these ratios help determine potential support and resistance levels.
Other critical Fibonacci-derived levels include:
0.236 (23.6%)
0.382 (38.2%)
0.5 (50%) (not strictly Fibonacci but widely used)
0.618 (61.8%)
0.786 (78.6%)
📊 How Fibonacci Became a Trading Tool
Traders noticed that price movements often respect Fibonacci levels, leading to the creation of Fibonacci-based tools:
📉 Fibonacci Retracement: Identifies potential reversal zones during pullbacks.
📈 Fibonacci Extension: Forecasts potential profit-taking levels.
📐 Fibonacci Arcs, Fans, and Time Zones: Advanced tools for multidimensional analysis.
Circles
Fans
🛠 Applying Fibonacci in Trading
📍 Step 1: Identifying Swing Highs and Swing Lows
Choose a clear trend and mark:
Swing High (peak before price declines)
Swing Low (trough before price rises)
📏 Step 2: Using Fibonacci Retracement Levels
On platforms like TradingView, apply the Fibonacci tool:
Uptrend: Draw from Swing Low to Swing High.
Downtrend: Draw from Swing High to Swing Low.
Key retracement levels act as support or resistance zones.
🚀 Advanced Fibonacci Concepts
🎯 ICT Optimal Trade Entry (OTE) Zone
A modern adaptation of Fibonacci, OTE focuses on the 0.618 - 0.786 retracement zone.
📊 Bullish Setup: In an uptrend, the price pulling back into the OTE zone signals a high-probability long entry.
📉 Bearish Setup: In a downtrend, price retracing into the OTE zone suggests a shorting opportunity.
💎 The Golden Pocket
The zone between 0.618 - 0.650 is known as the "Golden Pocket." This is a prime area where the price often finds strong support or resistance before continuing its trend.
⏳ Fibonacci Time Zones
While most traders focus on price-based Fibonacci levels, Fibonacci Time Zones can predict when significant price movements may occur. These vertical lines are placed at Fibonacci intervals (1, 2, 3, 5, 8...) from a significant market event.
🔄 Fibonacci Confluence
When multiple Fibonacci levels align with other indicators (trendlines, moving averages, pivot points), it creates a Fibonacci Confluence Zone, strengthening the probability of a reversal or continuation.
📊 Fibonacci Clusters
Traders can plot multiple Fibonacci retracements/extensions on different timeframes. Overlapping levels suggest a high probability reaction zone.
📌 Combining Fibonacci with Other Tools
Fibonacci analysis is most effective when combined with:
📉 Candlestick Patterns: Confirmation for reversals or continuations.
📏 Trendlines & Moving Averages: Validate Fibonacci levels.
📊 Volume Analysis: Gauge strength of reactions at Fibonacci levels.
🧠 ICT Strategies: Incorporate Fair Value Gaps, Inversion Fair Value Gaps, Breaker Blocks, and Order Blocks for precision entries.
📍 Practical Applications of Fibonacci
⚡ Scalping: Use Fibonacci on lower timeframes (1m, 5m) to identify intraday opportunities.
📈 Swing Trading: Combine Fibonacci retracements with trend analysis for multi-day trades.
💰 Long-Term Investing: Apply Fibonacci tools on weekly/monthly charts to pinpoint major turning points in the market cycle.
🏆 Key Takeaways
Mastering Fibonacci enhances your ability to:
Identify optimal entry and exit points.
Manage risks with precision.
Gain deeper insights into price movements.
By integrating Fibonacci with other trading strategies, you can refine your approach and improve decision-making. Start experimenting with Fibonacci tools today on TradingView and elevate your trading strategy!

Ethereum (eth) Long entry setup supply and demand + ote 📊 Precise Setup for a Long Entry on ETH/USD
💡 Why this trade?
🔹 Strong demand zone detected (S&D)
🔹 Optimal Trade Entry (OTE) confirmed by the 62%-79% Fibonacci retracement
🔹 Bullish breakout + strong reaction at a key order block
🎯 ETH/USD Trade Plan
✅ Optimal entry point (OTE) 📍: Waiting for a fresh bullish demand zone on H1 or M15
✅ Key demand zone (S&D) 🛑: $3,060.00
🔥 ETH is setting up for a strong move! This Supply & Demand + OTE strategy offers a high-probability trade with an excellent risk-to-reward ratio.
📢 Follow for more exclusive analysis and trade signals! 🚀
#Ethereum #Crypto #Trading #ETH #SupplyAndDemand #OTE #SmartMoney #DayTrading #SwingTrading #CryptoSignals #TechnicalAnalysis

Mastering Fibonacci in TradingMastering Fibonacci in Trading
Unlock the secrets of Fibonacci and its applications in trading. Learn how to utilize this powerful tool to find optimal entry and exit points, manage risks, and enhance your trading strategies.
What is Fibonacci?
The Fibonacci sequence is a series of numbers where each number is the sum of the two preceding ones. The sequence begins as follows:
The sequence is named after the Italian mathematician Leonardo Fibonacci, who introduced it to Western mathematics in his book Liber Abaci in 1202. One of the fascinating properties of this sequence is the ratio between successive numbers, which converges to approximately 1.618—known as the Golden Ratio .
The Golden Ratio and Its Significance
The Golden Ratio (1.618) and its inverse (0.618) appear frequently in nature, art, architecture, and financial markets. In trading, these ratios, along with derivatives like 0.382 and 0.786, are used to identify potential support and resistance levels.
How Fibonacci Became a Trading Tool
Traders and analysts observed that price movements often respect Fibonacci levels, retracing or extending along these key points. This led to the creation of Fibonacci-based tools, such as:
Fibonacci Retracement : Used to identify potential reversal levels during pullbacks.
Fibonacci Extension : Helps forecast profit-taking levels during trends.
Fibonacci Arcs, Fans, and Time Zones : Advanced tools for multi-dimensional analysis.
Using Fibonacci in Trading
Step 1: Identifying the Swing High and Swing Low
Select a clear price movement, either an uptrend or a downtrend, and mark the highest point (swing high) and lowest point (swing low).
Step 2: Applying Fibonacci Retracement
Using the Fibonacci tool on platforms like TradingView, draw from the swing low to the swing high (for uptrends) or from the swing high to the swing low (for downtrends). Key levels to monitor are:
0.236 (23.6%)
0.382 (38.2%)
0.5 (50%)
0.618 (61.8%)
0.786 (78.6%)
These levels often act as support or resistance zones.
ICT Optimal Trade Entry Zone
Fibonacci retracement levels have been widely used by traders, from traditional to Smart Money concepts. While technical analysis has evolved, traditional tools like Fibonacci retracement levels still hold their relevance. A modern adaptation of this is the ICT Optimal Trade Entry (OTE) concept.
The Fibonacci level range from 62% (0.618) to 79% (0.786) is known as the Optimal Trade Entry Zone . This zone is critical for identifying high-probability reversal points during retracements.
Bullish Setup : In an uptrend, the OTE zone provides a favorable entry point when the price pulls back to this area, indicating a potential continuation of the bullish trend.
Bearish Setup : In a downtrend, the OTE zone serves as a resistance area where the price is likely to reverse and continue its downward trajectory.
The Golden Pocket
The zone between the 0.618 and 0.650 levels is also referred to as the "Golden Pocket," emphasizing its importance as a high-probability area for price reversals or trend continuation.
Combining Fibonacci with Other Tools
Fibonacci works best when combined with other technical analysis tools:
Candlestick Patterns : Confirmation signals for reversals or continuations.
Trendlines : Validate key Fibonacci levels.
Volume Analysis : Assess the strength of price movements near Fibonacci levels.
ICT Strategies : Use concepts like mitigation blocks or liquidity voids to refine entry points in the OTE zone.
Practical Applications
Scalping: Use Fibonacci on shorter timeframes to identify intraday opportunities.
Swing Trading: Combine Fibonacci retracements with trend analysis for multi-day trades.
Long-Term Investing: Employ Fibonacci on weekly or monthly charts to identify major turning points.
Conclusion
Fibonacci tools are essential for any trader looking to enhance their market analysis. By mastering these tools, including the ICT Optimal Trade Entry concept, you can:
Identify optimal entry and exit points.
Manage risks more effectively.
Gain deeper insights into market behavior.
Start experimenting with Fibonacci today on TradingView and discover how it can transform your trading strategy!

FILECOIN LONG-SWING TRADINGI’m starting to go long on altcoins, beginning with Filecoin. I see a realistic target before the weekend, ahead of a potential breakout.
BINANCE:FILUSDT
This is a swing trade setup, with the plan to close it by the weekend or on Sunday at the latest.
Entry Strategy:
OTE (0.705) + FVA + FVG + Overlapping Defense
Trade Management:
Consider taking the first profit at the 1.62 Fibonacci level. However, with altseason on the horizon, I'm aiming higher—targeting the 2.62 level to close the trade if all goes as expected.
Altseason is approaching. Stay calm; there’s still time to position yourself for solid entries at good prices before December.

BTC.D Keep calm, don't lose your headThe market will do what it always does—play with our emotions. We're all eagerly anticipating an altseason, right? But the market will test everyone’s patience, so it's wiser to stick with spot purchases and use DCA (Dollar Cost Averaging) for entry. Don’t give up, and above all, don’t sell now—you’ve weathered a tough bear market.
Dominance is set to decline, just as it has in previous cycles within these Fibonacci parameters. Stay calm, keep your emotions in check, and remember: patience and strategy are key.

XAGUSD LONG-ScalpingThis is a high-risk trade setup. While I believe silver has more room for a rally, I expect it may need a significant drop first—that's what my instincts say. However, based on the charts, I’ve decided to go long as the price action has been resilient and seems poised to recover from yesterday's bearish whipsaw candle. Reminder: this is a high-risk trade with 0.50% capital at risk.

EURUSD Scalping-day trading HIGH RISKSetup: OTE + FVA + FVG
FX:EURUSD
I'm using a tight stop-loss here because if it gets hit, I'm prepared to re-enter at a lower level. This approach allows me to better capture high-probability zones while keeping risk minimal at this stage.
📈 RR: 12.15 — A great risk/reward ratio that helps me optimize each trade and manage capital efficiently.
Always ready to adapt to market conditions and stick to the plan 👊. If this trade doesn't go as expected, I've already got the next step in mind.

EURUSD Scalping-Day trading LONG1st Entry - 15min POI:
I decided to open three trades using the OTE reversal strategy within the 0.705 to 0.79 zone, taking advantage of the range between the swing high and swing low.
Entry timeframes:
1min
Emotions: Calm and confident
Risk/Reward Ratio: 3.58
Lot size: 0.5
2nd Entry:
Entry Price: 1.0968
Risk/Reward Ratio: 4.53
Lot size: 0.8
Emotions: Calm and confident
3rd Entry:
Entry Price: 1.0967
Risk/Reward Ratio: 3.45
Lot size: 0.3
Emotions: Calm, but I entered too quickly, as the price was nearly the same as my second entry. However, I'll close this trade earlier at the STR.

PEPEUSDTAs you can see in this chart we have to things
1. FVG in 15m
2. OTE from low and high
in this situation if we face this 2 parameters we can sell or buy
here we can buy
be careful and +++++

pepeusdt as you can see in the chart pepeusdt touched my OTE area and we can expect that it can go up
its easy way to catch this situation

The next rally for #Bitcoin It's clear that the market has started attacking those who have been profitable going shorts, therefore I've selected their liquidity pools for Targets, and because of that we have an OTE setup we can assume the ultimate target would be 79535

BTC AnalyzeWe faced a huge Bullish move by BTC Now we have a liquidity
After it we must wait for Bearish move to FVG and OTE
we have a powerful area there ( I marked in the chart )
when candles moved down and touched OTE and FVG we expect a good bullish move
caution :
this area can move more at the right side of chart so wait for price not area

BTCUSDTAs you know BTC faced a FVG and we expected to see bearish candles .
Now in this situation bearish candles are going to be finish in FVG that i show you in the chart then we expect to see bullish candles .
in this bullish FVG we can see OTE too so it can be more possible for us to see this bullish trend
