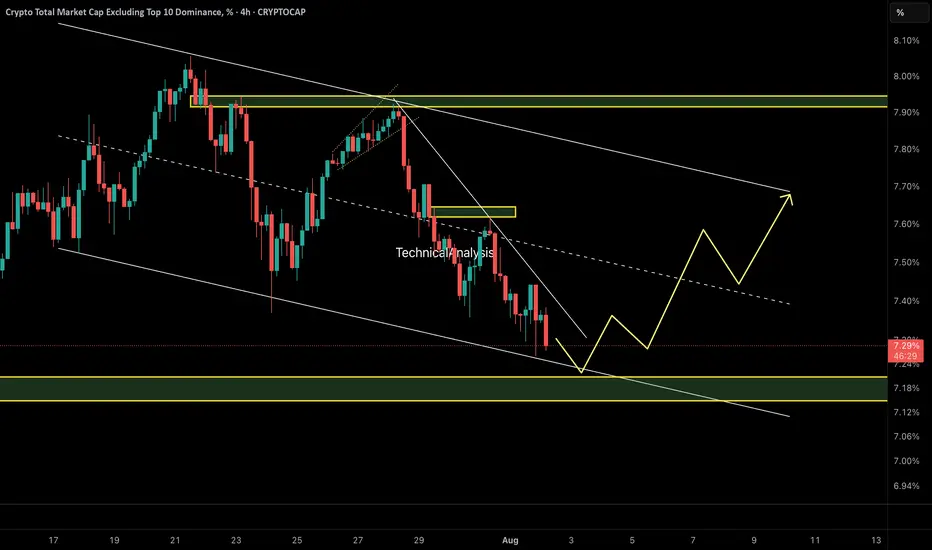
OTHERS.D – Perfect Reaction to Previous AnalysisAs predicted in the last update, OTHERS.D broke structure and dropped sharply toward the 7.20% demand zone — exactly as expected.
Now, we’re waiting for a potential bullish reaction from this key area. If demand holds, a move toward the upper channel boundary (~7.70%) could follow.
🧭 Technical Outlook:
• Price tapped into a key demand zone at 7.20%, which aligns with the lower boundary of a descending channel.
• A bullish reaction is forming, suggesting short-term strength in altcoins.
• A move toward the channel top near 7.70% is now on the table if demand holds.
⚠️ Important Note:
This move is likely to remain a corrective rally unless we see a proper breakout above 7.70% with volume and structure shift. Be selective with altcoin longs.
🔍 Watch for:
• Reaction at 7.50% midline
• Price behavior at 7.70% resistance
• Structure shift or failure pattern near channel top
⚠️ Caution: This remains a corrective rally unless price breaks 7.70% with structure shift.
🔗 Analysis by CryptoPilot
Othersd
Do you believe in miracles?Others dominance is crazily undervalued way beyond anyone's imagination, it's been a crazy 4 year bear market for alts. Big question is, when will it end. Can't fathom this industry getting killed by exchanges, just look at others.d go man, crazy low.
If this were the equivalent to 2019/2020 and 2015/2016, any buy in this range is a one in a lifetime opportunity.
If this is like December 2016, well, that would save us years of struggle. Hard to tell what's going to happen but I still believe Trump will give us an extended bullrun that will peak when the FIFA world cup is on somewhere around July 4th 2026.
Great depression? this goes way beyond that, what more of a great depression do you want. Just brutal.

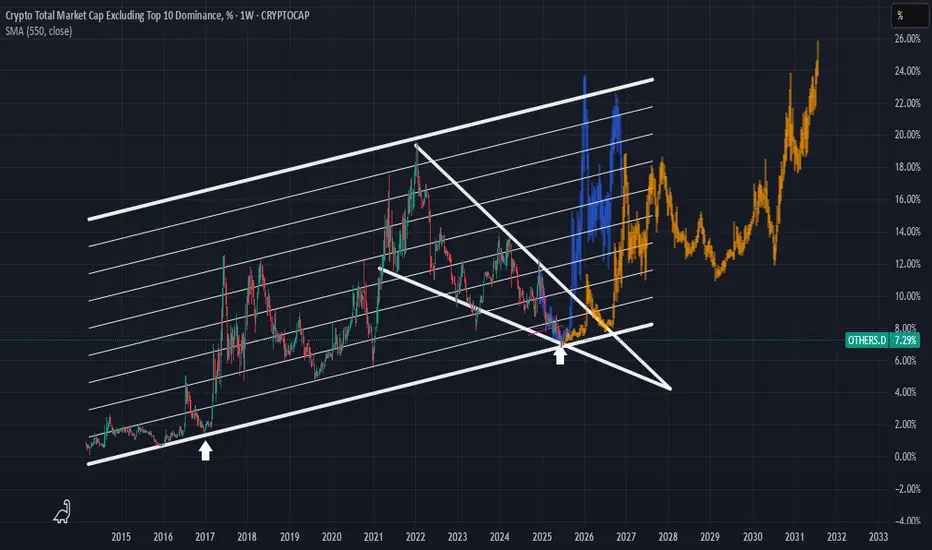
Very similar to January 2016You are looking at the Crypto Total Market Cap Excluding the Top 10 cryptocurrencies (OTHERS.D) on a weekly timeframe. This chart is often used as an "Altcoin Index" to gauge the strength of the broader cryptocurrency market beyond the major players like Bitcoin and Ethereum.
Here's my observation about being in a period similar to January 2016.
The technical analysis on this chart is built around a few key concepts:
1. Long-Term Ascending Channel: The dominant feature is a large parallel ascending channel that has contained the altcoin market cap's movements since 2015. The upper line has acted as a resistance level during bull market peaks, and the lower line has served as a major support level during bear market bottoms.
2. Historical Fractal (The "January 2016" Idea): My idea centers on a historical comparison, or a "fractal."
- The first white arrow points to a period in late 2016. At this time, the altcoin market cap found a bottom right on the support line of the ascending channel. This bottoming phase preceded the explosive 2017 bull run.
- The second white arrow points to a projected time in late 2025 / early 2026. The chart suggests that the market is currently in a similar bottoming pattern near the same long-term support line.
3. Falling Wedge: I've drawn a large falling wedge pattern starting from the peak in late 2021. This is typically a bullish reversal pattern, suggesting that the long downtrend could be nearing its end. The price is currently interacting with the apex of this wedge, a critical decision point.
4. Price Projection: The orange and blue bar patterns are copies of the price action that followed the 2016-2017 bottom. By pasting this fractal to the current time, the chart visualizes a potential future where history rhymes, leading to a massive new bull market for altcoins extending into 2027 until the end of the roaring 20s.
The Bullish Case (According to the Chart)
The argument presented by this analysis is clear:
• The altcoin market is at a historically strong support level (the bottom of the ~10-year channel).
• This is the same support level that kicked off the massive 2017 bull market.
• The market is consolidating within a falling wedge, which has a higher probability of breaking to the upside.
If this analysis holds true, the current period could be seen as a significant accumulation zone before the next major market expansion, much like the period around January 2016 was.
Important Considerations and Risks
While this is a compelling technical setup, it's crucial to maintain a balanced perspective. Here are some factors to consider:
• Past Performance is Not a Guarantee: This is the most important principle in financial markets. While historical patterns can provide valuable insight, they do not guarantee future results.
• Market Dynamics Have Changed: The cryptocurrency market of 2025 is fundamentally different from that of 2016.
• Maturity and Size: The market is significantly larger and includes substantial institutional investment, which can alter market behavior and volatility.
• Macroeconomic Factors: Global economic conditions, such as interest rates and inflation, now have a much stronger influence on the crypto market than they did in its earlier days.
• Regulatory Environment: Increased global regulatory scrutiny can introduce uncertainty and risks that were not present in the 2016-2017 cycle.
• Subjectivity of Technical Analysis: The trendlines and patterns are drawn based on an analyst's interpretation. Another analyst might draw them slightly differently, leading to a different conclusion.
Conclusion
The idea that "we're in January 2016 all over again" is a valid interpretation based on the technical patterns in this chart. The analysis points to the altcoin market being at a critical long-term support level, similar to the setup that preceded a major historical bull run.
This chart lays out a clear bullish roadmap. However, everyone should treat it as a potential scenario, not a certainty. I'll continue to monitor if the price respects these historical levels so that you guys are mindful of the broader market and macroeconomic factors that could influence the outcome.
Disclaimer: This analysis is for informational purposes only and is based on the technical analysis presented in the user-provided image. It should not be construed as financial advice. All investment decisions carry risk, and you should conduct your own research.
Stablecoin Dominance vs Altcoins – Final Altseason Loading?This chart visualises a powerful relationship — stablecoin dominance (USDT.D + USDC.D) versus OTHERS dominance (i.e. altcoins excluding BTC and ETH).
Put simply:
When this chart moves down, stablecoins are flowing into altcoins — risk-on behavior, altseason ignites.
When it moves up, capital rotates back into stables — risk-off behavior, weakness across alts.
This has nailed every major altseason impulse and correction cycle over the past few years.
Right now, we’re seeing this pair push higher into a key supply zone — the same distribution range it previously broke down from. My expectation is a retest of that breakdown zone, which should align with a short-term correction in the altcoin market.
📉 Once this retest plays out and we see signs of weakness at supply, I anticipate continuation bearish in this pair — leading to stablecoins flowing back into altcoins.
That next leg down into higher time frame demand could mark the final altseason push, before the broader market tops out. If we follow the usual cycle pattern, that last alt impulse will likely drag retail back in for the top — just before distribution takes over and the bear phase begins.
🧠 In short:
Push into supply → altcoin correction
Breakdown → capital rotation back into alts
Final altseason + market top → bottoming of this chart + reversal bullish
This will be a key chart I’ll track closely over the next few months — it offers one of the cleanest reads on altcoin liquidity flow and timing for top formation.
1W:

USDT.D/OTHERS.D - Altcoin Season IndicatorPrice rejected from the 3M HTF supply and major BSL on the prior highs. Price has now gave a confirmed 1W bearish market shift, indicating a market wide altcoin reversal is playing out and the next bullish impulse higher isnt far off....
Watching for rejections in this weekly supply on this pair as marked and looking for a bearish daily market shift to give confirmations of a potential reversal bearish in line with the recent weekly bearish market shift that occurred from the BSL sweep into 3M supply and refined supply within it.
As shown, this chart is an altcoin indicator and im expecting that last altcoin season and cycle to occur after this chart tops out into supply and then continues lower into the SSL low at 0.29% and into the 3 month demand below it.
Seeing similar indications from the other charts shared like BTC.D and BTC.D+ETH.D+USDT.D+USDC.D, where they show continued weakness in alts for now with a HYTF bullish reversal in altcoins not far off.
3D:
1W:

OTHERS ROADMAPTo me the view is pretty clear.
* The purpose of my graphic drawings is purely educational.
* What i write here is not an investment advice. Please do your own research before investing in any asset.
* Never take my personal opinions as investment advice, you may lose your money.
Altcoins Are Ready For Big DropHello, Skyrexians!
It's very important when BTC, USDT and CRYPTOCAP:OTHERS.D dominances analysis perfectly matches with each other. I bet for Bitcoin and Tether dominance growth in the upcoming weeks and dump for altcoins.
Let's take a look at the 2 days time frame. Price was not even able to reach 0.38 Fibonacci level, but reached wave 4 top inside wave 3. In conjunction with zero line cross on Awesome Oscillator it's enough to say that we are in the wave 5 now. This dump will continue at least 7.5% low retest with the maximum target at 6.7%.
Very important, I see significant sentiment shift from bullish to bearish. When such article like this will collect more support than hate altseason will be ver close!
My previous analysis which played out well:
Best regards,
Ivan Skyrexio
___________________________________________________________
Please, boost this article and subscribe our page if you like analysis!

Altcoin Market (OTHERS) Cycle Analysis: To the Moon !Let’s take a closer look at the previous bull cycle of the Others (Altcoin Market Cap excluding BTC & ETH) chart.
Before the major upward move, the market declined for months, eventually finding strong support around the $170B level.
After forming a higher low and a clear change of character (CHOCH), the market entered a sustained bullish phase. For 124 consecutive days, we witnessed a strong altcoin rally.
As of now, price action appears to be mirroring that same structure — but with a potential to push even higher than the previous ATH.
In this scenario, the target stands around the $470B level. As long as OTHERS holds above the $170B support, the altcoin market remains in recovery mode, and further upside is very much on the table.
— Thanks for reading.

The Altcoins Market Is Ready To Grow —Altcoins Season 2025The Altcoins market is ready to grow and here I have all the proof that you will ever need.
Good afternoon my fellow Cryptocurrency trader, how are you feeling today?
We know that the Cryptocurrency market is one; What one does, the rest follows.
We know that Bitcoin is the king of Crypto and when Bitcoin is bullish, the rest of the market also turns green. But Bitcoin being bullish isn't always all that is needed for marketwide bullish action. Bitcoin needs to be bullish but at a strong price, bullish confirmed. And that's exactly the situation we have today.
Today Bitcoin crossed easily and with a full green candle the $100,000 price barrier. Not only $100,000 but higher, $104,000 after trading as low as $96,800 today. With Bitcoin ultra-bullish, the Altcoins are set to follow and this chart—OTHERS.D—confirms not only the big Altcoins will follow but all Altcoins, the smaller ones as well.
Here is the best piece of news I can give you:
When Bitcoin grows 10%, the smaller Altcoins can grow between 50-100%.
When Bitcoin grows 30%, some of these Altcoins can grow up to 300%. Most of them can grow anywhere between 100 and 200%. This scenario is already present.
From Bitcoin's bottom around $74,500, it is already some odd 30% up. But, the smaller Altcoins do not start growing together with Bitcoin, only when Bitcoin becomes really strong. Bitcoin is really strong now so all the Altcoins grow.
When Bitcoin grows, say 50%, from $100,000 to $150,000, many of the OTHERS Altcoins will be growing between 300 and 500%.
When Bitcoin grows 80-100%, these Altcoins will be growing between 600% and 1,000%. So these pairs can be used to earn as profits in the same range as with a leveraged trade but without the liquidation risk.
So you can earn 5X, 6X or 10X on a small Altcoin, while Bitcoin produces its bullish wave.
Here the OTHERS.D index hit bottom yesterday and today is starting to grow. We have a full green candle and the action moving above support, the 7-April low.
The chart patterns, price dynamics and market conditions are pointing toward this index moving up. This moving up is the proof that the smaller Altcoins are set to grow strong. This means that these will grow faster than Bitcoin, Ethereum, Cardano, Solana, Dogecoin, XRP, BNB, Tron and all those in the TOP10. Don't get me wrong, everything will grow, but it is time for the Altcoins season.
Thanks a lot for your continued support.
Namaste.

Altcoins Will Explode In May!Hello, Skyrexians!
We have already made a lot of analytics about the Bitcoin Dominance, today it's time to update CRYPTOCAP:OTHERS.D analysis because it looks like the bottom could be in!
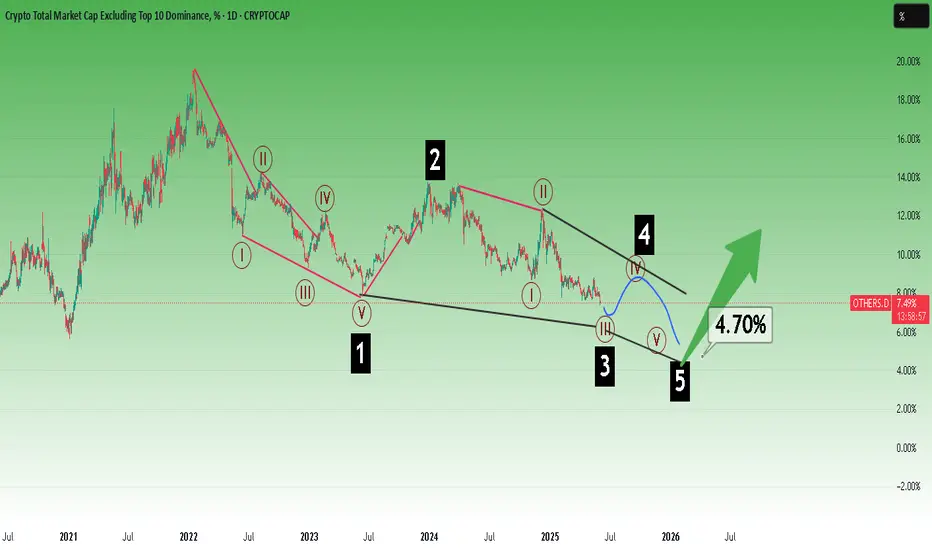
Let's take a look at the daily time frame. We have already pointed out that globally altcoins are about to finish the bear market and the 5 Elliott waves impulse which you can see on the chart is this last wave. Recently we have shown you the bullish divergence with the Awesome Oscillator, today we can see the confirmation of the divergence on the Acceleration/Deceleration indicator, which measures the waves inside wave 5 with no need to go on lower time frame. This divergence in conjunction with the green dot on the Bullish/Bearish Reversal Bar Indicator gives us strong confirmation of the reversal. The minimal target is 10-10.5% then we will see is it going to be true altseason or not.
Best regards,
Skyrexio Team
___________________________________________________________
Please, boost this article and subscribe our page if you like analysis!

Growth On Altcoins Is Beginning Right Now!Hello, Skyrexians!
Last week our main purpose was to catch the potential bottom for CRYPTOCAP:OTHERS.D and top for Bitcoin dominance. While the BTC.D has not still flashed the reversal signal, but altcoins did. So, we have a chance that reversal is coming, but don't be so optimistic on that, we need to see some extra confirmations anyway.
Let's take a look at the daily chart. Here we can see the 5 Elliott waves structure. Previous Elliott waves we have already looked in details in our recent analysis, today we need only wave 5. We pointed out 7-7.6% as a final target. The most likely reversal target was 7.4%, but now we are seeing good reaction from the minimal target. Yes, we have green dot signal on the Bullish/Bearish Reversal Bar Indictor . This is very strong, but let's wait at least the momentum change on the Awesome Oscillator and the opposite signal on the Bitcoin dominance.
Best regards,
Skyrexio Team
___________________________________________________________
Please, boost this article and subscribe our page if you like analysis!

FIFA WORLD CUP HISTORIC ROARING 20s QE Restart ScenarioBenjamin Cowen has been truly amazing with his analysis. As per monetary policy it's definitely too early to call the start of QE but we're on the right track.
it almost feels like the true Altseason will start when the FIFA World Cup starts. Every single scenario matches that theory. If you also pay attention to Algorand for instance, it's mimicking the early days of XRP. XRP is also mimicking the early years of Apple.
Can you imagine a scenario where XRP hits 120 dollars and Algorand 1200 dollars? I know I know the market caps etc. But so far it does feel like the markets are brewing for a truly historic roaring 20s scenario that could last for years.
Big question is, who has the first mover's advantage now and needs to catch up in the mean time?
I'm looking at tiny caps like Metastrike, and institutional coins like VeChain. China has already started QE so you may want to play around with VET while the entire market is boring.
JasmyCoin I can't tell yet, it could be but it has that annoying monitoring tag and in my case I've already survived 7 delistings already (dock, ooki, troy, gifto, gemie, kingdomverse, dreamsquest), so not touching it for now.
Looks very promising to be honest. Gotta have a long term vision here.

Last Wave Of Bear Market Is Happening Now For Altcoins Hello, Skyrexians!
As usual, recently we faced with a lot of hate when posted the article about Bitcoin Dominance growth, yesterday we analyzed a lot of charts on different time frames to make the most precise analysis for you. Hope it will be the truth. We really tried to do our best, please, don't criticize it too much!
We made this analysis briefly to simplify it for you. We are now in the last bearish wave for altcoin dominance, you can open 1 month time frame and see it. Now we dive into the current subwave on the daily time frame. Here we can see the clear view of Elliott waves cycle. Wave 4 has the triangle shape, it gives us more confidence that now price is printing wave 5. If we analyze only 1D time frame the target is 7-7.5%. There wait for bullish divergence and price will likely reverse.
Best regards,
Skyrexio Team
___________________________________________________________
Please, boost this article and subscribe our page if you like analysis!

Altcoins Can Explode In 2025 [READ CAREFULLY]Hello, Skyrexians!
It's time to update our CRYPTOCAP:OTHERS.D idea. In fact nothing changed still. We don't have the growth confirmation, but let's put together all facts which tell us that this growth can happen soon.
Let's take a look at the weekly time frame. We can see that Bullish/Bearish Reversal Bar Indicator gave us the green dot signal. This signal is unconfirmed. For confirmation we need breakout of 9% level. Much better if candle will be closed above it. This fact can finish the huge ABC correction which has been started after the previous altcoin season. This reversal bar has the great angle with alligator which is another one sign of soon trend change. All these signals can bring the dominance above 20%. In this case we will see massive gains on altcoins.
Best regards,
Skyrexio Team
___________________________________________________________
Please, boost this article and subscribe our page if you like analysis!

OTHERS.D UPDATE (4H)Altcoin dominance appears to be creating liquidity. It has not yet reached a key resistance point to accumulate more sell orders and drop further. Additionally, it has hit a very strong support level at the bottom.
For a continued drop, it needs to be fueled by an order block and gather more sell orders. Therefore, we expect it to move toward the upper order block and collect more liquidity from the liquidity pool we have identified.
Let's see what happens!
For risk management, please don't forget stop loss and capital management
Comment if you have any questions
Thank You

Are you watching closely?Don't listen to all those dramatic fools screaming and shouting at the top of their lungs so that you give up here. Would you dare to give up here?
Benjamin Cowen keeps crying stating he would prefer not to have a 2nd wave of inflation like it happened in the 70s because his children would suffer. Come now, while he's telling people he wishes for altcoins to die, technicals suggest otherwise.
This is the part where almost everyone gives up, will you give up?
I most certainly won't.

Altseason About to Begin?In both previous bull markets (2017 & 2021), the peak-to-bear market bottom took just over 1,000 days, with a similar drop of 73% & 74%.
We might currently be at the very bottom— right before an explosive altcoin season .
And it could come fast.
In both previous cases, once the bottom was hit, the insane altcoin rally kicked off within one or two weeks .
We can also use this pattern to estimate the time frame.
💥 The 2017 run lasted 336 days.
💥 The 2021 run lasted 378 days.
Taking the average (357 days), the next peak could be around January 2026.
That said, this is just one possible scenario.
From all the different time-based projections I’ve analyzed, most technical analyses suggest that altcoin season could peak around March or October 2025 .
A 2026 peak is a less common projection.
But knowing more possibilities means being better prepared.
I think this cycle will be short and explosive, with everything pumping and finishing fast.
If you like this kind of analysis, make sure to [🔥 follow me ]—I’ll be sharing more "guesses" like this!
---
🔥 I've dropped another 2 analyses for the 2025 altseason on the right hand side if you're using computer, and scroll down a bit to see the link if you're using mobile.

This Breakout Will Trigger Massive Altseason!Hello, Skyrexians!
According to your activity we noticed that you are interested in Bitcoin and CRYPTOCAP:OTHERS.D analysis. This is not a top secret because everyone wants to know when altseason will be started. In our recent we warned you about drop for altcoins dominance below the support level and it happened next day. Now we have the potentially reversal signal, be need to wait for it's confirmation.
On the weekly chart we can count the previous massive altseason as the wave 3. Previously we considered corrective wave 4 as the triangle shaped, but now it looks like classical ABC. If this is correct, dump on dominance can continue, but the potential reversal signal has been flashed by the Bullish/Bearish Reversal Bar Indicator . This signal still has not been confirmed, but if candles will break 9% the huge rally in wave 5 is incoming - true altseason.
Best regards,
Skyrexio Team
___________________________________________________________
Please, boost this article and subscribe our page if you like analysis!

OHTERS - Important level to holdIt's important to hold this level on the chart in my opinion, or else the market will go down HEAVY. Only one scenario would still be acceptable and thats a deviation with short term more pain.

Atlseason Is coming !!!alt seasion is coming
if market reach 20 % - 22% it's warining sign to leave the market

OTHERS Dominance - Altcoin DominanceThe chart is OTHERS.D. Essentially altcoin dominance in the market and an indicator of altcoin strength in the market.
Price is respecting a HTF uptrend since 2020, tapping into the HTF trend line which kicked off the prior altcoin seasons in the last cycles on each tap. Price is also coming into the HTF monthly demand range with high volume as price mitigates this area. We are also following the HTF bullish orderflow thats been established since 2020. Over the last few months price has capitulated into HTF demand, fulfilling all my targets and we are forming a range in key levels, whilst establishing some bullish orderflow on the daily timeframe from these lows and key levels.
I think based on the range profile on the daily, we are accumulating here in a local accumulation range, supported by high volume nodes on each wick into these levels, with a sweep of the range lows and now establishing bullish orderflow in the daily range from our HTF bullish levels where ive anticipated the HTF bullish reversal to form as covered in my prior forecasts and breakdowns.
I believe this is the start of a reversal setting up on OTHERS.D, from these HTF bullish levels and we should start to see the altcoin market pick up as this drives higher..
My first draws on LQ are at the 10.13% and 10.5% levels of this daily range.
Once price closes above the prior weekly swing high at the 10.5% level, this will confirm a new weekly HH and a shift in trend from the weekly timeframe, which should then follow into the monthly putting in a new HH in line with the HTF trend.
3M:
2M:
1M:
2W:
1W:
1M/1W/1D:
3D:
1D:

Be careful.Deep falls possible before expected bull run.
Don't make decisions with too much excitement.
Don't get carried away by social media.
* What i share here is not an investment advice. Please do your own research before investing in any digital asset.
* Never take my personal opinions as investment advice, you may lose all your money.

Altseason - are you seeing this?Others dominance may be wrapping up a right shoulder on he weekly. The right shoulder may take longer than the indicator has drawn, however so I've drawn my own next to it in white.
As confluence for this, the larger pattern began taking shape after a smaller one formed within its head.
The smaller inverted HS is already confirmed and is presently re-testing its neckline, pullbacks below failing so far. Its targets are 16% and then just slightly over 19% and just below ATH, should it hold after another test or pullback.
Targets for both:
The smaller HSi would confirm the larger one by reaching its TP 1 at 16%, and then holding above ~13.5% or so.
TP 1 as measured for the larger HSi on the non-log chart is 19.7%, or slightly above ATH.
Its logarithmic measured TP 1 is above ATH around 24.15%
Conclusion:
Altcoins may regain its prior ATH in market dominance, somewhere around 19.5%, and could approach 24-25%
