Alt season is coming!The symbol "OTHERS.D" refers to the "Crypto Total Market Cap Excluding Top 10 Dominance, %" index. This metric is used to track the performance of the cryptocurrency market, excluding the dominance of the top 10 cryptocurrencies by market capitalization. Essentially, it provides insights into how the rest of the market (i.e., cryptocurrencies beyond the top 10) is performing relative to the overall crypto marke
The Altcoin Index appears to be nearing the completion of a major bearish leg. It has reached a crucial level, and if it revisits the optimized zone, there could be a significant rejection to the downside.
For the medium term, however, this index looks bullish, showing potential for upward movement if it holds above key support levels.
Alt season is coming!
For risk management, please don't forget stop loss and capital management
Comment if you have any questions
Thank You
Othersdominance

When Will the 2025 Altcoin Season Arrive? Clue from OTHERS.DCRYPTOCAP:OTHERS.D is copying the same script as the last two altcoin seasons.
I’ve marked points 1-8 in the structure.
Each time, it formed a triangle consolidation before breaking into a bull run.
In the last two cycles, point 8 was the final low before the rally.
Right now, it's retesting point 8, which is the lower boundary of the triangle.
Will it repeat the script and break out, or is this time different?
Could we see a new scenario, or is it possible that altcoin season won’t come at all?
If the altcoin season does happen, OTHERS could 2x from here.
What do you think?
Do you believe we’ll see a crazy 2025 altseason?
for more future script "guesses" like this!
💰 Bitget 20% Trading Fee Discount:
lihi2.com

what others say about the market?CRYPTOCAP:OTHERS
✅ The Others chart, which shows the market cap of all altcoins other than the top 10 coins, is fluctuating at the corner of its triangle pattern, which could grow to a historic high of 492 on the first step if it breaks the downtrend line and resistance at 395.
✅ This chart will start its new upward wave with the breakdown of the major resistance of 492 for the following purposes:
550, 620, 712, 812
✅ The start of a new bullish wave on this chart will cause the growth of all altcoins 👌
⚠️ Disclaimer:
This is not financial advice. Always manage your risks and trade responsibly.
👉 Follow me for daily updates,
💬 Comment and like to share your thoughts,
📌 And check the link in my bio for even more resources!
Let’s navigate the markets together—join the journey today! 💹✨

OTHERS Others will need to print this impulsively to confirm the alt season. This idea is against the blue support where the price appears to be consolidating.

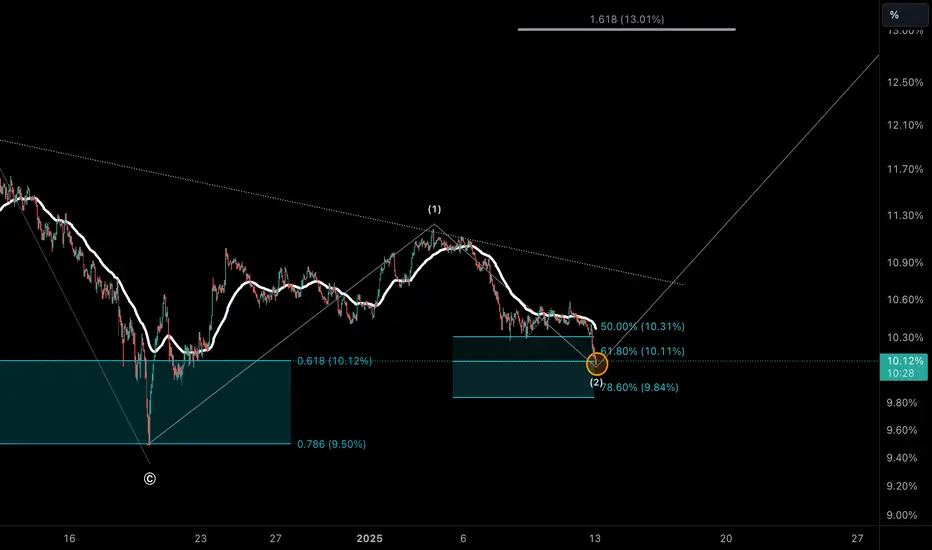
BTC.D Breakdown + ALTs Volume Profile | Key Market RotationCrypto Ex-Top10 Dominance: Bull Breakout Setup | Alt Season Indicator |
MY VIEW FOR NEXT 2-3 WEEKS
Current: 10.37% (-0.79%)
Vol: 375.29B
Pattern Setup:
- Double bottom at 10.3%
- Strong support trend holding
- Descending resistance line test
- Projected breakout to 13%
Levels:
- Strong resistance: 12%
- Current resistance: 11%
- Critical support: 10.3%
- Trend support: 9.5%
Trade Plan:
- Targets: T1: 11.5%, T2: 12%, T3: 13%
- Stop: Below 10.2%
- R:R = 1:3
Market Impact:
- Rising dominance suggests alt rotation
- Mid/low caps potential breakout
- Watch ETF impact on rotation
DYOR - Not financial advice. High volatility expected with ETF news.

rough guide to 2025 altseasonseems like we are in the most fun part of parabolic growth of crypto.
possible pathway to growth is charted here
we may see coins making daily gains of 10-20% for many weeks
people will be tired and impatient of any coin not making double digit growth
as per this chart, if your portfolio does less than 4x by H2 2025, what are you even doing?

We are in the Banana Zone. So Shill me an S coin.And I will promise to review it and take review it and chart potential Big Banana's
Lets set a deadline of Wednesday 8th of January midday UTC
Maximum of 2 coins per person.

OTHERSdoes not include financial advice.
Is it time for altcoins? we can see the outcome next week!
chart nears trend breakout..

Altcoins dominance #Altcoins Dominance is also in the final stage before the Altseason run, which will start from q1 2025, as seen in q1 2021

Alts Others dominanceCountdown begins for Altcoins super cycle
#Altcoins dominance OTHERS is about to pull a bullish leg!

OHTERS - Important level to holdIt's important to hold this level on the chart in my opinion, or else the market will go down HEAVY. Only one scenario would still be acceptable and thats a deviation with short term more pain.

Atlseason Is coming !!!alt seasion is coming
if market reach 20 % - 22% it's warining sign to leave the market

Atlseason Is Incoming, But Be Ready To Leave The Market in 2025!Hello, Skyrexians!
In one of our previous articles we mentioned why BTC dominance crash is imminent. Today we consider this analysis using CRYPTOCAP:OTHERS.D chart. This is capitalization of all crypto excluding top-10. We suppose that most of you invest in coins out of top ten ranking for potential bigger gains. Today we have a great news for those who hold such assets.
Let's take a look at the monthly time frame. We can see the clear 5 waves structures. Wave 4 in our opinion has been already finished. Our Bullish/Bearish Reversal Bar Indicator has printed the green dot which is strong bullish signal. As always, alerts from this indicator are automatically replicated on my accounts. You can find the information in our article on TradingView .
You can see how this indicator performed in the past: after a red dot printed the massive decrease. Now OTHERS dominance is in wave 5 which has the target 25%. There is going to be the great opportunity to take profit because in 2026 we expect the large correction and most of altos can die.
Best regards,
Skyrexio Team
___________________________________________________________
Please, boost this article and subscribe our page if you like analysis!

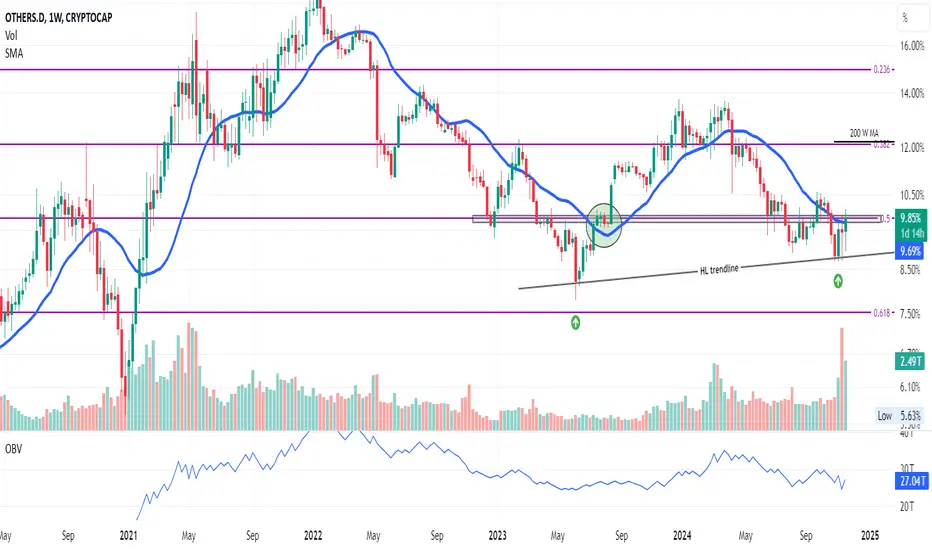
OTHERS.D 50.00% FIB CRITICAL LEVEL **Hello dear altcoin degens, HODL-ers, and traders,**
How are you doing this Saturday? I hope you’re enjoying the weekend in your own unique way!
This is **OTHERS.D**, the index representing the market cap of altcoins outside the top 10. On the weekly time frame, there are several key points of interest that could help us analyze what might happen next. However, as always in trading, nothing should be taken for granted.
**Key Observations**
1. **Higher Lows Trendline:**
- We can clearly see a series of higher lows, starting with the bottom formed during the week of **June 5, 2023**, and another higher low during the week of **October 28, 2024**. This upward trendline is a promising signal for the altcoin market.
2. **The Role of the 21MA (Moving Average):**
- Historically, the 21MA has acted as a reliable support level before price moves higher, as seen between **July 17,2023** and **August 7, 2024** (highlighted with a green circle).
- Currently, the price is trading above this 21MA, which is an encouraging sign.
3. **The Critical 50% Fibonacci Level:**
- The 50% Fib retracement level has historically been significant. The green circle highlights how this level previously served as the launchpad for an upward move.
- At present, the price is trying to break through this level, which is acting as resistance.
**Combining Support Factors**
When we combine the **21MA** and the **50% Fibonacci level**, we get an area of strong support/resistance. For now, the price is attempting to break through this resistance zone.
**What’s Next?**
- If the weekly candle closes **above this critical area**, it’s a bullish signal and great news for those hunting the elusive **altseason**!
- Until then, we wait. The weekly close will provide more clarity, and based on the outcome, we can decide on the next course of action.
**Final Note**
Patience is key in this game. Stay safe, and let’s see how this plays out!
Simple Conditions for Alts to Continue Moving vs BTCVery simple chart and conditions for altcoins to gain or lose dominance vs Bitcoin in the present market:
Others dominance needs to hold above ~9.15% and break and then hold above ~10.5%. Do that and it'll keep gaining dominance towards ~12-13%
Lose 9.15% and fail to reclaim it a 3rd time and alts will continue losing market dominance vs Bitcoin, heading down towards ~7.5-8%
I like to think there is a good chance we at least test the area above 10.5% seeing as we failed to remain below 9.15 after two attempts, the 2nd with a higher low. Failed breakdowns often tend to lead towards breakouts or at least breakout attempts (and vice versa)
That said, we may still yet test 9.15 or below one more time and... if we do, we'd want to see another higher or at least a same low and then a recovery of 9.15 if lost for it to head back up towards 10.5.
Some very roughly drawn possible paths are shown on the chart.
Best of luck!

Don't F@ck up the Banana zone!This is the Others marketcap vs the Bitcoin Market cap chart.
With their respective Banana zones for the past couple cycle and the current one we have already started.
The KEY takeaway is you should be feeling the FOMO and kind already have been deployed into your favourite #Alts
This #altseason may yield one of the worst performances in a cycle --- which I have warned a few times now. And finish sooner than you think.
If you had waited for confirmation of a altcoin breakout and rotated/bough at the sad face this how your returns would have been crippled.
21 X ----> 5.8X 2017
6.4X ----> 3X 2021
3/4X -----> 1.75X/2.3X 2025
Drastically different.
I hope you have found this chart informative. Smash the likes.

Altcoins - Basing in October: Will November Bring the Big Move?It seems we’re still in a basing or rotating cycle. We’re close to a trendy move, regardless of whether it’s bullish or not, as we near the end of this consolidation phase.
October has turned out to be #Flatober instead of #Uptober. That’s alright; the tighter the consolidation, the greater the chance November will make a definitive move in any direction.
I still lean bullish, but this week’s daily price action is a bit worrisome. Crypto appears to be used as a hedge, while equities remain the predominant risk-on asset going into CPI, making new highs as crypto retraces back to last week’s initial levels.
Basing for #October > Moving on to #November.
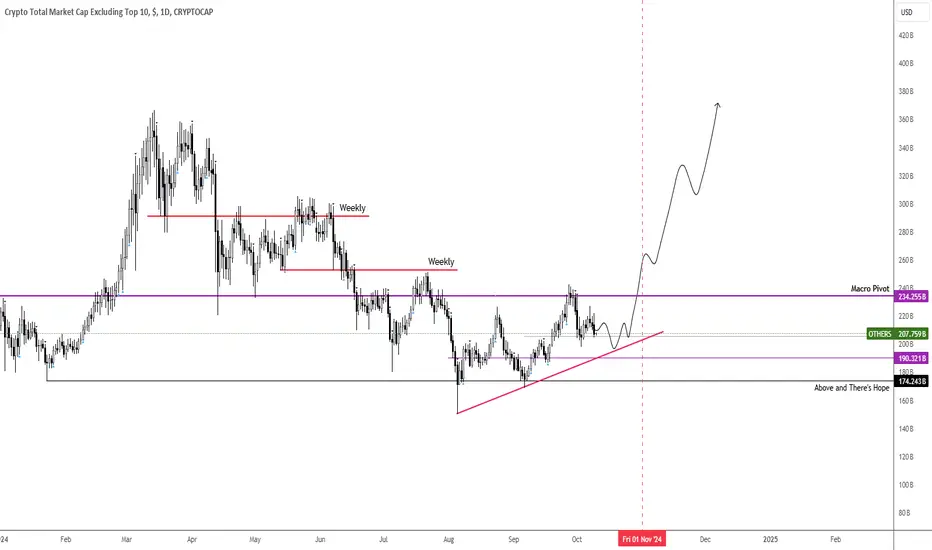
Others (alts) indexIt already brokeout the trendline resistance and facing a resistance at 227B ,
it will take a small pullback before facing its next strong resistance at 250B .
Brokeout and hold above 250B will lead a giga Bullish Market.
Bull season started

Others.d (alts dominance)It Exactly hit the trendline of parallel channel and closed above trendline in weekly as well as monthly chart
Now,
It started to pump from this level, That means a massive #Altseason started

OTHERS Dominance - Altcoin DominanceThe chart is OTHERS.D. Essentially altcoin dominance in the market and an indicator of altcoin strength in the market.
Price is respecting a HTF uptrend since 2020, tapping into the HTF trend line which kicked off the prior altcoin seasons in the last cycles on each tap. Price is also coming into the HTF monthly demand range with high volume as price mitigates this area. We are also following the HTF bullish orderflow thats been established since 2020. Over the last few months price has capitulated into HTF demand, fulfilling all my targets and we are forming a range in key levels, whilst establishing some bullish orderflow on the daily timeframe from these lows and key levels.
I think based on the range profile on the daily, we are accumulating here in a local accumulation range, supported by high volume nodes on each wick into these levels, with a sweep of the range lows and now establishing bullish orderflow in the daily range from our HTF bullish levels where ive anticipated the HTF bullish reversal to form as covered in my prior forecasts and breakdowns.
I believe this is the start of a reversal setting up on OTHERS.D, from these HTF bullish levels and we should start to see the altcoin market pick up as this drives higher..
My first draws on LQ are at the 10.13% and 10.5% levels of this daily range.
Once price closes above the prior weekly swing high at the 10.5% level, this will confirm a new weekly HH and a shift in trend from the weekly timeframe, which should then follow into the monthly putting in a new HH in line with the HTF trend.
3M:
2M:
1M:
2W:
1W:
1M/1W/1D:
3D:
1D:

Be careful.Deep falls possible before expected bull run.
Don't make decisions with too much excitement.
Don't get carried away by social media.
* What i share here is not an investment advice. Please do your own research before investing in any digital asset.
* Never take my personal opinions as investment advice, you may lose all your money.

Is ALTseason Finally Back?ALTseason actually started already back in 2023, when we got a nice five-wave bullish impulse in the ALTcoin dominance chart with ticker OTHERS.D. It was first leg A of a three-wave A-B-C rally.
We have seen a slow down in the last couple of months along with the whole Crypto market and that's why most of the ALTcoins came lower than Bitcoin, but we can see a corrective (A)-(B)-(C) decline within wave B with the wedge pattern within wave (C) of B that can be coming to an end.
So if we are on the right path, then seems like new ALTseason may not be far away, especially if we consider that Bitcoin and the whole Crypto market are still bullish. However, to even think about the next ALTseason, we have to see ALTcoin dominance back above 10.55%, which is first bullish evidence for a higher degree wave C.
