OTHERS.D looks ready for strong moves on altAs we are seeing btc is moving strong and market shows retraces are over and they`re getting ready for the next ( real ) move
Alts/btc are going to celebrate !
this whole idea shows everything is going up till support Holds !
Other.d broke its resistance and pullback looks over , we are not predicting anything because this is not financial advice or target for any alt market this is just a idea that looks the future for this market
this well move till 2022 at least .
Othersdominance

Dominance And Alt-Party? 🎉🥳Hi everyone 👋🏽
🕊 Wish y'all have a profitable lifestyle 🍀
📌 BTC.D Weekly chart
📌 Price Action with Wave Analysis.
📍 Today I would like to talk and discuss more about the Bitcoin's dominance which has such a very complicated form...
📍 First off, in the weekly time-frame we can see a potential triangle with reasonable confirmations, like the re-tests and reactions to the triangle tend-lines as well as a POTENTIAL double bottom which can lead to a short to mid-term uptrend movement and be a confirmation for the POTENTIAL "D" wave.
✍🏼 I can clearly read from chart the upcoming dates are very important for Bitcoin's dominance and others dominance.
✍🏼 We may have 2 scenarios;
-----------> End of the current wave (C) so it means that we may receive more confirmations for (D) wave and start of new cycle
-----------> Continuing this wave which can change the whole game and cancel the TRIANGLE movement
To be continued ...

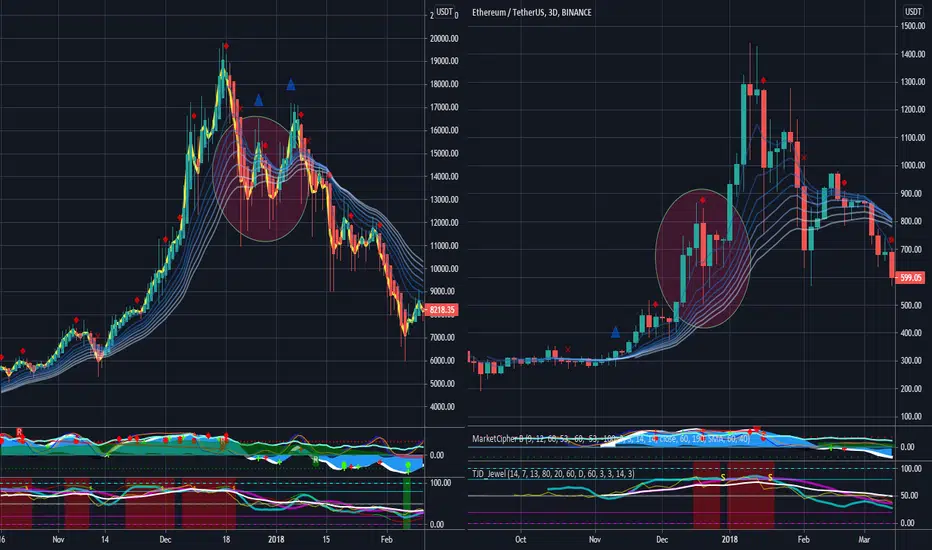
Let`s analyse ETH/BTC and ALTS/BTCHello guys in my previous idea about Others Dominance we have seen its moving up ...
so Eth/btc has broken above the pattern and looks like pullback is over and prices are trading above ema 50 and ma 50
i drew a support for this idea if this holds we move forward and we will see higher prices
if this not ,i drew for you guys next supports (i do not recommend to hold this one if this happens ! )
Overall this is attached to others dominance moves ... ( and whole alts/btc are attached to eth/btc ) !
so if we expect to see higher prices for eth/btc we are expecting to see higher prices for all alts/btc .
i say again this is a good support and shows us we will move higher or we break down !
i think this is 80% going up for all market !
---
This is just my idea and its not financial advice !
be aware of what you are doing and what you are trading !
Good Luck

OTHERS.D - ALTS - BE READY FOR BOX 4 AND 5Others Dominance is showing some strength at the start of box 4 to grow up more (in long term), which means Alts will grow more than BTC. I also think generally Alts perform better in the future as they are updating themselves with some great projects and facilities. I believe BTC will remain the king in the market but if it keeps going this way, its dominance will go down deeper and its market cap will shrink as a result.
Ehsan

There is a possibility of mutations in altcoinsWe will probably see an upward movement from the Altcoins

Altcoins season? look below may 6, 2021Bitcoin dominance has no support and the next support is between 35 and 40.
Alt coins dominance is currently 14.51, it is in safe position and there is no resistance in its path (Except for Fibonacci)
When the last Alt coins season happen and started in December 2017, BTC dominance was in a similar area and can say same thing about others.
BTC itself has a resistance which is its broken old bullish trend . Also USDT dominance is bearish for now which is a good point!
My opinion with all this is most likely... We may have an Alt coin season ahead.


GOOD TIME FOR EXIT LOW CAPSLooks like OTHERS DOMINANCE is at resistance. I am gonna minimize my portfolio. I have very tight stop loss now (%2) on every crypto asset now.

OTHERS.D HI everyone
Examining the indicators rsi=55.44 macd=want to cross up ichimokou=in 3day bull and the candellstick pattern (tweezer top ), it seems that we have an uptrend that has a trend up to the resistance lines or Fibo resistance of 127%, which shows the increase in the price of some low-marketcap altcoins.
love you

Market Cap OTHERSVery long term view
we are currently in a bull phase
looking to sell possible in January - June 2022
Before predicted bear market initiation

eth & altseasonbasically i we will have max 2 more positive waves in ethusdt and there it will end in 4-6 weeks in altseason so it is good to time to cash out some alts for usdt and than when it dips move to BTC


catching the final alts season after bitcoin top in 2021-2022just take a look how it happened in 2017-2018
What Is Going To Happen In ALT SEASON? 💃It looks like that Alt Season is started.. Every single parameter on BTC.D, TOTAL, TOTAL2, OTHERS.D and ETH/BTC shows this to us.. For example you could see a lot of Alt Coins were pumped yesterday as Bitcoin just was ranging.. But to make sure of this fantastic party in ALT Coins we should wait and see if the BTC.D weekly candle will be closed below 60% or not. If that happens, we can start the celebration of April..
But let's check some data to see what is going to happen is ALT SEASON, and what do I mean by "Celebration"??
Let's look at BTC.D weekly chart above:
As you can see, I made a clear time-line for you 28 DEC 2020 to 22 MAR 2021, that show us Bitcoin dominance came from top (73.55%) to around 60% and this is about 17.16% drop on dominance. This only 17.16 drop, made Ethereum to move from $900 to $2000. I'm sure you've seen what happened to other Alt Coins during this time-line...
By using Fibonacci and finding strong support lines, you can see that I predicted that this BTC.D drop will go down around 42.24% on Dominance.. Check out this folks, it'll be a 31.1% drop from now on.. This is going to be twice as what happened in bull market..
Now Let's check out the TOTAL weekly chart above:
This chart shows us how much money is in the crypto market.
I put the exact time-line as before, 28 DEC 2020 to 22 MAR 2021. As you can see, the time when the bull market was started, TOTAL chart shows us 678 Billion Dollars were in the market.. However, Let's check out how much money is in the market now?? AT the time that Alt Season is starting, there is 1.869 Trillion Dollars in the market and this is huge.. What is going to happen to this money when Alt Season is started? of course, This money is going to flow into the Alt Coins and again, THIS IS HUGE!!!
I used Fibonacci analysis on this chart to, and it shows us that in Alt Season TOTAL market is going to be al least but not last around 2.5 Trillion Dollars and this is 263.39% growth from when the bull market is started..
It's time for Shit coins, Let's look at OTHERS.D weekly chart below:
This chart show us the dominance of shit coins on the market.
And again the exact time-line as we spoke previously. OTHERS.D made a movement from 5.63% to 12.19% and that 120.87 growth. This is the reason why you've seen shit coin flew high in previous months.. If OTHERS.D can break this resistance are around 12% it can go up at least and again not last around 15.69%. This will be 177.17% growth since the bull market is started. This chart shows us if shit coins can capture 15% share in crypto market they will give us a huge amount of profit to us during ALT SEASON.. But be careful guys these kind of coins are dangerous, as the can give us big prizes the can make us harm in huge losses. So don't forget about your Capitol and Risk Management.
Our last chart to talk about is TOTAL2 weekly chart here below:
This chart is just like TOTAL, but it shows us how much money is in Alt Coin markets. That means everything except Bitcoin.
The same as above, 28 DEC 2020 to 22 MAR 21. At the time when Alt Coins bull market was started, there was 198.709 Billion Dollars in TOTAL2. At the end of the time-line there was 705.867 Billion Dollars and this is a 258.01% growth.. I'm interested!! What about you??
TOTAL2 managed to break it's resistance area upwards. Fibonacci analysis is telling us it can go to at least but not last around 1.118 Trillion Dollars. This is a huge 465.61% growth since Alt Coins bull market..
All These enormous numbers shows us, this ALT SEASON is going to be a lot different than what happened before in previous ALT SEASONs. I've been telling you about this ALT SEASON in my previous ideas, couple of months and weeks ago.. If you didn't read the I strongly recommend you to do that so, because there are a lot of important information for you to know in them.. I hope you can find this idea useful and make yourself ready for these huge numbers.. I will update this idea and of course I will post new idea.. So stay tuned for further details and information..
What is your point of view or analysis on ALT SEASON , I like you to share it in the comment section for me, so we can share our knowledge together.
And, As always, feel free to ask any question about this chart in comment section, I will happily answer you :)
If you like this idea, hitting like button, sharing it to the ones who will find it useful and giving me comment will give me a lot of motivation :)

ALT SEASON IS HERE DON'T SLEEP!June will be 4 years since the last Alt Season of 2017-2018. Four years of consolidation, and as you can see the Market Cap Dom. of all other coins has retraced back to the 0.382 line on Fibbonaci and is already heading back up.
Potentially parabolic, potentially 10x gains! DON'T SLEEP ;)
Thanks for your time! please like and follow!

OTHERS.D vs BTC.DOTHERS dominance chart in a possible inverted head and shoulders while BTC dominance is in a possible head and shoulders. The real ALT season begins when BTC dom breaks support.

BTC.D/OTHERS.D Comparison StudyAlts are in a much stronger position than many believe. Taking a macro view of BTC.D and Alts reveals BTC.D struggling to rise above the midline in a progressively tightening range while Alts enjoy being at the top of the range waiting for a breakout. BTC is being met with resistance, both from the midline but especially at the 64.25 level where the VPVR sits. BTC.D hasn't broken above it's upper boundary since JUJY 13, 2017!!! Alts are getting ready to do just that being way above support from the VPVR sitting at 6.67 and other levels. Expecting a nice breakout above the upper (and last) resistance line at 12.07 and continuing on to the ATH resistance at 12.58, confirming the inverse H&S pattern it's started on the WTF along the way with a right shoulder candle close above 12.18 to break neckline. That is an impressive 'V' shaped pattern showing a great deal of strength. It's only a matter of time until Alt season is in full swing and as strong as it will be I have no doubt we'll see many coins with 1000% or more gains. Enjoy it while it lasts. We are rapidly heading into uncharted territory, exciting times ahead!!! Alts ATH awaits!

OTHERS.D and ALTsaisonAlt season is in full effect.
Although cryptocurrency is generally in a bear market in March, I don't think that will be the case this year. The OTHERS.D chart looks too good. One thing to keep in mind that stable coins make up a significant component of this basket.
Bullish pennant on very long time frame. I'm expecting this to hit the top of the channel and then cool off for a few weeks after (where it then might be a good time to de-risk altcoins). One more pop to the upside then we are done for a while. We have had a great start to this year, but the party doesn't last forever! Do not be a bag holder.
If you were around in 2017-18, you know that Altcoins have the potential to bleed 99% of their value. Standout alts aside kept rising (e.g. LINK and THETA), but can you guarantee your alt is really that special?


OTHERS.D 1W-TIMEFRAME ANALYSIS✨OTHERS.D 1W-TIMEFRAME ANALYSIS✨
Hello ladies and gentlemen
This is my new idea for Altcoin Dominance index OTHERS.D
#ALTSEASON
I expect the price to move higher.
I hope my idea is clear
Support me by like and share
Stay Safe💯
Good luck💰


