$CLOV Finding The BottomThe bearish channel has broken to the downside and we are now in an unchartered territory. Within this unchartered territory, I expect every $0.50 to be a new support (i.e. $8.50, $8.00, $7.50, $7.00, and so on). As of the time that I am writing this post, we have broken the $8.50 support and found a $8.03 low.
It will be difficult to predict where we will find a bottom, but what I can tell you is that $CLOV is severely undervalued at this price. It was undervalued at $10, it is undervalued at $8.00, and it will still be undervalued if it dips below $8.00.
$CLOV recent earnings, albeit slower than expected, has proved that it is capable of growth. This will be a winner further down the road. However, if you are in this for a quick buck, $CLOV is not for you. But if you are an investor, do your fullest DD, strengthen your resolves, and buckle your seatbelts, because you are in for a rollercoaster ride until the negative sentiment surrounding $CLOV settles down. Regardless, $CLOV will be a winner for long-term investors.
Chamath Palihapitiya once said in a CNBC interview that Clover Health will be their next 10x in 10 years investment, and I truly believe $CLOV is capable of it.
This is not investment advice so please do your own due diligence!
Support this idea with likes and share your thoughts below.
Outlook

$CLOV Earnings OutlookFrom 2019 to 2020, $CLOV posted a total revenue growth from $462.3M to $672.9M, net premium revenue growth from $456.9M to $665.7M, decrease in net loss from -$363.7M to -$91.6M, and a decrease in adjusted EBITDA loss from -$175.5M to -$74.4M, among others. $CLOV also saw a 36.3% increase in membership and a 43.2% year-over-year increase in lives under Clover Assistant management to 58,056 membership and over 32,400 lives respectively.
For full year 2021 guidance, $CLOV stated a total revenue expectation of $820M to $850M, net loss expectation of -$210M to -$170M, adjusted EBITDA loss expectation of -$190M to -$150M, loss per share of -$0.52 to -$0.42. Furthermore, they are also expecting a 17% to 21% growth in Medicare Advantage membership to 68,000 to 70,000 membership compared to year end 2020's 58,056.
Based on the above full year 2020 financial results and full year 2021 guidance reported by Clover Health, I believe it puts us somewhere in the middle of our bear case and base case as said according to our last $CLOV Bear Base Bull outlook, which you can re-visit by looking at the related idea below.
In my opinion, despite being off-target, the financial and membership growth that they have posted from 2019 to 2020 has demonstrated their ability to deliver growth, proven the scalability of their business model, and reaffirmed Chamath Palihapitiya statement of $CLOV having a predictable growth model.
However, I believe they have shot themselves in their foot with the full year 2021 guidance. Based on the figures they have posted, it tells me that they are expecting a slowdown in growth compared to what they have experienced from 2019 to 2020. This will not be viewed kindly by investors and Wall Street.
Going forward, I expect $CLOV to continue trading within the bearish channel, within the range of $8.50 to $10.50. Unless further positive catalyst appears, I do not see $CLOV breaking above the bearish channel yet.
Nevertheless, in an environment where many SPAC and companies are trading at a massive speculative values, I see $CLOV being valued realistically at the moment and trading at a realistic price. Once given enough time to play out the growth that $CLOV is currently building, it will be a long-term winner.
TLDR: Short-term: Underperform with a trading range of $8.50 to $10.50 unless more positive catalyst appears, Mid/Long-term: Easily >2x from current price.
This is not investment advice so please do your own due diligence!
Support this idea with likes and share your thoughts below.

GBPNZD - WEEKLY OUTLOOK - MARCH - WEEK 1- 2021OVERALL BIAS = BULL
1. UP TO 1.97-1.98
2. UP TO 1.95 (FAVE)
3. DOWN TO 1.89
4. DOWN TO 1.865

$CLOV Bear Base Bull Outlook$CLOV continues to move within the symmetrical triangle while being encapsulated by a bearish channel. As we approach the end of the symmetrical triangle, I am expecting a breakout to by next week, as early as Monday.
I believe the upcoming earnings on 03/01/2021's post-market to be a major catalyst to which direction the breakout will be.
Bear Case: In the event that we get a negative earnings surprise, $CLOV will be headed further down into unchartered territory. The sell-off will likely be exacerbated by weakening market conditions and the lack of PR by Chamath Palihapitiya, Vivek Garipalli, and Clover Health Corp. Throw in the FUD created by the Hidenburg Research's short-seller report, and you have a recipe for a sell-off into the $7 and $8 territory. How soon we recovery from that will likely depend on the impact of the fiscal stimulus, whether there are any positive news released by Clover/Chamath/Vivek, and how long it takes for the short-seller report to be cleared up by the SEC.
Base Case: Earnings data come out as expected and there was no deviation compared to what was expected. Due to technical factors such as RSI pointing towards $CLOV being incredibly oversold, volume picking up again, and $CLOV currently being in an area of multiple huge support level, we see a push back to the dynamic resistance of the bearish channel. However, breaking above could prove to be challenging without positive sentiments around $CLOV. We might start consolidating between $10 to $11 or even re-test the dynamic support of the bearish channel.
Bull Case: Clover Health Corp releases a positive earnings surprise and Clover/Chamath/Vivek takes the opportunity to boost PR to create more positive sentiments around $CLOV. The aforementioned, supported by bullish technical indicators, pushes $CLOV back to the dynamic resistance of the bearish channel, subsequently breaking beyond it and holding above the bearish channel. As the fiscal stimulus comes in, we see money flowing into the stock market, and $CLOV continue to grow towards $14 and beyond.
TLDR: $7-$8 Bear Case, $10-$11 Base Case, >$14 Bull Case.
This is not investment advice so please do your own due diligence!
Support this idea with likes and share your thoughts below.

Outlook for US30 - Should be bearish nowUS30 finally turned bearish after a prolonged bullish period

Bitcoin 2021 Outlook with Pullbacks and Next ATHFollowing along from the last supercycle there will be a couple more ~30% pullbacks ahead before making a run at the next All Time High at near $250,000. This falls just past the Top Trend Line that has held for the last 2 ATHs in 2013 and 2017.

Weekly market outlook video! 2/22 - 2/26Here we go over last weeks outlook video as well as some stocks we are watching this upcoming week!


BITCOIN outlook and opinion for 15th February !-Price is definitely go down, it's just a matter of time when it will happen.
-Price don't walk in one direction, there must be a PULL BACK !

EG outlook for 15th February !Waiting for reject on 4h psihological and support level before taking long position !!

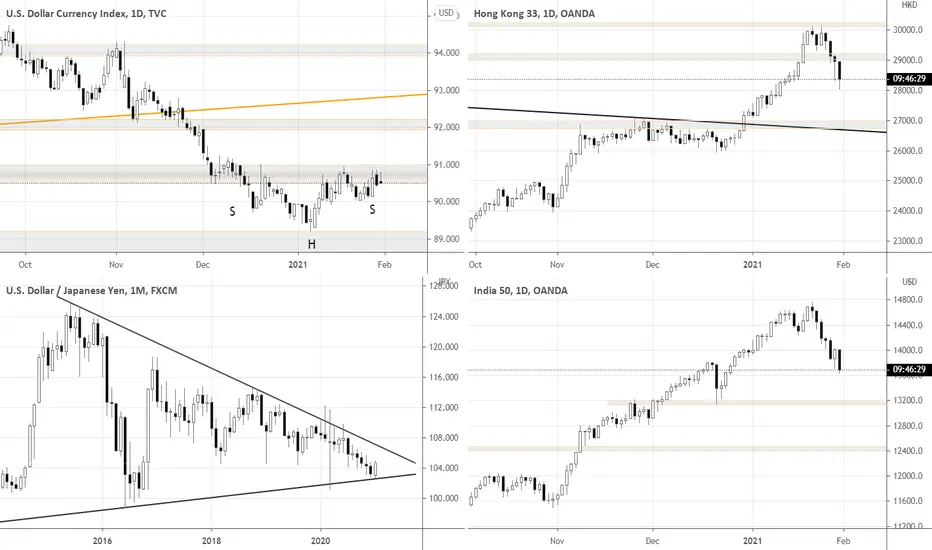
Weekly Market recap 17: rut into safe-havens?Overview: What's happening?
The risk assets have been confirming their short-term weakness and the need to correct and digest recent gains. We can see that most of the stock indices are in negative territory these days. The big technical picture of DXY also suggests possible upward momentum. We can expect the increased volatility in the Forex market in the upcoming months as USDJPY is approaching the long-term triangle's inflexion point.
What patterns are driving Forex?
DXY has formed H&S pattern on Daily timeframe, which is another evidence of a possible reversal, especially that it's formed around the long-term support. If DXY breaks 91.00, I want to be long on USD against some relatively weak currency.
USDJPY tells us the story of the approaching volatility storm in the Forex market. The pair formed a long-term symmetrical triangle. If the triangle breaks out in either direction, it will have a powerful impact on the market as both USD and JPY are safe-haven currencies.
No-brainer: short the weakest!
At this point, it's good to look for short-sell setups in indices. The logic is simple - consider the indices that got hit the hardest by the correction and historically have been underperforming relative to other indices. HK33HKD and IN50USD are good examples of such relatively weak indices. What's left is to wait for specific setups in these instruments according to your strategy. HK33HKD behaves interestingly - recently I mentioned it's been relatively strong for a short time due to capital inflows from Mainland investors. Now the underlying relative weakness came back and shrugged off recent sentiments of the Hong Kong market.
Summing up
There may be nice short-sell setups in indices these days. Watch out for the breakouts of the key levels in DXY and USDJPY and proceeding volatility.
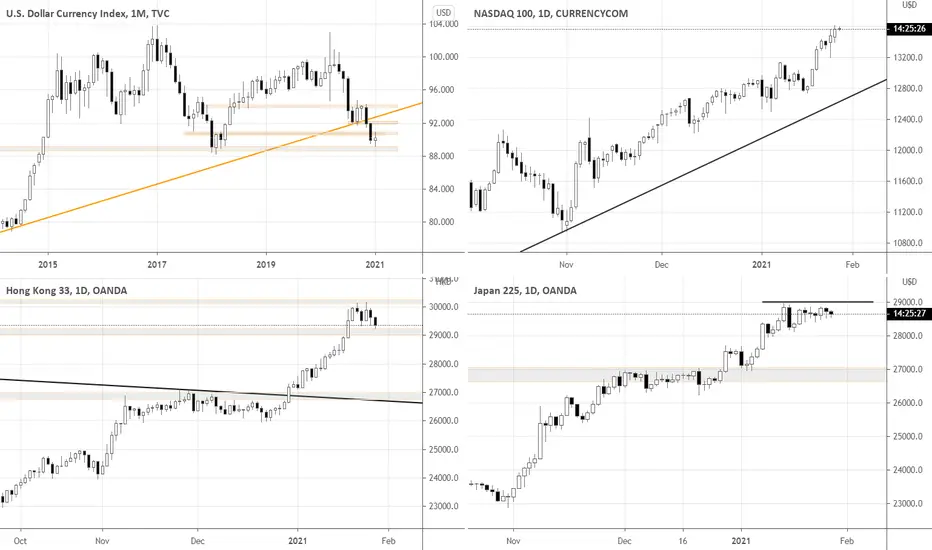
Weekly Market recap 16: Preparing for the next leap. Global view: What's happening?
While global coronavirus cases rise to 100 million, the risk assets keep rising as well! DXY remains relatively neutral, as it's range-bound between ~90.75 local resistance area and ~88.75 long-term support. I'd confidently consider trades in USD related pairs once DXY breaks either of the range borders. For now, it's better to abstain from USD trend continuation setups.
Meanwhile, major stock indices form trend continuation patterns. The consolidation period in the global markets is the best time for the quality trend setups in the relatively strong indices.
Betting on the strongest
I picked three strongest indices at the moment: US100, JP225USD and HK33HKD.
You can see that the American tech index has already recovered from the pullback and makes new highs, while the leading Asian indices are consolidating. Nikkei has been in momentum since it's come out from the 30-year range. Chinese economy looks best during the pandemic compared to the rest of the world. Initially, China A50 index, which represents China Mainland companies was relatively stronger than the Hang Seng index as the political situation in Hong Kong affected the latter one.
Now, investors see the discount that appeared in Hong Kong stocks priced higher in Mainland exchanges, which motivates big flows of investments back to Hong Kong. It resulted in the short-term relative strength of Hang Seng compared to China A50.
Trading tactics for buying Indices
1. The strategy in Asian indices is simple - buy the breakout the market closes above the recent consolidations (HK33HKD - above 30000; JP225USD - above 29000).
2. Although the best entry in US100 could be the breakout of 13200, I guess it still makes sense buying it intraday for a short-term momentum gain.
Conclusion
There is not much going on in FX market right now as USD keeps being bound in the range, meanwhile the major stock indices present trend continuation opportunities.

Weekly Market recap 11: Getting ready for the next legWhat's happening
We've been consolidating for two weeks already, with the last week being more of downward pressure. The broad markets are consolidating near their respective resistance/support areas. The ultimate event I'm waiting for is the breakdown of 90.50 support and the continuation of the downtrend in DXY. I believe when we see that breakdown, the trend momentum opportunities will come in many fx pairs and stock indices.
Strategy
During the consolidations like now, it pays off to be patient and particularly picky, as the moves tend to be not lengthy and often choppy. For breakout traders, it's better to focus on the short-term consolidations with the numerous confirmation signals from the price action, and conservative profit targets.

USDCHF: Bullish Forecast & Outlook
USDCHF reached a strong demand zone
Based on our outlook the USDCHF will rise
to the underlined supply zone.
Like, comment and subscribe to our TradingView Page.

Weekly Market recap 9: First signs of actionGeneral overview - Asia leads
FX market and the Western Indices were incredibly boring last week, with DXY, DAX and S&P500 staying in the consolidation. Asian markets continued to advance. In SG30SGD (Singaporean index), you can find some of the smoothest and strongest uptrends. The Singaporean market seems to be relatively strong, along with India, Australia and Japan, with a recent pullback present only in Nikkei (Japan).
FX: More volatility overall and the strength in NZD
With the recent data releases in the US, DXY got spurred to more volatility. So, we might see a directional move this week. It would be more interesting if the market closes at or below 92.00.
NZD remains a relatively strong risk asset, especially after positive Retail Sales data yesterday.
Western Indices
While the Western stock indices keep consolidating, some of them formed nice patterns, like DAX, for example. A breakout from such pattern can present potential opportunities to ride a meaningful proceeding trend (the breakout might be happening already!). The US Indices continue to be relatively weaker, compared to the European ones. I'd be particularly cautious going long in S&P and NASDAQ. Brent broke out from the triangle and pushing higher, confirming the risk-seeking sentiment, so there should be a hidden strength in Indices overall.

Price Outlook - USDCAD - 8HThe pair is within a bullish flag and is currently testing the resistance of the flag. The last candle pattern on the pair seems to be a three line strike, if the pattern follows through we may see the pair rally towards the next resistance zone then attempt to break back into the wedge with the aim of testing its resistance. If the patterns fails we could see the pair drop towards the support zone and decline towards the next major key level.
If you liked this price outlook make sure to give us a thumbs up, leave us a comment and make sure to follow us for outlooks 👍❤

Price Outlook - GBPUSD - 8HThe pair can be seen within a rising wedge and seems to be within the resistance zone of a key level. A break above this level could indicate a further buy whereas a rejection could be the initiation of a downtrend. We'd need to monitor the pair closely for accurate predictions.
If you liked this price outlook make sure to give us a thumbs up, leave us a comment and make sure to follow us for outlooks 👍❤


Weekly Market recap 8: Are markets preparing for the advance?Mixed west with strength in Asia
The week started with mixed markets. The US and European markets are still digesting gains staying in the range near their respective key resistance areas.
Asian markets show some signs of strength following NIKKEI's recent powerful breakout from the long-term range. Smaller markets like India, Indonesia, Singapore also show positive dynamics compared to the US and Europe. It seems like the risk-seeking sentiment is there, although it didn't get to manifest itself in the west yet.
What's next?
Looking at DXY declining for three consecutive days, it makes sense that inflows into the risk assets continue. Let's see how DXY will behave near the local low at 92.15 and eventually at the last line of defence of DXY at 91.75. This period requires additional patience and selectivity in setups and instruments in FX and major western indices. Although, for those willing to try Asian markets, there is an established trend environment to try out.
