WMT Bearish Divergence set to take it back to 85'sBearish Divergence formed at the outer Bollinger Band extreme. Divergence shown on RSI, Mac-d signal lines, and histogram. Today put in the first lower high on the histogram along with price creating a reversal candle on above average volume. Looking for a drop back to light support level.
Overbought-oversold

Anticipatory layout with important trend lines, levels, timefibsWe might be cought in sideways within the red channel for another 20 days.
I look at the Willy or MAGNUS™ indicator and compare it to a similar situation we had a couple months ago.
The yellow box had some rangebound action in it with a little breakdown in the middle ( just like we had it now ).
The question is what will happen after the yellow box? The red box like last time?
Then we will definitelly see 280 again.
Or if 320 holds (looks like some strong demand is sitting there),
we'll see another pump like seen in the last green box !
Also check out the time fib analysis :
0.382 & 0.618 were important points in time, so 1 will probably be important too! Likely a major low/high in price.
The target for a bullish move is the thick blue dashed line, which is this years top resistance trend line. You can expect sellers there.

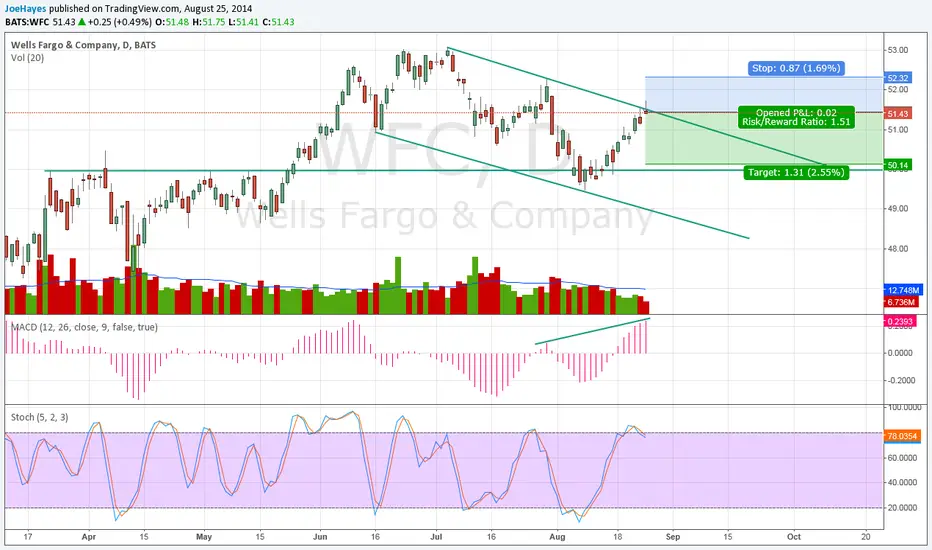
WFC Rejected at Trend LineWFC bouncing off trend line yesterday and today again to form a shooting star. There is some hidden bearish momentum divergence seen on the histogram, and the stochastic is coming out of overbought levels without price having broken the previous swing point high. This does look like a bull flag forming, but I am looking for one more move down to retest support before the next move up. Profit target right in front of support for a healthy 1:1.5 R/R ratio.