NZD/CHF Sell Opportunity RSI shows overbought on 4 hour timeframe. Possible 100+ pip move. Covid19 not looking as good in New Zealand.
Overbought

SPX up over 100% in a year and a half?!Seriously?! look at that rise. Are company stocks REALLY worth these levels of valuation? Would love to hear discussion on this.

ES Overbought, Again...and again.. and again...Looks just like it did in May and June before the mini-bears. MFI + RSI both peaking. Stupid new ATH. Can it get higher?! OFC!
Closed out my SPY 465 October vertical 465/480 spreads by buying the short legs back for a $1K credit in early trade; I held the long 480 calls and re-entered today at the ATH, now short 20 October 462s and 50 October 467s for a net credit $9k. The 462s sold for >$2, more risky, juicy premium.
So I got to use my long call legs twice, they are paid for! Neat trick, in parlance; 'legging into position.'
The 467s are $18 OTM, after a long run-up like this these are likely to favor the seller IMO.
NB: Selling calls entails considerable risk and is NOT a suitable strategy for most day traders! You can lose a lot more than you get in credits.
Remember on 9 Nov when the damned thing gapped up 150 pips?! That's risk!! Short-sellers wiped out on opening gap, OW!!
A monster gap seems unlikely at this price, but do NOT sell VCS into price weakness! Killer Rallies can wipe you out in minutes.
Sell put spreads on weakness, if you dare.
Trade at your own risk, GLTA!!

Kroger has history on its side for downward movementThis article includes bonus analysis of semi-rare occurrence. My Algorithm 2 has signaled a SELL 9 times on the daily chart for this stock. All nine times included simultaneous SELL signals on the same algorithms which triggered this morning. I have provided the usual target boxes, however, I have included additional target boxes related to historical movement after Algorithm 2 signals SELL.
Based on historical movement, the peak could occur anywhere in the larger red box. The final targets are in the green boxes. The pending bottom should occur within the larger green box as has been the historical case. Half of all movement has ended in the smaller green box. In this instance, the signal indicated SELL on August 24, 2021 with a closing price of 45.75.
If this instance is successful, that means the stock should decline to at least 45.28 which is the top of the larger green box. Three-quarters of all successful signals have the stock decline 3.041% from the signal closing price. This percentage is the top of the smaller green box. Half of all successful signals have the stock decline 5.724% which is the end point of the black dotted arrow. One-quarter of all successful signals have the stock decline 10.385% from the signal closing price which is the bottom of the smaller green box. The maximum decline on record would see a move to the bottom of the larger green box. These are the same concepts for the levels in the red boxes as well.
The ends/vertical sides of the boxes are determined in a similar fashion. The trough of the decline can occur as soon as the next trading bar after signal close, while the max decline occurs within the limit of study at 35 trading bars after the signal. A 1% decline must occur over the next 35 trading bars in order to be considered a success. Three-quarters of successful movement occur after at least 7 trading bars; half occur within 14 trading bars, and one-quarter require at least 25 trading bars.
The black dotted arrow represents median historical movement. Medians are a good metric, but they are just one of many I use when forecasting future movement.
As always, the stock could decline the very next bar after the signal without looking back (therefore the red boxes would not come into play) or the stock may never decline (and the green boxes may never come into play).

RSI flashing overbought for CDNABased on historical movement, the peak could occur anywhere in the larger red box. The final targets are in the green boxes. The pending bottom should occur within the larger green box as has been the historical case. Half of all movement has ended in the smaller green box. In this instance, the signal indicated SELL on August 25, 2021 with a closing price of 78.47.
If this instance is successful, that means the stock should decline to at least 76.99 which is the top of the larger green box. Three-quarters of all successful signals have the stock decline 3.886% from the signal closing price. This percentage is the top of the smaller green box. Half of all successful signals have the stock decline 10.0% which is the end point of the black dotted arrow. One-quarter of all successful signals have the stock decline 15.694% from the signal closing price which is the bottom of the smaller green box. The maximum decline on record would see a move to the bottom of the larger green box. These are the same concepts for the levels in the red boxes as well.
The ends/vertical sides of the boxes are determined in a similar fashion. The trough of the decline can occur as soon as the next trading bar after signal close, while the max decline occurs within the limit of study at 40 trading bars after the signal. A 0.5% decline must occur over the next 40 trading bars in order to be considered a success. Three-quarters of successful movement occur after at least 10 trading bars; half occur within 25 trading bars, and one-quarter require at least 31 trading bars.
The black dotted arrow represents median historical movement. Medians are a good metric, but they are just one of many I use when forecasting future movement.
As always, the stock could decline the very next bar after the signal without looking back (therefore the red boxes would not come into play) or the stock may never decline (and the green boxes may never come into play).

Bearish MACD Crossing with RSI OverboughtTh coin moves around alot and i'm assuming it's gonna be moving even more really soon: The MACD is crossing bearishly and the RSI is just now coming off of being extremely overbought. I'd like to see another straight move down

SPX is INSANE!! . . annnd Slightly Overbought?I mainly trade crypto but after having seen some parity with Bitcoin and SPX, I figured I'd drop this and see what comes back up. Would love to hear feedback on it but my general sentiments are that this thing looks toppy as H E Double Hockeystick!! I recently saw that margin debt is at an all time high, stocks as a % of household financial assets is also at an all time high and the Buffet indicator of composite value to GDP was about 90% higher than the long term trend of "fair valuation" which would be closer to 120% vs. the current 230% as of a recent reading.
DYOR of course and don't take this as investment or financial advice but man, I'd be taking some off the table and putting it into something a bit more tangible.
Good luck!
“All models are wrong, but some are useful.”
~ George E.P. Box

SELL FOR EURUSD 88 PIPSThis market has been in a downtrend and will continue to follow structure. It bounced off of my trendline and rejected major resistance. This is very bearish on top of it being overbought. There were bearish engulfing candles that showed signs of strength for the bears. There were large wicks forming on the smaller time frame as well. It is also showing it hit an important point on the FIBONACCI which shows a perfect touch of the .618. All of these signs show a downtrend and we will enter based on these confluences.

Sell for USDCHFWhy is this a sell? Market has been trending up for days and the market loves structure. This broke through resistance without a pullback.
Due this move upwards it needs to find grounding to validate its move up. This means it will retest our support line to see if this move was valid or not.
Think of the forex market like a rubber band. You can stretch it but it always comes back to its original structure.
The stochastic is overbought and the macd is showing signs of weakness. This will be a good 67 pip sell.

Bitcoin rising wedge on 4H Looks like on 4H Bitcoin is a little bit overbought. I think we are in rising wedge and if we reach $48-50k zone we can get reject and to appear big sell pressure. I still think we can reach higher levels without seriosly correction, but pullbacks like 10-15% are healthy in my opinion. We can break $50k without retest but i don't think is likely this scenario.

QQQ Bear Diagonal Put Spread Sept 368/Aug 27 356Hedged put position just took ten spreads on Friday 13th for net debit $7. NOT recommended for fainthearted, Big risk/big reward (maybe).
There is support at former resistance ~342 - 345, targeting. Index is overbought and struggling to break above 370. GLTA!

Bearish Divergence(NKE) Although NKE has been steadily increasing, we are seeing signs that a turn towards the downwards may be soon. The greatest indication of bearishness is the divergence that we are seeing between the prices movement and the momentum. What signifies a great entry for PUTS is the sell signal given by the Willy Oscillator. Due to a massive bearish sign, I see a target to 150 as a great place to consider cashing out your puts due to it being the 0.5 Fibonacci Support. If we keep getting bearish signs a target to 135 will be made since that was where the gap up started.
Bearish Signals
-Squeeze Indicator(4h)
-Bearish Divergence
-Willy Oscillator
Fibonacci Price Targets
-1st 164
-2nd 156
-3rd 150
-4th 144
-5th 135

Overbought weekly RSI with (daily) divergence in OBV and RSI14As the two mentioned indicators confirm each other AND the weekly RSI is also overbought I risk a little short position. Nevertheless, market could move higher anytime so I would only risk 1% with this first trade. If there is a new a high and I get stoped out I would risk another position if there are signs of weaknesses.
If the short plays out well I would try to make the trade even bigger! ;)
Caution: Trade against mid- and long-term trend! Stop-loss is beeing moved closer if there is a chance. :)

Overbought Consolidation of S&P E-MINIS&P looks to be repeating the same overbought consolidation that leads to a breakout into the upper band of the BTFD (Buy the Fkn Dip) Channel.
This seems to occur when everyone is expecting a market correction / BTFD opportunity.
Most note worthy was in Aug-Sept 2020 that followed the exact same pattern followed by a 10% correction.

Put Opportunity (ABT)ABT has been continuously failing to push above a Fibonacci resistance while also showing more signs of bearishness. The greatest of them is the divergence that can be seen from the Squeeze Momentum indicator. If a stock is increasing than the stocks momentum should also increase but for this case, that is not true. Another indication of bearishness is the Willy Oscillator giving a signal to sell, due to the stock being overbought.
Bearish Signals
-Bearish Divergence
-Willy Oscillator
-Fib Resistance

PFE predictionPFE seems to be overbought soon, enter short.
Target I estimate is first $46 than $45, but the secodn target needs to be checked later again.

UAA predictionUAA hihgly overbought and the shorts are around the conrer.
On the short term we could bounce back to $20.

30 Minute bearish Bat PCZ Approaches: RSI Will Be OverboughtRSI will likely be overbought by the time we reach the PCZ i will be preparing to enter my position when it gets there.

Audusd sell! Bearish marketWe have seen a huge rally up to resistance however we cannot break through. Most of the bulls have taken profit and it is overbought on the 4 hour. We can expect to see a move down to support if it breaks the maroon trendline. We are still in a bearish market and this only proves we will continue follow structure.

RSI Bearish Divergence at 1.618 Log-Scaled PCZ of a Bearish CrabVery Similar to the Bearish Log Scale Butterfly i found on Bitcoin. This setup however does not have the best risk to reward due to the high volatility of this coin. i suggest that if you trade it not to risk a huge amount of cash.
Daily RSI Overbought At The Top of a Trading RangeNothing Very special about this setup just a range.

STRONG SHORT 🔴 Lenin Would Be Proud Of This Short STRONG SHORT 🔴 Lenin Would Be Proud Of This Short
We were one of the first traders who called short (26 July) when BTC spiked above $40k, and everyone else was calling ATH, moon, and bull run.
You asked me if the idea ("All-in BTC Short 🔻 TP: $31 700, x10") was still valid: Yes, it's still correct.
So, this is a clean remake of the same idea to reinforce our position.
🔴 KEY POINTS:
- RSI is strongly overbought
- Momentum hit RSI Resistance
- Price Action hit Historic Resistance
- Machine Learning (Artificial Intelligence, Linear Regression ) says upcoming Resistance
- Bitmex Funding Rates favor short positions
- Bitmex Troll Box is overbought (90% long)
- Bitfinex whales started to short
- Okex Top Traders have more shorts than longs
- Chart Pattern: This Technical Indicator Variation worked 100% in the past
We've got BTC short. All-in.

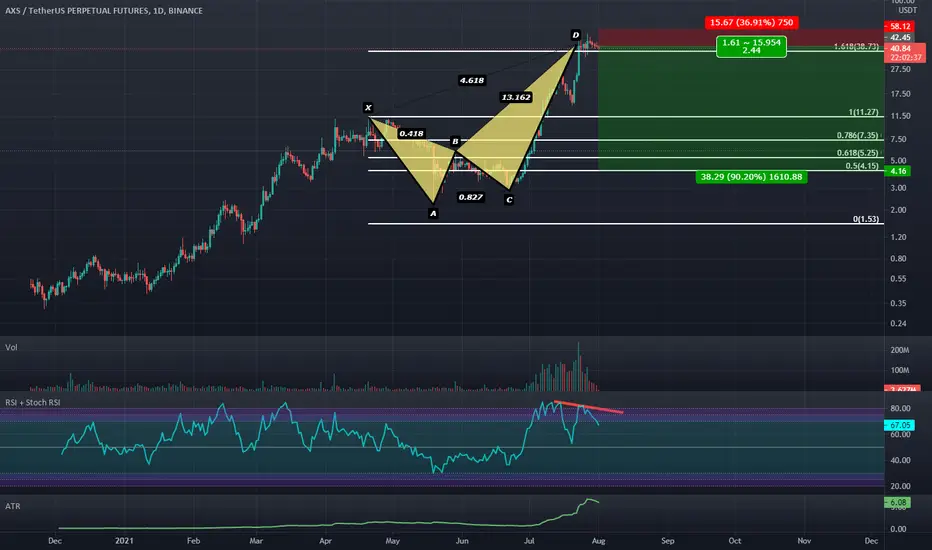
PCZ of Bearish ABCD Reached; Weekly RSI Overbought.We have reached the PCZ of a bearish ABCD on the weekly and have reacted to it and now the RSI is overbought and we may be due for a correction back down to around C.
