GBPCHF - Bull No More!Hello TradingView Family / Fellow Traders. This is Richard, also known as theSignalyst.
📈From a medium-term perspective, GBPCHF has been bullish trading within the rising channel marked in blue.
This week, GBPCHF has been approaching the upper bound of its channel.
Moreover, the red zone around $1.115 is a strong support turned resistance.
🏹 Thus, the highlighted red circle is a strong area to look for sell setups as it is the intersection of the upper blue trendline and resistance.
📚 As per my trading style:
As #GBPCHF approaches the red circle zone, I will be looking for bearish reversal setups (like a double top pattern, trendline break , and so on...)
📚 Always follow your trading plan regarding entry, risk management, and trade management.
Good luck!
All Strategies Are Good; If Managed Properly!
~Rich
Disclosure: I am part of Trade Nation's Influencer program and receive a monthly fee for using their TradingView charts in my analysis.
Overbought

DAX Resistance Ahead! Sell!
Hello,Traders!
DAX is trading in a strong
Uptrend, recovering itself
From the trade-war lows
And the index is locally
Overbought so after the
Retest of the horizontal
Resistance above at 22,500
We will be expecting a local
Bearish correction
Sell!
Comment and subscribe to help us grow!
Check out other forecasts below too!
Disclosure: I am part of Trade Nation's Influencer program and receive a monthly fee for using their TradingView charts in my analysis.

SILVER Bearish Bias! Sell!
Hello,Traders!
SILVER is already making
A local bearish pullback
From the horizontal resistance
Level of 33.20$ which is happening
After a strong bullish move up
Which temporarily took Silver into the
Overbought territory so we are locally
Bearish biased and we will be
Expecting a local bearish correction
Sell!
Comment and subscribe to help us grow!
Check out other forecasts below too!
Disclosure: I am part of Trade Nation's Influencer program and receive a monthly fee for using their TradingView charts in my analysis.

AERGO: Golden Pocket Hit – Crash Incoming?On April 3rd, AERGO hit a historic low of $0.04746—and just 13 days later, it's trading around $0.60, an astonishing +1500% surge in less than two weeks. The rapid rise begs the question: What are the bulls aiming for next, and how sustainable is this move?
Key Observations:
Explosive Rally:
AERGO’s meteoric move from $0.04746 to $0.70 in just 13 days has propelled the coin into uncharted territory. Such a dramatic spike is not only eye-catching but also raises concerns about overextension.
RSI Overbought:
The daily RSI sits at 98, indicating extreme overbought conditions. This level suggests that the current rally is unsustainable and may be ripe for a pullback.
Historical Resistance Levels:
Looking back at 2021, key highs were established around $0.60 to $0.62. These levels serve as critical resistance zones.
Fibonacci Confluence:
Taking the Fibonacci retracement from the low at $0.04746 to the previous rally's high at $1.0809 (April 13, 2024), the 0.618 level is projected at $0.68613. The bulls just tested that golden pocket.
Trade Strategy & Potential Setups:
For Longs:
With the market showing signs of being overbought (RSI at 98) and the explosive move possibly winding down, this may be the perfect opportunity to take profits rather than accumulate further.
Take Profit Consideration:
Target: Near the 0.618 fib retracement at $0.68613.
Observation: If bulls push beyond this level, the move might extend — however, the risk of a sharp pullback is high given current overbought conditions.
For Shorts:
A corrective move is very much on the table, and traders looking to short should focus on the key resistance zone between $0.60 and $0.70.
Short Setup:
Entry: Look to initiate shorts near the $0.60–$0.70 zone.
Target: $0.4 and $0.2 as take profit targets
The Big Question:
Will AERGO drop as sharply as it surged? Given the extreme overbought conditions and the rapid, unsustainable spike, a healthy—and perhaps brutal—correction seems very possible. Keep a close eye on volume and price action near the $0.60–$0.70 resistance zone and be ready to adjust positions accordingly.
Anyone riding this wave has experienced one of the wildest moves in recent memory. For those in long positions, consider taking profits now; for potential short traders, watch those key levels tightly. The market's rhythm will soon reveal its next chapter.

Another tariff u-turn: Oil overbought on news? President Trump announced a 90-day pause on reciprocal tariffs for countries that have not retaliated, sparking a sharp rally in U.S. markets. The Nasdaq 100 led gains with a 12.2% surge. The U.S. dollar also strengthened against safe-haven currencies such as the Japanese yen and Swiss franc.
Crude oil prices rebounded alongside equities, with oil futures rising more than 4% to trade above $62 per barrel.
However, the strength of the oil rally may be overstated. China, one of the world’s largest oil consumers, was among the first to retaliate against U.S. tariffs. Tensions between Washington and Beijing have worsened, prompting the U.S. to raise tariffs on Chinese goods to 125%.
Adding to the caution, analysts at Goldman Sachs revised down their 2026 average price forecasts for Brent and WTI, citing rising recession risks. The bank now expects Brent to average $58 per barrel and WTI to average $55.

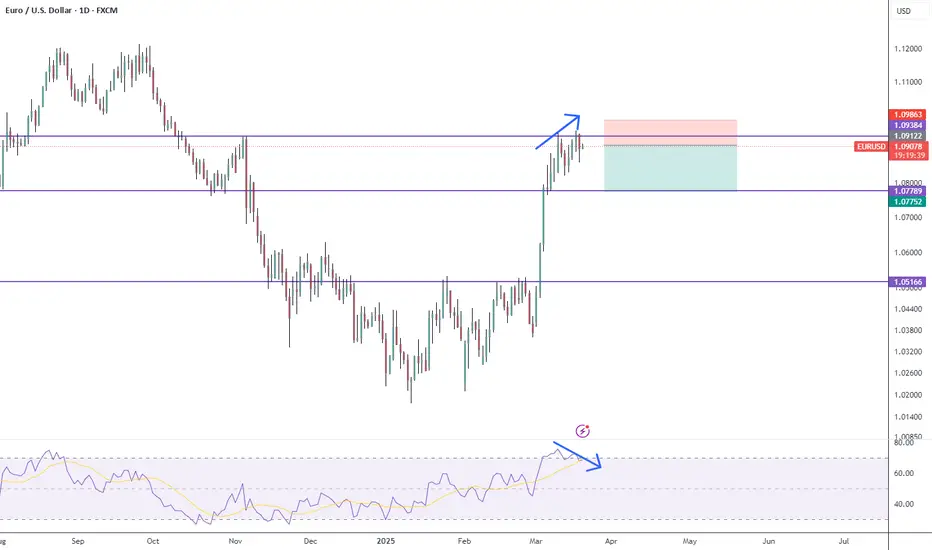
Quick pull backBearish divergence between the pair and the RSI and also is overbought. The pair is hitting and important resistance level. I expect a pull back to the level shown on the chart and maybe lower. SL triggers only if a daily candles closes above the resistance with great volume.
EUR-GBP Resistance Ahead! Sell!
Hello,Traders!
EUR-GBP keeps growing in
A strong uptrend but the pair
Is already overbought so after
It hits a horizontal support
Level of 0.8473 we will be
Expecting a local bearish correction
Sell!
Comment and subscribe to help us grow!
Check out other forecasts below too!
Disclosure: I am part of Trade Nation's Influencer program and receive a monthly fee for using their TradingView charts in my analysis.

EUR-AUD Strong Resistance Ahead! Sell!
Hello,Traders!
EUR-AUD surged up sharply
And the pair is locally overbought
So after it hits a horizontal resistance
Of 1.7190 from where we will
Be expecting a local bearish
Correction and a move down
Sell!
Comment and subscribe to help us grow!
Check out other forecasts below too!

Most overbought in 10 years !? I've used 3 forms of technical analysis to make a case for a major top forming in the European markets. If this turns around, it could lead to a 10% selloff very quickly and if this transforms into a bear market then 20% drop is totally on the cards. Nothing goes up forever.

The EURCAD currency pair has reached a critical resistance levelThe EURCAD currency pair has reached a critical resistance level at 1.505, signaling an opportunity for selling.
From technical side
This pair has recently encountered strong resistance near the 1.500-1.505 area, where it has failed to break above these levels multiple times.
RSI has consistently been overbought territory above the 70 level. Euro is now overextended and due for a pullback.
From fundamental side
Recent economic data from the Eurozone has shown signs of slowing growth, with inflationary pressures remaining above the European Central Bank's target, potentially leading to a more dovish stance in future monetary policy.
On the other hand, Canada's economic outlook has been more resilient, with solid GDP growth, rising oil prices, and an increasingly hawkish tone from the Bank of Canada.
First Target: 1.498 area being 0.382 retracement level
Second Target: 1.493 area being 0.618 retracement level in conjunction with previous top

BTC Potential Drop to $72K: 3 Signs Indicating a Trend BreatherBitcoin has been on an incredible run, but I believe we may be heading for a pullback toward $72K. There are three key signs that suggest a breather is due:
Double Top Formation – We've seen a clear double top pattern forming, signaling a potential reversal.
RSI Divergence – The RSI is showing divergence from price action, often a sign that the momentum is weakening.
Overbought Conditions – Bitcoin has been in overbought territory for a while now, suggesting that a correction could be on the horizon.
Keep an eye on these factors as they could play a big role in where BTC goes next. Stay cautious and be prepared for potential volatility.
I hope you find it helpful!
Take care and keep it shiny.
Kina ♥

Overbought price, overbought positioning is not a good signThis analysis shows warning signs of gold's uptrend could potentially see a solid correction over the coming weeks.

How Do Traders Identify Overbought and Oversold Stocks?How Do Traders Identify Overbought and Oversold Stocks?
Identifying overbought and oversold stocks is a key part of technical analysis for traders. These conditions occur when a market’s price moves to extremes—either too high or too low—compared to its recent performance. By recognising these signals, traders can spot potential turning points in the market. This article explores what overbought and oversold stocks are, how to find them using technical indicators, and the risks involved in trading them.
What Is an Oversold Stock?
Oversold stocks are those that have experienced a significant price decline, often beyond what might seem reasonable based on their underlying value. This often happens when market sentiment is overly negative, even if the company’s fundamentals remain solid.
Several factors can lead to a stock becoming oversold. For instance, bad news about a company, such as a missed earnings report or legal troubles, can cause investors to sell off shares quickly. Broader market events, like economic downturns or changes in industry regulations, can also drive prices down across the board. Sometimes, even strong stocks get caught up in these waves of negativity.
The concept of overselling isn’t just about price falling, though—it’s about the potential for a reversal. When stocks fall too fast, too far compared to their actual financial performance or growth potential, this is where traders look for opportunities, analysing whether the market is poised for a potential recovery.
What Is an Overbought Stock?
Overbought stocks are those that have risen sharply in price, often to a point where they may no longer reflect the stock’s true value. When a stock is considered overbought, it means there’s been a lot of buying activity, pushing the price higher than what its fundamentals might justify. This often happens when market sentiment is extremely positive, driving demand even when shares may already be trading at high levels.
Several factors can lead to an overbought market. Sometimes, positive news about a company—such as strong earnings, new product launches, or positive analyst reports—can spark a wave of buying. Market-wide optimism, particularly during bullish phases, can also lead to an overbought stock market. Speculative buying, where traders hope to capitalise on short-term price movements, can further inflate the price.
Being overbought doesn’t necessarily mean the stock is due for an immediate correction, but it does suggest that the price may have gone too high, too quickly. The most overbought stocks are often viewed as being in a vulnerable position for a potential pullback, especially if there isn’t enough underlying support from the company’s financial health or growth prospects. Traders consider this an opportunity to sell stocks at potentially good prices.
How Traders Find Oversold and Overbought Stocks with Indicators
Traders use technical indicators to determine whether a stock might be undervalued (oversold) or overvalued (overbought) based on its price action. These indicators allow traders to assess whether a price movement has gone too far in one direction.
Technical indicators are tools that use historical price and volume data to measure things like price momentum and trend strength. When it comes to finding overbought or oversold stocks, momentum oscillators play a key role.
These oscillators measure the speed and magnitude at which an asset’s price is changing. If a market has been rising or falling too quickly, it could be a sign that it’s either overbought or oversold. Also, if a stock has moved too far away from its typical price range, it signals a possible reversal. Traders rely on indicators to determine when the price may be at an extreme, helping them find entry or exit points based on market conditions.
Now, let’s break down some of the most popular indicators used for this purpose.
Relative Strength Index (RSI)
The Relative Strength Index (RSI) is one of the most widely used overbought and oversold indicators. The RSI is a momentum indicator that gauges how fast and how much a stock's price is moving. It gives traders a visual signal of when a stock may have been pushed too far in either direction.
RSI compares the magnitude of recent gains to recent losses to assess whether a stock is overbought or oversold. The indicator ranges from 0 to 100 and is typically used to evaluate whether a stock is moving too fast in either direction. If the RSI falls below 30, the stock is considered oversold, suggesting it could be undervalued and due for a bounce. If the RSI rises above 70, the stock is seen as in an overbought zone, potentially signalling a price correction on the horizon.
While RSI can be helpful, it’s essential to look at it in the context of the broader market. For example, in a strong bull market, a stock might remain overbought for an extended period. Similarly, during a downturn, stocks can stay oversold longer than expected.
Stochastic Oscillator
The Stochastic Oscillator is another momentum indicator. It compares a stock's closing price to its price range over a certain period. The idea behind this indicator is that in an uptrend, prices will close near their highs, and in a downtrend, prices will close near their lows.
The Stochastic Oscillator helps traders identify when a stock’s price has potentially moved too far in either direction relative to its recent range. It’s similar in principle to the RSI, except the Stochastic is considered more useful for detecting shorter-term reversals.
It’s especially useful for identifying overbought and oversold conditions because it moves within a range — between 0 and 100 — similar to the RSI. The Stochastic Oscillator is made up of two lines: %K, which is the primary line, and %D, a moving average of %K. When these lines are above 80, the stock is considered overbought. When they are below 20, it’s considered oversold.
Given its sensitivity, it’s common to see the Stochastic signals a market is overextended for a longer period when there’s a strong trend. This makes it more prone to false signals than the RSI or MACD indicator and typically more useful for trading pullbacks in a broader trend.
MACD (Moving Average Convergence Divergence)
The Moving Average Convergence Divergence (MACD) is another popular overbought and oversold indicator. Unlike the RSI, which focuses primarily on oversold vs overbought levels, MACD is more about trend strength and its direction. It shows the relationship between two moving averages of an asset’s price and can help identify potential shifts in momentum.
The MACD consists of two lines: the MACD line (which is the difference between the 12-day and 26-day exponential moving averages) and the signal line (the 9-day moving average of the MACD line). When the MACD line crosses above the signal line, it indicates a potential bullish reversal. When it crosses below, it signals a bearish reversal.
Since the lines are based on the difference between two EMAs, it’s also possible to gauge an overbought/oversold stock by examining the distance of the lines between their current values and the 0 midpoint. If the lines are far away from 0 and their historical averages, it could indicate a stock is overbought or oversold.
However, generally speaking, MACD is less about pinpointing specific overbought/oversold levels and more about identifying when momentum is shifting. A rapid crossover of the lines, especially after a strong move, can signal that a reversal might be near.
Considerations When Using Momentum Indicators
While momentum indicators like the RSI and MACD can be useful for spotting overextended stocks, there are a couple of key points to keep in mind when using these oversold and overbought indicators:
Divergences
A divergence occurs when the price moves in the opposite direction to the indicator. For example, if a stock is making higher highs but the indicator is making lower highs, this can signal weakening momentum and a possible reversal. Divergences offer another layer of insight, so it's worth paying attention to them alongside other factors.
Timeframes
Different timeframes can produce different results. An indicator that shows a stock is oversold on a daily chart might not show the same on a weekly chart. It's important to choose the right timeframe for your trading strategy, whether short-term or long-term. Generally, many traders take a top-down approach, allowing higher timeframe signals to better inform your analysis on lower timeframes.
Risks of Trading Oversold and Overbought Stocks
Trading oversold and overbought stocks can be appealing, as these conditions often suggest a potential reversal in price. However, there are some risks to consider when relying on these signals. A few important points to bear in mind include:
- False Signals: Just because a market is oversold or overbought doesn’t guarantee a reversal. Prices can continue to decline or rise despite what momentum indicators suggest. Traders need to be cautious about assuming that every extreme condition will result in a price correction.
- Extended Trends: In strong bullish or bearish trends, a stock can remain in overbought or oversold territory for longer than expected. This can lead to premature trades, where investors get in too early or expect a reversal that doesn’t come for a while.
- Market Sentiment: Sometimes, external factors like news events or broader economic conditions can overpower technical indicators. If there’s overwhelming optimism or pessimism in the market, a stock may continue in its overbought or oversold condition for longer than anticipated.
- Lack of Confirmation: Relying on a single indicator can be risky. It’s common to use multiple indicators or combine technical and fundamental analysis for a more balanced view. There may be no other supporting signals when a stock is oversold, meaning the trade carries higher risk.
The Bottom Line
Understanding overbought and oversold stocks, along with the indicators used to identify them, can help traders spot potential market opportunities. While these conditions may signal a reversal, it’s important to recognise there is no one best overbought and oversold indicator and use multiple tools for confirmation. Ready to apply these insights? Open an FXOpen account today to access more than 700 markets, including a huge range of stock CFDs, and four advanced trading platforms.
FAQ
What Is Overbought and Oversold?
Overbought and oversold are terms used to describe extreme price movements in markets. A stock is considered overbought when its price has risen rapidly and above its underlying value, which potentially makes it overvalued. It’s oversold when the price has fallen sharply and below its underlying value, which makes it undervalued. These conditions can signal that a price reversal may be coming, though they don’t guarantee it.
What Does It Mean for a Stock to Be Overbought?
The overbought stock meaning refers to a stock that has increased quickly and is potentially trading higher than its actual value. This often occurs due to strong demand or market optimism. Overbought conditions might signal that the price is at risk of a pullback.
What Does It Mean When a Stock Is Oversold?
The oversold stock meaning refers to a stock that has dropped significantly and may be below its true value. This often happens when there’s been excessive selling, and it could suggest that its price is due for a rebound.
How Can You Find Oversold Stocks?
Traders often use technical indicators like the Relative Strength Index (RSI) to find the most oversold stocks. An RSI reading below 30 typically suggests that a stock is oversold and may present a buying opportunity. Other indicators, like the Stochastic Oscillator, are also commonly used to identify oversold conditions.
This article represents the opinion of the Companies operating under the FXOpen brand only. It is not to be construed as an offer, solicitation, or recommendation with respect to products and services provided by the Companies operating under the FXOpen brand, nor is it to be considered financial advice.

Catching Dips any Coin with Spiderline !The Spiderline is a concept in cryptocurrency that refers to a specific strategy or indicator used in technical analysis to identify key support and resistance levels on the price charts of crypto assets, particularly Bitcoin.
This concept is based on retracement levels or structures calculated from historical market data. Here are the key points to understand the Spiderline:
Origin:
It is often used by experienced traders to visualize critical zones where the price has historically reacted (bounced or been rejected). These zones are derived from specific lines on the charts based on previous Bitcoin price movements.
Usefulness:
- Identify support levels: where the price could stop during a decline.
- Determine resistance zones: where the price might struggle to move higher.
- It also helps plan entry and exit points based on the likelihood of market reactions.
Differences from traditional indicators:
Unlike tools like moving averages or the Relative Strength Index (RSI), the Spiderline is more specific to Bitcoin's historical behavior and is often used over longer timeframes.
Associated strategy:
Traders use it to refine their buying or selling decisions, avoid trading against strong trends, and manage their risk effectively.
Credit Inspired by #Cryptoface

When is a stock too high to buy? (Example: IHG)How do you know when you’ve missed the boat?
A stock has already gone up a tonne, so bascally you are too late!
Sometimes, you just have to let go, right?
Sometimes yes, but not always - let’s look at an example.
International Hotels Group (IHG)
Back in 2020, LSE:IHG IHG shares were trading down at ~2000 GBX, now they are a hairs breadth from 10,000 - that’s 5X in about 4 years. Not bad.
Can you really even think about buying shares at 10,000 that were 2,000 only 4 years ago. 🤔
We’re saying YES.. if you follow some guidelines.
Clearly this is not a value investment - this is a momentum trade.
To be buying IHG shares up here, one is basically arguing that the price at new highs indicates and buyers are in charge and the price is going to keep going up for the time being.
This helps define the trade risk very well.
If the trade is that IHG has broken out over the previous peak at ~8,800. We don’t want to be owning shares below this level - if they’re back below 8,800 the momentum has stalled and we need to be out.
To put it another way, we are not buying just under 10,000 and willing to hold the shares all the way back down to 2,000 again - no. We want to ride the momentum up - not down !
From here there’s a pretty good chance that momentum takes the price up to the 10,000 level. As a big round number, there is also a good chance that profit taking takes place here too.
That creates our buy zone between 8,800 and the current market price (9,750).
So what might a trading strategy look like to capture this situation?
The following is a way to have:
An intial risk of £1000 to test the waters
A total risk £3000 if/when the trade starts working
A 2X profit potential (with the opportunity to capture more)
Spread Betting Strategy: Target £6000+ Profit with £1000 Initial Risk
Entry Points and Stops
9000 GBX Entry:
Stop Loss: 8600 GBX.
Bet Size: £2.50 per point.
Risk: £1000.
9200 GBX Entry:
Stop Loss: 8800 GBX.
Bet Size: £2.50 per point.
Risk: £1000.
9400 GBX Entry:
Stop Loss: Trailing 400 points.
Bet Size: £2.50 per point.
Initial Risk: £1000.
Profit Targets
First Position (9000):
Gain: 1000 points.
Profit: £2500.
Second Position (9200):
Gain: 800 points.
Profit: £2000.
Third Position (9400):
Trailing Stop Profit Example:
10,400 GBX: Profit = £2500.
11,000 GBX: Profit = £4000 or more.
Summary
Total Risk: £3000.
Fixed Profit (First Two Positions): £4500.
Potential Profit (Third Position): Variable, based on trailing stop.
Reward-to-Risk Ratio: 2:1 or higher, depending on trend continuation.

S&P500 (SPY) Hits Target #2 Today!Traders, though we've still got a ways to go to our final target of 670-700 on the SPY, it is worth celebrating our direct hit of 600 today. I remember a year ago drawing out 563 as a first target for our blow-off top and I was laughed at. Bears were in their mood and hungry. They wanted more blood. But a combo of our Elliot Wave and a daily inverse head and shoulders showed us exactly where we would hit.
Then I spotted this nice cup and handle on the weekly. If you remember, it was almost invalidated with that China carry trade flash crash. But I stood my ground and stated that we would need to see another weekly open and close below our neckline before the bet was off. That did not happen and we are well on our way to that 670-700 final target. However, before we get there, I do believe our 600 level on the charts will provide some psychological resistance. Admittedly, this was more of a guess than anything when I had drawn it up and placed it on my chart several weeks ago. But now, we are seeing overbought conditions on both the daily and weekly charts. Are we a bit over-heated? I think we may be and should be prepared to see a bit of a drop, or at least a week or so of sideways price action, before we break 600.
Unlike my first target at which I sold and buy the carry trade dip for massive profit, I don't know that I will be selling here. 600, as I stated already, was more of a guess than anything. But I am pretty decent at making these guesses. Experience and lots of psychology and chart study has taught me. Before I get ahead of myself though, let's watch and see what the market decides to do next week.
✌️ Stew

A quick high-low TF analysis of USDX.Next week:correction starts
HTF to LTF high/low analysis of the dollar index the USDX. It was interesting to see the gold price rally as the USD$ continued to breakout this week, the dollar's prior weeks volume was massive but its petered during Friday (yesterday) after failing to close higher than the last known candle at this price level 108.33 on a day back in November 2022. Furthermore, the 108 level got rejected and the USDX fell back to close just under the 50% level of the daily candle which is still a bit bearish 107.47. See below my series of charts why I see the USD$ starting to recede next week, I would say commencing Monday.
Now to the 4HR chart where the bears have already moved in commencing Friday (yesterday)
Further bearish charting on the 30m
10M chart below, more bearish clues.
3M Chart. Is this getting boring?
1M TF a bears head n shoulders is for viewing & price has already retested and moving lower.
and finally a 10sec chart for giggles.

DOGEUSD looks overextended from big-rises. Sell or buy Dip
If you follow the stochastic's at all, esp. on higher timeframes, if you don't well that is fine, but I will share my tip, you never want to see K line (generally blue) crossing down on the D line if you are in a Long position, but an even further bearish possible move is when the K-line crosses down on the 80 Stochastic's level.
Now the fundamentals of the indicator are similar to the Relative Strength Index (RSI), anything above 80 and staying above 80 will become further overbought in a situation where there has been too much recent buying demand orders executed and as such sellers will usually move-in, but traditionally not until k Crosses-down on 80, getting to 75 will probably seal the deal short for sellers as this crossing of K needs to be a sustained crossing and needs to be moving down, this would occur much slower on a daily timeframe of course. Drop to lower timeframes and see what the oversold/overbought condition is for Stochastic's on lower TF's because the more confluence you have with the Daily the better.
It does not necessarily have to be on the Daily, but bigger timeframes carry bigger profits, generally, depending on SL position and risk/reward. Often, the first TF to meet the setup will be a lower TF, but profits can be made on a Crossing of the Daily chart, it would mean the trade is probably safer in higher TF, by that I mean trade goes your way in your intended direction, in this instance Short.
But here is the controversy of Stochastic X-ups (bullish above 20 level) & X-downs (bearish on a break of 80 lower), they are not very reliable when you are going against the trend.
For example, the DOGEUSD crypto has had a massive run lately since bitcoin reached around 75k, despite being at a great price, I believe, its price is overextended and considerably above the 200ema daily, so it becomes a sort of mean reversion situation where sellers form an idea from Stochastic's RSI Price action etc, that it's price needs to cool a bit as its overbought and too much current demand has driven the price too high, but here is the thing, shorting- Doge when its in a bullish uptrend with price above EMA's especially 200 will not be easy.
So this method works better when you are trying to move price (down or up) in the direction of the trend and the path of least resistance. One of the main reasons is because the RSI and Stochastic's give a mixed message when the trend is not your friend. This is because momentum is still to the upside long when above the 80 level on Stochastic's and RSI, momentum is still to the bearish downside when Stochastic's' is below the 20 level. This continued momentum can last a long time in these extended zones above 80 (bullish momentum) or below 20 (bearish momentum) but usually at some point a diminishing momentum occurs as the market forms an opinion that the instrument is overbought > 80 or oversold < 20.
So, the Daily chart shows how price is tipping over, right now a lot of other TFs showing bearishness as well on Stochastic's.
I hope this helps your understanding, a bit long but its a lengthy topic.
By the way, I don't think I will be selling DOGEUSD despite the reasons above, BTCUSD chart does not share this quality of bears moving in, at least not last time I checked a few hours ago.

The Daily Chart - Bitcoin - Definite pullback occurring now
BTCUSD is conducting a retrace, at most back to 70,000, the big white inefficient candle needs to be revisited and given some 'love', I note that the daily RSI and MACD are showing bearish momentum for the next little while.
Anyway, who would be game to Short Crypto at the moment. Now is a chance on some of them, which are pulling back with Bitcoin, but this is temporary overbought stuff.

Will Three White Soldiers Lead the Way?OANDA:XAUUSD Analysis
4H Chart
Current Price: 2447.215
Analysis Summary
• Three White Soldiers Pattern
• Volume Analysis
• Overbought and Resistance Zone
• Overall Bullish Trend
Three White Soldiers:
The chart shows a clear Three White Soldiers pattern, a strong bullish reversal candlestick formation indicating potential upward momentum. This pattern suggests consistent buying interest, as each candle closes higher than the previous one, signaling sustained demand.
Volume Analysis:
A closer look at volume reveals a weakening trend in the third candle of the Three White Soldiers pattern, suggesting a slight decline in buying strength:
• 1st Candle: 74.889K
• 2nd Candle: 134.962K
• 3rd Candle: 41.235K
This drop in volume in the last candle may indicate limited buying pressure, warranting caution before assuming continued upward movement.
Overbought and Resistance Zone:
The price is approaching a significant Overbought and Resistance Zone, which could act as a barrier to further upward movement in the short term. Combined with the lower volume in the third candle, this zone could lead to a potential consolidation or minor pullback before the next upward move. Despite this, the bullish reversal signaled by the Three White Soldiers suggests that the overall trend remains positive.
Interpretation:
Considering the overall bullish trend, the weakening volume in the last candle of the Three White Soldiers, and the approach to the Overbought and Resistance Zone, we anticipate the following:
1. Retracement to Support: The price may retrace down to 2739.624 before rebounding back to the Resistance Zone.
2. Potential Pullback to Ultimate Support: A further dip may take the price towards Ultimate Support at 2734.375.
3. Continued Bullish Momentum: After testing these support levels, the price is expected to resume its upward trend, with a potential breakout beyond the Resistance Zone, targeting the Extreme Overbought Zone.
Key Levels to Watch:
• Support: 2714.844
• Ultimate Support: 2734.375
• Retracement Level: 2739.624
• Overbought Zone: 2754.116
• Extreme Overbought: 2758.565
• Resistance: 2758.565
Overall Trend:
The overall trend remains bullish, with expectations of continued upward movement following any short-term pullbacks.
This analysis combines technical patterns, volume insights, and trend direction to provide a comprehensive outlook. Happy trading!

XAU/USD | Gold has been a good journey, next month however...I will try to keep this one short..
Hi everyone, it has been some time (7 months) since I posted my first idea stating Gold's potential. Gold reached the target 2700$ last week. However, during this week or next week possibly, I am expecting a solid change in direction that will start a short-term consolidation phase. Don't get me wrong, Gold is extremely bullish on the long-term, forming this cup & handle like formation. But throughout the next month, I believe gold will fall around ~2600$, in the worst case around ~2500$.
My reasoning is as follows,
Looking at the Monthly Chart, Gold's bullish rally carried Gold above the approximately 10-year trend, this is expected to some extent, because Gold has a lot more buying power than it had years before and there is literally a war going on, this too puts pressure on bull side.
However, one thing especially caught my attention, RSI is again over 80, which indicates Gold is overbought. In most of the cases where a stock is overbought a consolidation phase is inevitable. Looking at Gold's history, when RSI pushed these levels, in every single case, price dropped.
I've added a view that shows the whole history of Gold. And I think this view also suggest sell pressure around the current price. Note that blue marked zone is an approximation because not any information from the past is present.
To be able to keep track, I've added this view of the last 4 years. This view also indicates a lot of sell pressure for the short-term. I will update this view from time to time as Gold plays out.
Overall, lots of indications, RSI being the most solid one, show that Gold is looking for a consolidation before moving forward with the bull rally. My only concern right now is, Is gold going to push more before consolidation starts? To be honest, It is not easy to comment on that. Least we can do is wait until a solid reversal on a hourly chart. I wouldn’t suggest shorting in situations like this without waiting for confirmation...
Please do your own analysis before taking risks, Stay safe...

Approaching Key Levels with Potential Deep Correction Ahead!OANDA:XAUUSD
Current Price: 2737.445
2H Chart
Reason for Correction:
1H - Monthly: Overbought Zone (Deeper Correction Possible)
As indicated on the chart, the price is in an uptrend within an ascending channel on the Daily chart, and a similar trend is observed on the 2H chart, where an additional ascending channel is also forming.
Moreover, Gold is currently in the overbought zone across multiple timeframes, from 1H to the Monthly chart.
Before a potential correction, the price may rise to the overbought zone at 2753.906 or even the extreme overbought zone at 2773.699. However, it is not necessary for the price to reach these levels, as a correction could begin sooner.
A potential correction could target 2700, a significant psychological level, and extend further to 2685. It’s also possible for a deeper correction to occur, which will be addressed in a subsequent analysis.
Key Levels:
• 2753.90
• 2773.70
• 2700.00
• 2685.44
Happy trading!

DownSelling over bought in a down trend, quick fall to target in 1-2 days else just wait will it hit tp or sl
