CADCHF video top-down AnalysisHello everyone, if you like the idea, do not forget to support with a like and follow.
Here is the top-down analysis for CADCHF, feel free to request any pair/instrument or ask any questions in the comment section below.
Best of luck!
Overbought

Bitcoin - What's the next move?Watch the video if you are looking for:
- an understanding of the current situation
- where this might end
- planning your next move
And please hit like👍, I greatly appreciate your support for the time it takes to do a video analysis
Best Regards
Ev

RSI indicated overbought, resistance zone and Dave Chappelle Dave Chappelle declared war on VIAC via his Instagram regarding Dave Chappelle's Show. Competition such as Netflix and Disney will eat HBO alive.

NZDCAD at OverboughtNZDCAD at Overbought Area Now. We have seen it is showing divergence condition In RSI and Momentum indicators. Anyone can find a sell signal from this area. Based on the candlestick pattern.
Thanks.

Volume Indicators Masterclass Part 1VOLUME INDICATORS
Volume is one piece of information that is often neglected by many market players, especially beginners.
However, learning to interpret volume brings many advantages and could be of tremendous help when it comes to analyzing the markets. The usage of volume indicators has long been restricted to just the Forex Markets. Thereby in the Volume Indicator Masterclass, we will be looking in-depth for a few volume indicators.
Traders often use volume which measures the number of shares traded during a particular time period as a way to assess the significance of changes in a security’s price.
Traders rely on it as a key metric because it lets them know the liquidity level of an asset, and how easily they can get into or out of a position close to the current price, which can be a moving target.
Volume analysis is a technique used to determine the trades you will make by discovering the relationships between volume and prices. In order words, it shows how many times the security has been bought or sold over a given timeframe. The time frame can be one minute, four hours, one day, or anything.
The volume transacted in the given timeframe is represented as a bar, which can be color-coded. The color of the bar shows whether the security’s price closes up or down.
A green bar is generally used to show that the security closed higher during the trading session
A red bar is used to indicate that the security closed lower
The height of the bar shows whether there’s an increase or a decrease in the volume of the security transacted a taller bar shows a higher volume while a shorter bar shows a lower volume.
Trend Confirmation :
If the volume increase with an increase in price or with a decrease in price, it indicates a strong buying or selling pressure.
Trend Non-Confirmation :
If the volume decrease with an increase in price or with a decrease in price, it indicates a weak buying or selling pressure.
There are various Volume Indicators, out of which we will be discussing the Money Flow Index in this Masterclass.
Money Flow Index
The Money Flow Index (MFI) is an oscillator that uses both price and volume to measure buying and selling pressure.
The indicator is synonymous with “volume-weighted RSI” as it integrates volume and mirrors the relative strength index (RSI) with respect to its mathematical formulation and categorical classification as a momentum oscillator MFI.
Calculation of the Money Flow Index:
Typical Price: (High + Low + Close) / 3
Money Flow: Typical Price x Volume
Positive Money Flow: The Money Flow on days where the Typical Price is greater than the previous day’s Typical Price.
Negative Money Flow: The Money Flow on days where the Typical Price is less than the previous day’s Typical Price.
Money Flow Ratio: 14-Period Positive Money Flow / 14-Period Negative Money Flow
Money Flow Index: 100 Money Flow Ratio / (1 + Money Flow Ratio)
Signal Generation
BUY When Money Flow Index crosses up 20 i.e. from the oversold region
SELL When Money Flow Index crosses down 80 i.e. from the overbought region
There a lot of more interesting Volume Indicators that can be used, about which we'll be talking in the next Masterclass of Volume Indicator.
STAY TUNED!
----------------------------------------------------------------------------------------
Your questions and comments are most welcome.
If you find the post useful, please like, share, and follow to make sure that you get more information once published.
- Mudrex

R2K Ripe for PluckingMFI, RSI topping at ATH, Sector rotation out of megacaps is the money flow. Looks like a complete 5-wave EW impulse.
Ofc it can still get higher. Odds seem to favor short in near-term. Just an idea, not advice; trade at ur own risk, GLTA!

Short Of The YearRoku is positioned to be my short of the year. With the Bollinger bands giving a double sell signal, Divergence+ giving a triple sell signal, and a RSI that has sat above 70 for a record amount of time this month. We are positioned for a very strong sell off. Roku is simply overbought and the bears are getting stronger and about to have full control of this stock. The red shadow above the recent candles shows divergence. The best indicator to look at is the MACD at the bottom of my chart. Paths have crossed at the top and will fall as the bullish volume bars are declining rapidly. If you look at the difference in price indicator, ( a script I created ) you can see that the price change per candle on the 45min has become less volatile. Expect to see some spikes like on the 9th except these spikes will be downward price movement. My strategy is to buy ROKU within the first 30min of the open. It could jump in price with Monday Morning Market euphoria, and begin to trickle down from there. I have a target price of $247 and I believe that can be reached before the end of the month. I plan on purchasing 25 contracts with a strike price of $250 expiring 11/27. Looking to make my biggest options return of the year. Apple still holds my record for this year at a $6k profit but I see potential to make $10k+ with Roku. Follow to watch the big win, or loss.
Comment your thoughts below!

#BTC Dominance Will Send Altcoins To New ATH!-Waiting For BTC.D To Start A Correction Downward Back To 55!
-Altcoins will start rocketing when BTC.D starts cooling off.
-We Are In For A Treat!
-Keep #ContemplatingCrypto !
💠 Check Out The Crypto Collective For More Signals & Set-Ups! 💠

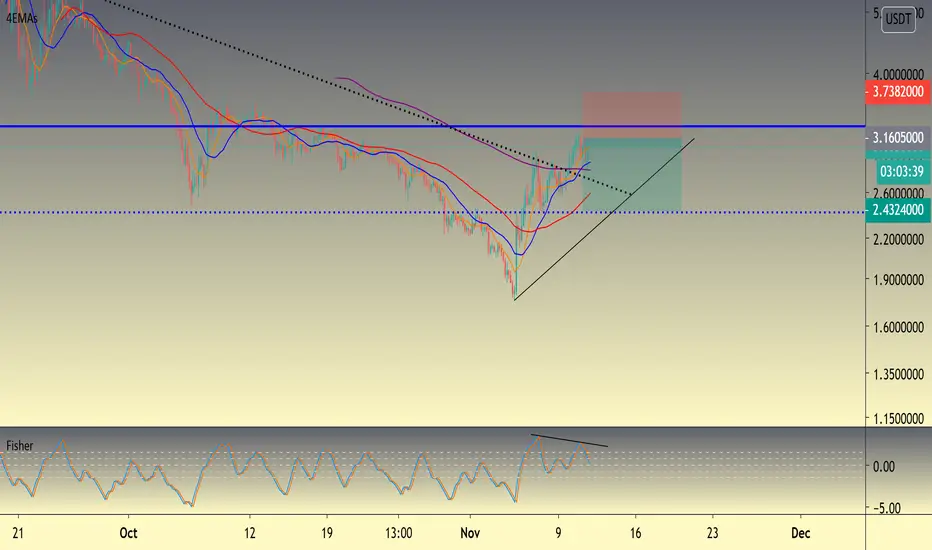
UNI SHORTMy Fellow Crypto Traders,
Appreciate you taking the time to view my analysis in which I hope you may find it beneficial. Please be sure to “LIKE” if you indeed find my analysis useful and/or find my analysis intriguing.
Cheers & Happy Trading!
---------------------------------------------------------------------------------------------------------------------
ANALYSIS:
UNI has finally made some surprising gains in the last view days, however, @ over 80% gains in the last few days, UNI is extremely overbought and could see a correction down to support levels. Therefore entered a short @ $3.1605 w/ 600UNI = $1458
* 1st TP @ $2.81 w/ 250 UNI
* 2nd TP @ $2.58 w/ 200 UNI
* 3rd TP @ $2.41 w/ 150 UNI
BTCUSDT 4H | Bitcoin market overview: OverheatingHello, dear subscribers!
In the previous review the price of bitcoin was at $15,500 and we predicted further growth. The price of Bitcoin now is $16,230.
Bitcoin price is renewing increasingly new highs, but the bitcoin market is accumulating overheating. After a prolonged growth should follow a correction. Indicators RSI and OBV confirm local overbought. New price highs are accompanied by lower RSI and OBV peaks, indicating that buyers are losing strength.
At the moment, the price is in the resistance zone - $16,000 - $16,400 and in order to go above the price you need to secure yourself above the resistance zone.
At the bottom, the support level is $15,500, followed by the support zones of $14,500 - $14,800 and $13,600 - $14,000. If the bears succeed in defeating the bulls and do not let them get fixed above the resistance level, their targets will be the designated support levels.
Subscribe to the channel and stay with us!

Extremely important RSI MACD correlation for all to knowLearn the in’s and outs trading with RSI and MACD
Most traders are thrown off with these two indicators when both in use when RSI is resting at or above/below overbought and oversold zones. This explanation will answer most of the similar questions I have been getting
This is a 1 hour chart for NZDCAD. Looking at the RSI and MACD indicates a clear sell should play out. I have presented an example when that does not happen and how to avoid this.
If MACD lines and signal lines have made their cross above or below the zero lines a trend is generally established. Often we will see MACD and signal lines make multiple up and down crosses while well above or below MACD 0 lines. This confirms a trend has continued with pullbacks.
The way to determine the true future direction is to correlate the remaining hourly charts specifically the 2 hour chart. I think the 2 hour chart represent the most accurate trend play out.
So as seen here on the 1 hour chart although the MACD and signal line crossed with RSI in overbought zone the two hour MACD chart represented a strong trend going up through MACD zero line and histogram bins confirming the trend is continuing up. The next step is to observe correction on the 2 hour chart. Once correction begins the 3 hour chart represents its trend continuation with MACD and signal line flowing up through the 0 line. Then the same observation with 4 hour chart.
Ultimately this is how I determine when a longer term trend is going. Please ask questions and let me know what you think!

A correction might come to the Gold marketA correction may occur after the break of the red support line.
Market condition overbought.
This trade can take some weeks to months
Same trading tactics.
Take profit 1 and move stop loss to break even.
Trade at your own risk.
TVC:GOLD

WHAT'S WRONG WITH AMAZON?Please hit like and share your support :-)
One word: price.
That’s because the company falls in the top-10% of most expensive U.S. companies.
To justify its current value, Amazon would have to compound growth at 14% over 10 years. The company would also have to slow working capital growth significantly, netting its capital requirements to zero over the long run.
Amazon is still a great business: investors should expect Amazon to win massively in e-commerce, cloud computing, and digital media. A decade from now, Amazon will almost certainly still dominate the global retail industry.
But when it comes to the company’s stock, investors should keep in mind that AMZN is currently overvalued and overbought. By any conventional measure Amazon (NASDAQ:AMZN) is overvalued. With a market cap of $1.66 trillion, AMZN stock is being valued at over four times its potential 2020 revenue of $400 billion. That's based on its second quarter sales of $101 billion.
As with the other Cloud Czars — Apple (NASDAQ:AAPL), Microsoft (NASDAQ:MSFT), Alphabet, and Facebook (NASDAQ:FB) — Amazon’s current price is built on the COVID-19 market and the Fed. It’s not based on Amazon’s performance. And that is the biggest concern for price support at these high levels.
Thank you for taking the time to read and please hit like,
Ev
Sources: Investorplace

UBER Over Bought UBER is extremely overbought. Here is a breakdown of the technical indicators and my plan.
With an RSI of 91.04 for the last 14 two hour candles it's a given that UBER is madly overbought.
However, Bollinger bands have not crossed in a downward direction giving a sell signal, and the MACD shows some room to grow still. Unless the downward curve happens during the first two hours of Mondays open.
This stock remains on my watchlist and I will most likely be shorting once I get a sell signal on both the Bollinger Bands and MACD.

BITCOIN Potential Bearish Short-Term movementHello everyone, here is the top-down analysis for BITCOIN, feel free to request any pair/instrument or ask any questions in the comment section below.
If you like the idea, do not forget the like!
Best of luck!

Scenario: return by means of "Fiffi" theory @ USD/TRYUSD / TRY is already triple (D1-H4-H1) overbought. If the the first D1 candle close above the north BB, the course probably turn to the middle band. Target price is 7.30000. Technical resistance: 8.50000 (magic number)
The currency pair can turn earlier, if the TCMB make a verbal or non-verbal intervention. Be prepared!

Bears getting control of NZD/USD at the 0.6700 levelThe NZD/USD may be getting ready for a turn to the downside of the market..
My reasons for thinking so :
1) The price is at the upper trendline and we have been seeing consistent movement between the lower and upper trendline.
2) Price is at a significant resistance level the 0.6700 level
3) Stochastic Oscillator also showing signs of overbought conditions

Tesla Is Pure Garbage At These LevelsPrice to Earnings: 1,087.43, Price to Sales: 15.32, LTD/E: 106.14, why should anyone buy this stock guys? I'm really asking?


AUDNZD oversoldOversold conditions are optimal, with a probability of reversing
Wait for a confirmation at least one candle above the broken trendline.
Same trading tactics.

SHORT TESLA (WAY OVERVALUED ATM)LOOKING FOR TELSA TO COME DOWN SUBSTANTIALLY. STARTING NOW AND CONTINUING AFTER THE ELECTIONS. $200 PUTS EXPIRING IN LATE DECEMBER ARE TEMPTING.. WHAT DO YOU THINK?

NQ1 heading to overbought, again; can break off anytime from FibNear/at the 0.786 with divergent MFI/RSI. Might be a Cup & Handle forming; if so, the Handle typically retraces half the right wall of Cup.
Likely to sell within a week IMO. Could double top before it breaks; don't bet the farm yet!
Not advice; trade at ur own risk: GLTA!

Watchout for M&M!!!Breakout for M&M from an inverted Head and Shoulders pattern in 15 minutes chart. This was supported with high volumes. Technical indicators RSI and MACD were also giving positive signals. RSI is in the Overbought zone and MACD line is above the Signal line.
The first target has been set at Rs 645.5. The second target is set at Rs 662.20. The stoploss is set at Rs 597.25 which is the low of the right shoulder.
