eBay GRAVITY CENTER FOR LONG TERM VIEW & FORECASTIn this analysis i present my point of view for eBay stock based on the price action toward the trendline,
We can state clearly that the market is overbought
Please share with me your thoughts
Regards
Overbought

Bitcoin: Tripple Top: Bearish Movement!!!Hello, the latest analysis was cancelled to take other confirmations, for now, we see that bears want to sell Bitcoin, guys, that is another point to take noticed it, tripple top it's mean a change of trend, in tat case is for micro-trend. So, we see a tripple top in H1 timeframe with a possible entry in short in the $!1,870 USD, its confirmed. So, beware to put longs position in Bitcoin
The trend could be influence in Daily that we are overbought and bears want to sell Bitcoin at below of $!2,000 USD as key resistance in weekly

OVERBOUGHT!! - Add to watchlistAlthough a good stock to add to the watchlist, it is currently overpriced.
I would like to see this get below the 80MA which according to the Williams% chart, tends to be when the stock is oversold.
HUBS currently needs a lot of movement to get down to the 80MA, set alarm up crossing the $200 and watch daily from there moving forward.
The green area is an up trending resistance zone which has been recently tested, will it breakthrough the resistance?
There's a good chance it will however I'm hoping for a correction, where speculators can potentially buy in around the $225 mark.
I personally won't but I don't like to speculate or take the riskier approach.

BTC/USD: Parabolic rise must cool downIt's true that bull markets can take you by surprise and be irrational for longer than you expect. But it's also true that parabolas don't last forever.
This rise to 11.4k was parabolic. Bitcoin got more overbought on the daily, by my own calculations, than at any time since April 2019. The last time it hit these levels before that was Oct 2017, and only for one day each time.
So (it seems to me) one of two things must happen, on a daily timescale:
1. A retrace to some kind of support level, like the local ones highlighted in green on the chart, or at least the 0.382 or (much) better the 0.5/0.618 Fib retracements, and then continuation. I just don't think the quick touch of 10575 is enough. I could be wrong.
2. A sideways corrective pattern for a few days, like a flag but not necessarily that obvious, during which we get a daily oversold signal (probably just one) on my Price Action Trend | Simple indicator.
I'm totally bullish on Bitcoin and will long the heck out of either of these two when they occur.
Let's not forget there's also the CME gap, highlighted in yellow on the chart. Note that while I believe it's overwhelmingly likely that this will fill on the BTC1! chart, a spike down there wouldn't necessarily match the price on other exchanges, so you can't translate the exact levels.
Finally, since everyone and his dog are now bullish, we can't rule out a good old-fashioned stop-hunt.
#notadvice
Trade safe, everyone.

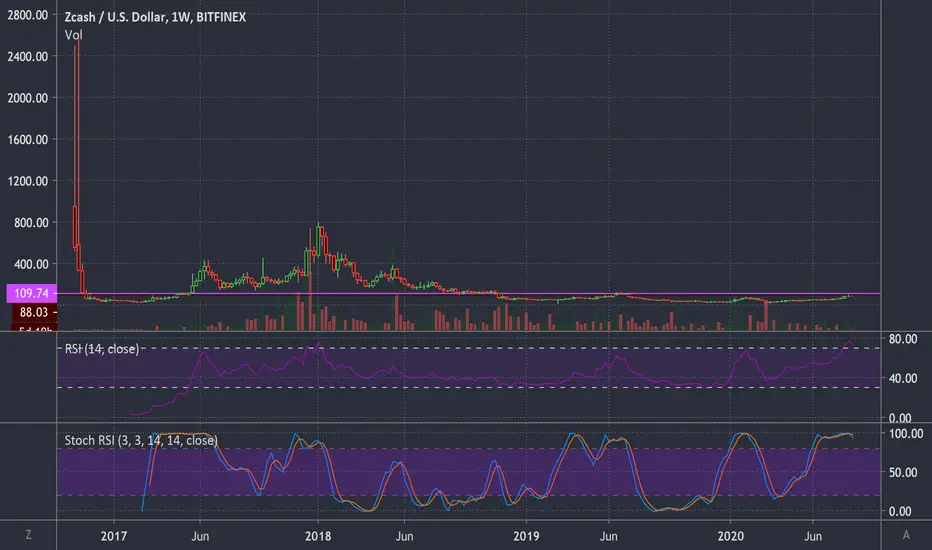
ZEC Nearing A Major Level Could see $70again region near term but once this resistance breaks ZEC will fly.
Not Financial Advice.
Overbought!See what happened last 2x RSI went > 80 on monthly. NCAV/ Share =2.5 (.04 away from where it crashed 97.33% from highs in Jan18 to lows March20.) Not saying it won't go higher, but looks ready for a spectacular pull back!

Wayfair: Chart Overextended and Price way beyond FundamentalsYou can see that selling on the upper red line has rewarded shorts in the past and I believe that this is a great short opportunity here - one of the best i have ever seen. We have got way over extended and fundamentally the price is just way too high for a this company, even with the 'shopping online' narrative that has been done to death. Overstock is the much better company in reality. Margins are just too small for furniture and you only have to read Wayfair reviews on the likes of Trustpilot to realise how poor their products are. I think we should at the very least see a retrace back to the 250 levels here.

S&P500 short-term retracement probableFor those prepared to go against the momentum, a retest of the medium-term uptrend levels seems probable; with reasonable risk:reward even at 1st target levels. Anticipate buying and sharp bounces.
Risk-off sensitive. Manage exposure accordingly.

SHORT GBP/NZD.SHORT GBP/NZD, ***IF there is a clear rejection around the current level, wich is on a key level. The market reached the 1,98000 key level (psychological level), wich should act as resistance, the market is also overbought (can be seen on the RSI) and the market is creating a divergence (pink line on the chart and on the RSI). IMPORTANT : I am only showing an analysis on one of the many timeframes that I use.

INFOSYS FALLING KNIFEit has left a large gap to be filled. It is expected to come down to that level.
Overbought on RSI too.
TARGET 1 : 885
TARGET 2 : 850
STOP LOSS : 950
**These are my personal observations. Please trade at your own risk.**

$LL Lumber Liquidators - Overbought Hitting Resistance$LL Overbought Hitting Resistance
Reversal day today after nearing doubling in two weeks.
Near term target: $20 (could go lower)

SHORT EUR/USD.SHORT EUR/USD, IF*** there is a clear rejection around the current level, wich is on a weekly key level. The market reached the 1,17500 weekly key level (psychological level), wich should act as resistance and we can also see on the RSI that the market is overbought. IMPORTANT : I am only showing an analysis on one of the many timeframes that I use.

Waiting for reversal - Uptrend channel and RSI being overboughtGBP/USD is approaching a crtiical point as the RSI shows it is seriously overbought now. It's fair to assume a correction will take place, once price touches the upper trendline around 1.29 level. Note: Pay attention to USD strength - the weaker the USD, the more likely for there to be a break above the upper trendline.
NOTE: Not professional investment advice. I will not be held accountable for any losses.

EUR/NZD Short 300 pips?Good day, snipers. Here in EUR/NZD , I am looking for Swing Short since price is in a descending channel and also at a minor area of resistance . Price also seems to be on overbought levels on RSI and a bearish divergence . Big SL but greater TP level at structure. Signal with Entry, adjusted SL and TP will be sent to students.
Follow me on tradingview for more ideas and sniper entries. If you liked this idea please click that thumb's up.
Ideas posted are not financial advise, but merely just to give insights and education for traders.
Past performances do not determine future gains.
As sniper traders, we tread carefully, then we take shots immediately.
Join the discussion down below.

LMT small pullback before hitting $400Looking like its going up too fast to me. Expecting a small gap up followed by a pullback to low 380s, then next stop $400+

NZDUSD SUPPLY SELLDespite the explosion towards the upside, I'm expecting the SUPPLY ZONE to hold and send price down. The RSI has reached another level of being overbought.

AUD/CAD Time to Short BabyGood day, snipers. In the AUD/CAD, we can see that price came to retest the strong resistance zone which was present in the higher time frames (weekly and monthly). Price is also on top of the trend channel and I expect a downward push. Also, price recently made a long wick on that resistance zone and is now at overbought levels on the RSI.
Follow me on tradingview for more ideas and sniper entries. If you liked this idea please click that thumb's up.
Ideas posted are not financial advise, but merely just to give insights and education for traders.
Past performances do not determine future gains.
Signal sent to students.
As sniper traders, we tread carefully, then we take shots immediately.
Join the discussion down below.

SHORTING the NZDUSD ResistancePrice has respected this resistance over the past few days. Rejection candle would help support my reason for shorting this setup. The indicator also shows level of overbought so we're expecting price to reverse from this level.


AUD gained +2.22% relative to the RUB last weekAUDRUB in Uptrend: Stochastic indicator is sitting in overbought zone for 1 day
Expect a price pull-back in the near future.
Current price 50.08 is above 48.46 the highest resistance line found by Tickeron A.I. Throughout the month of 06/17/20 - 07/18/20, the price experienced a +5% Uptrend. During the week of 07/12/20 - 07/18/20, the FOREX enjoyed a +2% Uptrend growth.

QQQ - where we at Please do your own DD - this is just my understanding so far.
When will this play out? Perhaps a trillion dollar company could trigger a violent drop? perhaps pure TA play

GBPJPY SELL 135.80 SL:136.00 TP:134.500eject of the resistance + highly overbought market + reject of the 200 EMA on the daily time frame

SHORT - RSI pointing to correction at 1.266 resistance - GBP/USDSimple as it looks. 1-hour chart on GBP/USD showing RSI at the 70 level level, suggesting it is now overbought for the current time period. This is especially true as the pair retests the 1.265 - 1.266 resistance level, hence making it harder for there to be a strong breach above the 1.266 level. Thus there being a likelihood of the pair heading back down to 1.255. However, I do not think it will easily reach 1.25000 or even anywhere below that based on the most recent developments - the Oxford vaccine is big news, and with the macroenvironment really improving over the Covid pandemic, safe-haven demand for assets like the USD will drop. So, PAY ATTENTION to USD weakness/strength as that will dictate the next possible moves.
Note: This is not professional advice. Please trade at your own responsbility - I will not be held accountable for any losses.
