$AMZN Overbought - Due for pullback$AMZN Expecting to hit a near term top today or tomorrow, it's possible it pushes for the $2,500 mark.
Anticipating a near term, healthy pullback to the $2,315 or EMA 20 area at least leading up to ER.
Overbought


Overbought and oversold on XRPBTCUsing the Williams R% oscillator indicator since July 2019 we can see overbought and oversold states on XRPBTC. Here are two types of vertical lines: greens and orange.
The green lines are the moment when the position should have been open and the oranges when it should have been close.
The arrows show whether price should have risen or fallen according to the indicator.
The conservative signal for a long position is when the line breaks up the bottom dashed and the -50.00 line. The signal for a short position is the mirror. At this time, the signal is for a long position from 27 Mar until the line breaks down the -50.00 line again.
Note: Stop loss and take profits are only illustrative.
Chart: D

SPX500 shortThe SPX500 is at the top of the downtrend line on H1 and the RSI shows us its in overbought zone. The drop is possible from this level.

ERIE being eerie! RSI analysisERIE's chart seems to work on overbought levels. The chart mark the levels where the RSI is overbought, and when it goes back to under 70. Using these as signals have worked well in the past; of course past performance is no guarantee of future results; and Implied Volatility is over 400% higher.
OBV has stayed in its upper channel ( Bull )
200sma is working as strong resistance, marked in-chart. ( Bear )
Keeping on a watchlist.

EUR/NZD - ShortToday was a very aggressive push higher today with a shift in momentum for the NZD, especially within GBP/NZD too.
Higher time frames are looking overextended and we can still expect a deeper retracement but we cannot ignore the potential bull flag unfolding here. I will like to see if we can come up and reject 78.6% Fibonacci again before taking the short.

SHORT APPLE (+16.5% | +3.83R)RSI at 90 on 1W chart!
Really impressive!
Apple went up in a parabola mode, it's time to retrace!
Entry, target and stoploss in chart

ZEC Looking To Double Bottom In Oversold Territory On The Daily ZEC pulling back along with the rest of the market. It has golden crossed on the daily timeframe. Stochastic RSI is oversold. The weekly timeframe RSI is Overbought similar to BTC. ZEC currently attempting to find support on the 50 MA. Thinking we'll see the weekly RSI cool off resulting in the daily RSI turning south in the days ahead to make a double bottom formation. Price could retest the upper $40's potentially. I would suspect candle body to bottom around $55 but that is highly speculative. If you know anything about ZEC is this thing prints insane wicks all the time so watch out with your stop loss. At least consider that in your trading strategy this is a real easy one to get stopped out in rather frequently. Its worth noting that on January 14th or 15th ZEC saw what looks to be its highest amount of buy volume ever recorded. I am long term investor with bullish view overall. Think the charts are showing some bearish potential for the days ahead. Say what you will about Zcash but remember this one thing....
It was once listed for $2,200,000 each. Ridiculous as it may be it still is a fact. Calculate the risks you take.
Please Like & Comment ------> Lets Be Friends **even if we disagree**
HAVE A GREAT DAY. LIFE IS A GIFT.
Not Financial Advice.

BTC Golden Cross On The Daily Despite Recent Sell OffAfter a healthy uptrend BTC has met resistance on the major diagonal resistance line drawn from the 20k & 14k peaks. Despite a strong rejection we have still managed to get a Golden Cross on the daily chart . Stochastic RSI in oversold conditions. However, We are in overbought territory on the Weekly timeframe in Stochastic RSI . Looking at moving averages for support out fist one would be the 50 day around the $8,500 region. We need to breakout of the diagonal resistance before we can put our moon suits on. That time only grows closer each day. Could see a double bottom get printed in daily Stochastic RSI in oversold condition while the weekly cools off. There is definitely some downside potential for BTC and the market overall in the short term. If your focused on the macro picture you know where were going long term. Double digit blocks soon to be a thing of the past ---> for ever.
Please Like & Comment ------> Lets Be Friends **even if we disagree**
HAVE A GREAT DAY. LIFE IS A GIFT.
Not Financial Advice.

Gold retracementsome retracement because:
- heavy overbought in every timeframes
-seen divergence
-it is in the end of 5th wave of elliot

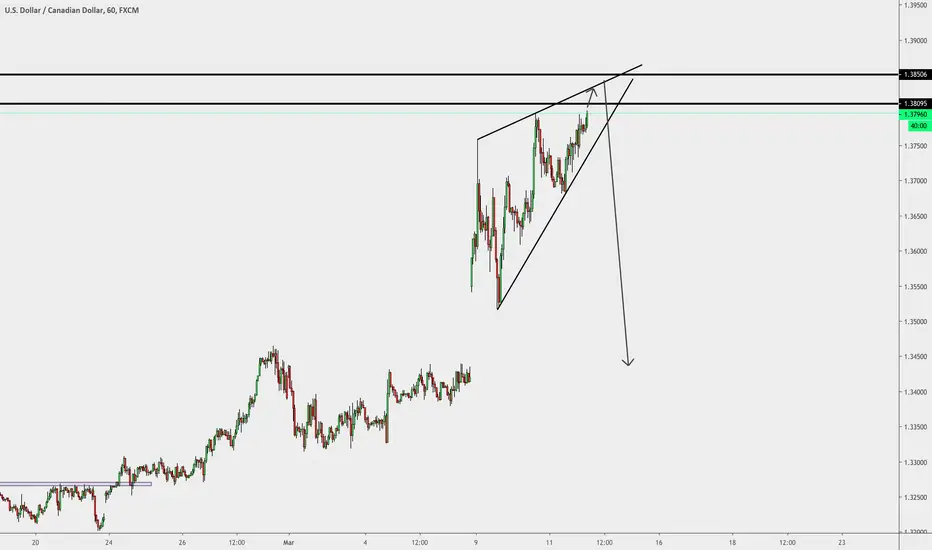
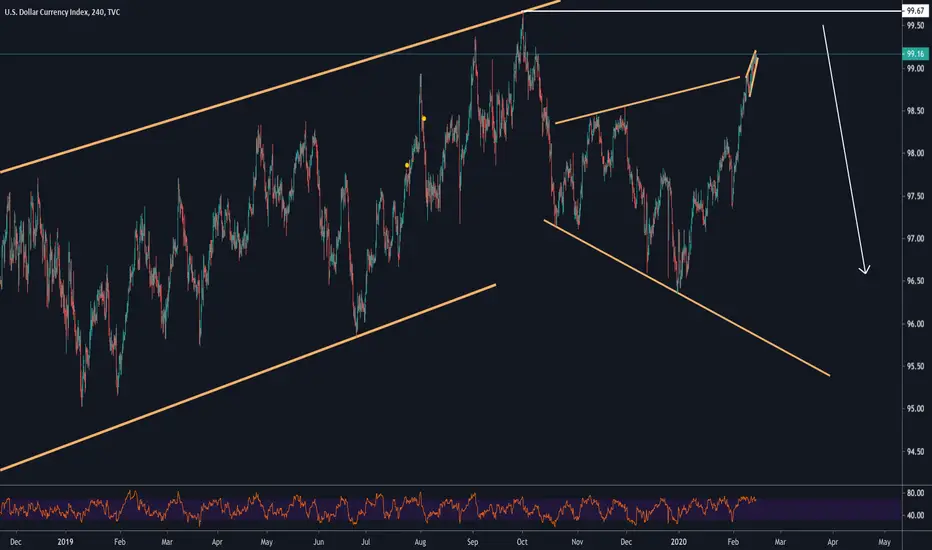
DXY Week 17th FebLast week, we had a really strong weekly close, not being too put off by this we see retraces a lot after these strong pushes.
We may either see a retrace in the current area or we go a little higher and retrace off the double top or we go o the outer structure.
Regardless, nothing major has changed as of last week, I will be looking to see how price heads towards the ray line and overall larger double top before the sell off we are expecting.

SELL TEZOS XTZSell XTZ and buy BTC or USDT, in my opinion bulls for this shitc is over and in the long term we will see ATL 0.000087 levels

USDNOK ReversalThis pair is moving in the direction where we can attempt to capture a Short Trade off of, using a tight stop loss using our historical price range. Some can wait for Candlestick readings but the previous wick in this area of local resistance tells us that there is a possibility that price can reject this zone, if not then no harm done with proper risk management.

ETH/BTC - short term pullbackETH/BTC has broken out of it's long term downtrend and made an impressive move over the last days but now it looks like a great place to take some profit and buy back in lower.
The reason for that is:
1. ETH/BTC shot right through the daily 200 MA and hasn't had a proper correction since. Now it's very close to the daily 314 MA and will likely bounce off it and retest prior levels.
2. It's at the top of the current channel
3. Daily StochRSI is very high and likely to cycle down soon
4. Significant bearish divergence on the hourly timeframe which is also visible on the ETH/USD pair (see comment below for chart)
Long term it looks bullish to me so consider this a short term setup.

CHFJPY is a sell/shortThe bears own the market for the next couple of week look for an entry on EMA 20 on H4 timeframe

CHFJPY SHORTOfficial 5 waves are done now, so we might expect a correction to the downside with a ABC type of pattern from Elliott Wave.
I expect a 50% drop for the whole structure, so my target would be around the 110.266 area and the 0.5 fibonacci retracement region where we see many confluent reasons such as the top of wave 1 and the corrective wave 2.
We also see the RSI IN very overbought region on the 4 hour timeframe at 78.3 at the time of writing this and the MACD Histogram starts to tick to the downside as well.
Always do your own analysis before entering a trade and be carefull in the markets.

AMD at resistanceOverbought and Bearish Engulfing
Most significant support is at former highs at 34.4

XRPUSD 1H BEST %R MOMENTUM STRATEGYStep #1: Define the Trend. An Downtrend is defined by a Series of LH Followed by a Series of LL.
The definition of an downtrend is pretty much standard. In an downtrend, we look for a series of lower highs followed by a series of lower lows. Two LH followed by at least another two LL is enough to define an downtrend.
A lower high is simply a swing low point that is lower than the previous swing high. While a lower low is simply a swing low that is lower than the previous swing low.
All momentum traders know that the trend is our friend. But without momentum behind the trend, we might actually not have any trend.
For active traders, we also look at the actual price action in order to gauge momentum. Besides reading the best momentum indicator.
Step #2: In an Downtrend Look for Bold Candlesticks that Close Near the Lower End of the Candlestick .
A technical analysis concept is that you want to use multiple confirmation signs when buying and selling. This will increase the likelihood that’s a high probability trading setup.
In this regard, the momentum trading strategy besides using the best momentum indicator, also incorporates the price action.
A practical way to read momentum from a price chart is to simply look at the candlestick length. What we want to see in an downtrend is big, bold bearish candlesticks that close near the lower end of the candlestick.
Now, it’s time to focus on the Williams %R. This is the best momentum indicator. Which brings us to the next step of our momentum indicator strategy.
Step #3: Wait for the best Momentum Indicator to get overbought (above -20). Then rallies below the -50 level before Selling .
We’re going to use Williams %R, the best momentum indicator in a smart way. In an downtrend, we sell after the best momentum indicator has reached overbought conditions (above -20). And then rallied back below the -50 level.
Now, we have confirmation from both the price and the best momentum indicator. The real momentum is behind this trend and the probabilities are in favor of more downside prices from here on.
Note* If the best momentum indicator continually stays in oversold territory (below -80 level), it signals a strong momentum and conversely a strong trend. Inversely the same is true in a uptrend.
The next important thing we need to establish is where to place our protective stop loss.
Step #4: Place Your Protective Stop Loss above the Recent Lower Low.
We want to hide our protective stop loss. It is above the most recent lower low level that formed right before the best momentum trading strategy issue the sell signal.
Alternatively, you can also trail your stop loss above each most recent lower low. This strategy will allow you to lock-in the potential profits in case of a sudden market reversal.
Last but not least the momentum indicator strategy also needs a place where we need to take profits, which brings us to the last step of the best momentum trading strategy.
Step #5: You pick your own TP strategy or
Take Profit once we break above the Previous Lower Low
A trend in motion can stay in that state longer than anyone can anticipate. And since we want to maximize our potential profits we let the market tips it hands before liquidating our trades. In this regard, we look for a break in the trend structure. Respectively a break above the most recent lower low.
Alternatively, you can take profit once the best momentum indicator breaks above the -50 level.
Note** The above was an example of a SELL trade using the Best Momentum Trading Strategy. Use the same rules for a BUY trade.

Massive sequence of RSI-Renko DIVINE™ Scalps Following Iran NewsThere were a total of 250-270 points of NQ scalps after the Iran missile strikes going long. If you held the first contract long on the swing trade (1st trade in the direction of the new trend is always the swing trade, marked by a fat arrow) you would have gained another 270 points.

Baker-Hughes - short - resistance hit - daily chartResistance on the Baker-Hughes daily chart is hit.
Both MACD & RSI are both overbought so we go for a definite short as there is a good engulfing bearish red candle on the 4 hour chart for an entry reason.
Success & Good luck. Enjoy your trading day.
Comments always welcome.

Adobe - AB=CD pattern - short - 52 week high - OBAdobe looks in great shape to short on the 4 hour (or daily chart) - just wait for a solid and simple entry reason as all the confirmations (so far) for a good short are apparent.
As always I wish you success, happiness & good luck!
Comments always welcome.
