XRPUSD 1H BEST %R MOMENTUM STRATEGYStep #1: Define the Trend. An Downtrend is defined by a Series of LH Followed by a Series of LL.
The definition of an downtrend is pretty much standard. In an downtrend, we look for a series of lower highs followed by a series of lower lows. Two LH followed by at least another two LL is enough to define an downtrend.
A lower high is simply a swing low point that is lower than the previous swing high. While a lower low is simply a swing low that is lower than the previous swing low.
All momentum traders know that the trend is our friend. But without momentum behind the trend, we might actually not have any trend.
For active traders, we also look at the actual price action in order to gauge momentum. Besides reading the best momentum indicator.
Step #2: In an Downtrend Look for Bold Candlesticks that Close Near the Lower End of the Candlestick .
A technical analysis concept is that you want to use multiple confirmation signs when buying and selling. This will increase the likelihood that’s a high probability trading setup.
In this regard, the momentum trading strategy besides using the best momentum indicator, also incorporates the price action.
A practical way to read momentum from a price chart is to simply look at the candlestick length. What we want to see in an downtrend is big, bold bearish candlesticks that close near the lower end of the candlestick.
Now, it’s time to focus on the Williams %R. This is the best momentum indicator. Which brings us to the next step of our momentum indicator strategy.
Step #3: Wait for the best Momentum Indicator to get overbought (above -20). Then rallies below the -50 level before Selling .
We’re going to use Williams %R, the best momentum indicator in a smart way. In an downtrend, we sell after the best momentum indicator has reached overbought conditions (above -20). And then rallied back below the -50 level.
Now, we have confirmation from both the price and the best momentum indicator. The real momentum is behind this trend and the probabilities are in favor of more downside prices from here on.
Note* If the best momentum indicator continually stays in oversold territory (below -80 level), it signals a strong momentum and conversely a strong trend. Inversely the same is true in a uptrend.
The next important thing we need to establish is where to place our protective stop loss.
Step #4: Place Your Protective Stop Loss above the Recent Lower Low.
We want to hide our protective stop loss. It is above the most recent lower low level that formed right before the best momentum trading strategy issue the sell signal.
Alternatively, you can also trail your stop loss above each most recent lower low. This strategy will allow you to lock-in the potential profits in case of a sudden market reversal.
Last but not least the momentum indicator strategy also needs a place where we need to take profits, which brings us to the last step of the best momentum trading strategy.
Step #5: You pick your own TP strategy or
Take Profit once we break above the Previous Lower Low
A trend in motion can stay in that state longer than anyone can anticipate. And since we want to maximize our potential profits we let the market tips it hands before liquidating our trades. In this regard, we look for a break in the trend structure. Respectively a break above the most recent lower low.
Alternatively, you can take profit once the best momentum indicator breaks above the -50 level.
Note** The above was an example of a SELL trade using the Best Momentum Trading Strategy. Use the same rules for a BUY trade.
Overbought

Massive sequence of RSI-Renko DIVINE™ Scalps Following Iran NewsThere were a total of 250-270 points of NQ scalps after the Iran missile strikes going long. If you held the first contract long on the swing trade (1st trade in the direction of the new trend is always the swing trade, marked by a fat arrow) you would have gained another 270 points.

Baker-Hughes - short - resistance hit - daily chartResistance on the Baker-Hughes daily chart is hit.
Both MACD & RSI are both overbought so we go for a definite short as there is a good engulfing bearish red candle on the 4 hour chart for an entry reason.
Success & Good luck. Enjoy your trading day.
Comments always welcome.

Adobe - AB=CD pattern - short - 52 week high - OBAdobe looks in great shape to short on the 4 hour (or daily chart) - just wait for a solid and simple entry reason as all the confirmations (so far) for a good short are apparent.
As always I wish you success, happiness & good luck!
Comments always welcome.

alibaba reaches 52 week high - short now or buy the dipAs Alibaba [BABA}, (currently in an uptrend), enters its 52 week high, and RSI & MACD are overbought, the time could be right to either:
A) buy the dip at support (aggressive trade) or at resistance (a more accommodating trade) at the levels shown.
or
B) for those most adventurous - an aggressive short is likely to 193 (approx) then wait to buy back the dip either from resistance at 191.74 - 193.56 or from the support level at 164.28 - 166.72 (which seems most likely).
Of course you could wait for an entry reason to continue the uptrend. However, always the aggressor, I would choose option (B).
As always enjoy the day, have successs & good luck!
Comments always welcome.

NZDUSDPushing to supply zone.. looking for shorts between 0.6750-0.6800. Watch for bearish price action

NZD/USD Outrageously OverBought NZD's newfound strength is artificial for the most part. Let's analyze: New Zealand's GDP report showed to be better than expected, but let's put that into perspective. In Q2, their GDP was revised down and you want to convince me that this 0.7% quarter growth is significant. The yearly GDP growth is still on a convincing downtrend. Many Banks still have the RBNZ down as giving a rate cut at the start of the year. Inflation is not where they want it to be. Yes, the trade war is making progress which is a natural provider of currency strength to the NZD. However, this is not enough substance to justify the strength of the current bull run. The ridiculousness is showcased in the RSI(14) which is showing 2-year highs. Expecting a sharp decline at the start of the trading week.
Disclaimer: I am not your financial advisor.

USDJPY - Clear Structure - Pullback Trading ChanceHi Traders!
The market is moving in very clear movements.
After it changed the side and 2nd December, it moved until the support at around 108.500.
After that it started consolidating in a descending triangle.
The upper trendline tilts down towards the support.
Today at 3pm GMT it got exploding pressure upwards and then it reaches the resistance area again.
Now it lost its price action and it have to make a pullback.
Furthermore, the stochastic is overbought too.
We recommend to sell the pullback towards the area of breakout.
Thanks and good luck :)!

ETHUSD Re-Entry pointMr. Pips RSI Add-On says ETHUSD is Overbought. Expect a retrace before a re-entry long. Info is on the chart. Drawings are just a general idea of price movement. The important thing to focus on is the Price area to re-enter.
Mr. Pips Quote of the day:
"Man is a Tool-using Animal. Without tools he is nothing, with the right Tools he is all!!!"
Mr. Pips wants you to have a blessed and profitable day!
HAPPY THANKSGIVING!!!
Disclaimer: All information provide by Mr. Pips and IgetPips.com is for educational purposes only and is not intended to be trading advice or trading consultation. You are responsible for your own personal finances and trades!

BTC Re-Entry PointMr. Pips RSI Add-On says BTC is Overbought. Expect a retrace before a re-entry long. Info is on the chart. Drawings are just a general idea of price movement. The important thing to focus on is the Price area to re-enter.
Mr. Pips Quote of the day:
"Man is a Tool-using Animal. Without tools he is nothing, with the right Tools he is all!!!"
Mr. Pips wants you to have a blessed and profitable day!
HAPPY THANKSGIVING!!!
Disclaimer: All information provide by Mr. Pips and IgetPips.com is for educational purposes only and is not intended to be trading advice or trading consultation. You are responsible for your own personal finances and trades!

SPY looking shakyI keep saying it; I think a pull back is needed. The higher this market goes without a pull back, the harder it might fall when it does pull back.

VET/USDT - TURNING BEARISHHi!
Alts been showing a lot of strenght this month, but it's time to take a breath, that's what it should be after 100% legs up.
VET seems strong enough to make new highs, but it face an important resistance as chart tell us... I think it'll accumulate as a triangle or symmetrical triangle and then we'll be ready to face gravity.
I would be long if above 0.006870 and my stop would be 0.006369.
Wait for a move above that green line, use stops.

DexCom Inc - Short OpportunityAs a beginner, I'm trying to learn everything I can about investing for the long term, but also trading in the intermediate and short term. With some successes and failures now under the belt I figure I would share my next opportunity.
DexCom's recent earnings release surprised the hell out of analysts, rocketing up 27% on that day and still rising now. Hence, my next short opportunity.
A stock continually pushing a 52 week high has no reference point for resistance, therefore it's best to rely on indicators and the trusty candlestick patterns.
The volume has been dropping steadily since the earnings, pushing into overbought territory it's never seen before. At the sight of a bearish shooting star, with no increase in volume, go short!
Set yourself some reasonable profit margins and stops. Chances are it will test the $185.20 it opened at after earnings, but if you want to be more cautious utilize Fib Retracements (38.2% to 61.8%) from it's peak.
Remember, don't be greedy and lock in profits when you reach your goals.

SPY - Testing Breakout SupportThe stock price is currently overbought & VIX was around 12 going into today's trading, suggesting increased volatility in the near-term. Bulls want to see this support hold to continue their momentum but we may see another pullback that takes the price back into the ascending triangle pattern.

SPX: Possible Paths to ATH from 2nd of Three DrivesOF course this is pure guesswork and sheer speculation. Maybe the ATH is already in on Friday. Although futurez are up as I write this, their fair values point to nearly the same prices we saw near the close Fri PM.
I marked this chart idea as Neutral, although it's really short-term bearish and longer-term bullish, until it becomes Bearish again in 2020.
A lot of new money will have to flow in to push higher from here, market is already in overbought condition.
It is a 3-Drive pattern, and an EW Ending Diagonal Triangle (see Mark Rivest post on the EDT for detailed insight- very fine analysis, kudos Mark and ty!):
I show two alternate paths in my idea. Many others, of course are possible:
Although overbought atm, but irrational exuberance could simply parabola up to the 1.62 Fibo at 3124, before distribution; or a bull wave pullback could begin this week and carry index down to retest the lower channel TL (in pitchfork).
A last desperate parabolic climb to stratospheric prices is likely to occur in January, two years since the last time we saw that in Jan 2018.
Expect a pullback soon in Nov, a terrific bullup to ultimate ATH, and another big break in Feb/Mar for Fib time and price.
IDEA: Just buy UVXY to play this rotation; accumulate VIX ETF shares when VIX <12. UVXY is the Proshares 1.5x ETF; when Vix gains/loses $2, ETF gains/loses $3.
On the last explosive Third Drive to the Top the VIX could get crushed to sub-10, as it was in Dec 2017 when it touched $9. Do not buy it too soon!
NB: You can also buy call options on VIX itself if you want max leverage and have strong appetite for risk. I suggest getting a LEAP call if you do; on Friday the April 2020 $20 call was $2.30 with Vix at $12.30. It's a pretty fair risk/reward, considering that in Feb 2018 VIX jumped from $9 to $29. High price on VIX was $70 on 10-01-2008.
This is not trading or investment advice, it is rank, sheer speculation on my part. Gamble on the futurez at your own risk! GLTA!

AMD Strength w 200 Day, expect a sell to $30 and bounce!Possibly Overbought at $36, but the 200 day plus positive trade war atmosphere should protect $29-30 levels. After that, we'll see if the uptrend can push through resistance with a bounce from $31 into possible new highs.

KSS - Gap Holding Back KohlsKSS had a gap down on earnings on May 21st. This is the third time price has gotten near or tested the gap resistance level & it has been rejected each time. Price seems to be falling from this level again as it sits in an overbought condition. It provides a short opportunity with a couple of Fibonacci Extension levels provided with the dashed green lines.

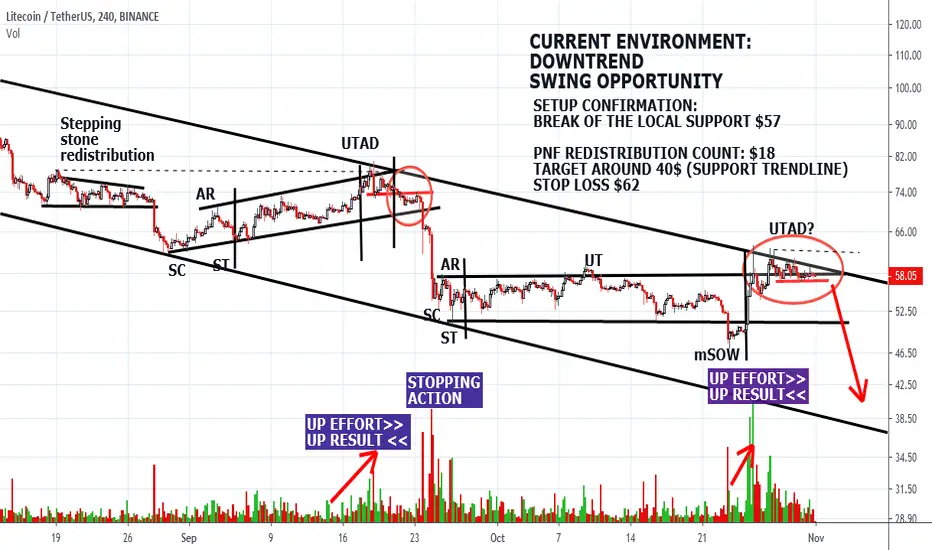
Litecoin Swing Trading OpportunityCRYPTO MARKET OUTLOOK: SHORT TERM BEARISH
SHORT SELLING CANDIDATE: LITECOIN (WEAKER THAN THE MARKET)
CURRENT ENVIRONMENT: DOWNTREND
SETUP CONFIRMATION: CLOSE BELOW LOCAL SUPPORT IN RED
INSTRUMENT: FTX FUTURES
Follow Alessio Rutigliano's blog on WyckoffAnalytics
www.wyckoffanalytics.com
Last article:
Swinging Cryptocurrencies
A case study of a swing trade using FTX futures
Is Apple about to lose at least 10 Bucks?AAPL is overbought and price is ranging above the EMA200 - pretty much the same situation as in May this year.
This won't be a full trend reversal but maybe it's a pullback - price might touch the trendline and then start to climb again.

CTRA BUY?Contura Energy, Inc. (NYSE: CTRA), Time To Buy?
If you are in the money making game probably you have one question in your mind:
How can I pick the next stock to invest in or to trade with?
Honestly, it`s not easy, but luckily you have multiple chooses in front of you.
Firstly, and this is a harder way, you can spend days of researching through thousands of publicly traded companies and expert advises and opinions.
However, there is an easier way to. For instance, you can look at the stocks that smart money investors are collectively bullish on. The idea is next:
Where the smart money goes, profits are flows.
Smart money, AKA hedge funds, and other institutional investors and professional traders usually invest large amounts of money and time, and they have to conduct due diligence while choosing their next stock to invest in, and trade with.
The truth is that they don't always get it right, but, on average, their picks historically generated stronger returns from 90% of retail, sessional traders. Especially after adjusting for known risk factors.
Speaking about hedge funds guys, let’s take a look at their recent activity with Contura Energy Inc. (NYSE: CTRA)
Let us be clear, CTRA is not among the most popular stocks, but it was in 22 hedge funds portfolios at the end of June.
A total of 22 of the hedge funds are bullish on this stock. At the same time there is a change of -31% from March.
Since CTRA has experienced a decline in interest from hedge fund managers, logic holds that there is a sect of fund managers that decided to sell off their entire stakes last quarter.
Still, the largest shareholder of CTRA, with a stake worth $118.5 million reported as of the end of March, is Whitebox Advisors. It is worth to mention that CTRA stock returned -46.1% during the third quarter and underperformed the market.
That is right, CTRA is deeply oversold at the moment.
Note this- At The Moment- because the price can still be in the red for some time, but rebound are coming.
The oversold levels are among the best ones to jump in and potentially to make solid returns. Same levels have the best Risk/Reword ratio, and as you know higher risk is to buy something what is already at the pick and overbought, comparing with buying at oversold levels such as this one.
From Technical Analysis point of view the price is near 3Y low.
The absolute low is at 16.59 level. The RSI, on weekly chart, with his current levels, between 20 and 30, suggesting that rebound can occur. At the same time this is a signal that the price is oversold and in a down trend. According to technical analysis the most reliable buy signal is when the RSI cross over 30 levels. Current value is 27.
On a daily chart RSI is above 40 level, and the support level at 22.58. Current price is 23.69 and potentially can test support level in near time. It is crucial to monitor this level and the RSI movement in order to find the best possible entrance.
Potential target can be found at 32.45 level.
According to analysts gathered on CNN money expected up movement is up to +52% at 36 level.
Example of trading plan can be with S/L at 22.50 (-5%) and T/P at 32.40 (+26%).

SPY Daily Chart - Overbought Bearish Divergence Short PotentialAs you can see in the chart, SPY has once again run into resistance at the $302 price range. The slow stochastic is overbought & seems to be turning over. There is also a bearish divergence forming between the price & RSI indicator. A 61.8% Fibonacci extension target gives us a price target that is near the current support line. It looks like a good time to take a short position in the SPY (VIX is also down around 14, good time to expect some more volatility).

Walmart - Overbought & Rising Wedge PatternRising wedge pattern with RSI bearish divergence & overbought stochastic. A breakdown in price can lead to a $115 price target which is a nice support level & 100% Fibonacci level.

WTI BEARISH USOIL rejected by 38.6 % Fibonacci Retracement @ 55.75
H4 chart had doji candle exactly on the higher edge of correction channel
volume profile show HVN at the same level
RSI show clear sell signal
