Initiate Panic Phase 1Price has tripled in 3 months despite negative earnings. Double top formation at the 15.7 level. IPO lockup period has expired. Bearish divergence on oscillators.
Qutoutiao Could Dip When IPO Lockup Expires
Overbought
MSFT short to 110Microsoft is a strong company. However, as of now the stock's been overbought. Pushing closer to record high, i never thought MSFT would go this far. It just seems... too good to be true. Target is 110 though 105 is ideal.. Volume MA is trending down currently. If you think otherwise, please leave a comment and let me know what you think.
One last pullback before the MASSIVE #Bitcoin | $BTC Breakout!?!One last pullback before the MASSIVE #Bitcoin | $BTC Breakout!?!
We think so. Elliott wave and fibonacci usually don't lie, so we hope
that you've opened a HUGE SHORT position at these overbought price
levels. As always, use STOP-LOSS or STOP-LIMIT orders to protect
gains, as well as limit potential losses on your trades!
[Signal] GBPCHF: Delayed Brexit is Positive? Nahh..GBPCHF
Timeframe: 1D
Direction: Short
Confluences for Trade:
- Stochastic Overbought momentum (1D, H4, H1)
- Price action at Resistance of Parallel Channel
- Price action close to Another Horizontal Resistance Trendline
- Widening gap of EMA
- Fundamentally, uncomfortable to hold a Long GBP position because of Brexit uncertainty; to us, a delay in Brexit transition is still going to be bad for the UK economy as corporates are not going to do any capital expenditure to improve GDP.
Suggested Trade:
Entry @ Area of Interest 1.3045 - 1.3165
SL: 1.3309
TP: 1.2602
RR: Approx. 2.56 (Depending on Entry Level)
May the pips move in our favor! Good luck! :D
*This trade suggestion is provided on an advisory basis. Any trade decisions made based on this suggestion is a personal decision and we are not responsible for any losses derived from it.
UJ Quick +25 pip ShortQuick, Simple, Analysis based on price behavior I've seen over and over and over.
DXY Directional bias is bearish but we could expect a bullish Legg upwards, however I've learned Trends usually tend to keep trending in their direction until major support. So I would say chances are bigger UJ will dump since we went up a lot and DXY bias is still bearish for now.
S&P OverBought, a pullback is coming.After a month's amazing rally, S&P is OverBought (Yellow), as shown in "9 Seasons Rainbow Indicator", OverBought appears in 1H, 2H, 4H time frames.
Similar situation appeared on Oct 2018, the difference is the time frame level with OverBought is higher than this time.
In addition, S&P is touching the previous resistance. A pullback is coming.
Rising Wedge on RSI (D) / RSI Overbough (D) / RSI Resistance (W)Rising Wedge on RSI (bearish pattern).
RSI Overbought (>70) in a bear market (short-term = bearish; long-term = VERY bullish).
In the short-term, the momentum is running out.
An RSI above 70 in a bear market in the long-term is a very bullish sign!!!
There is also resistance on the weekly RSI.
BTC: It will go sideways until next dropSo I was wrong, I overestimated BTC. I knew one thing certainly: That the weekly Stoch RSI would have to go into overbought zone again, because it hasn't been there
since a far too long time.
And that is indeed happening exactly as I thought.
However, the way it is happening, is different: Not through a strong bounce, nay, but by going painfully sideways, with a very slight tendency upwards, so that we still
go to overbought territory. This is of course genius, because by that, BTC can start the final drop from much lower, 4000 instead of 5000. Therefore, the bottom will
be consequently also 1000 USD lower than I thought.
In my previous analysis I identifited the MA300 as solid support, at around 2400 USD. However, I think it will be penetrated downwards for a short while, could go as low
as 1600-1800 USD. But it will strongly bounce above MA300 and the weekly close will be above MA300, so that it indeed will furtheron act as strong support.
It might do a double bottom like structure with a second drop a few months later, similar to the bottom accumulation zone in 2015.
I am still watching daily transactions, we are still below ATH, so I don't see any reversal yet. Halving date is now end of May 2020, so still plenty of time till there.
And still many people post charts about this being the bottom, therefore I am pretty sure that it won't be the bottom, hehe.
Yen Futures Primed for ShortingYen is ready to Short. We have Overbought condition on the Stoch RSI with strong selling volume appearing. Additionally, there is Hidden Bearish Divergence also present. Target is Oversold condition on Stoch RSI. Exit if Strong buying volume appears.
$SOLO - Will HISTORY repeat itself?!? Only TIME will tell...$SOLO - Will HISTORY repeat itself?!? Only TIME will tell...
USD/JPY Technical analysisUSD/JPY is on an upward trajectory movement with sustained pressure from the bulls.
According to Murray math lines 110.925 is the overbought zone.
We anticipate the zone to render selling pressure which could initiate a profit booking rally. Hence it could be a good entry point to initiate short positions.
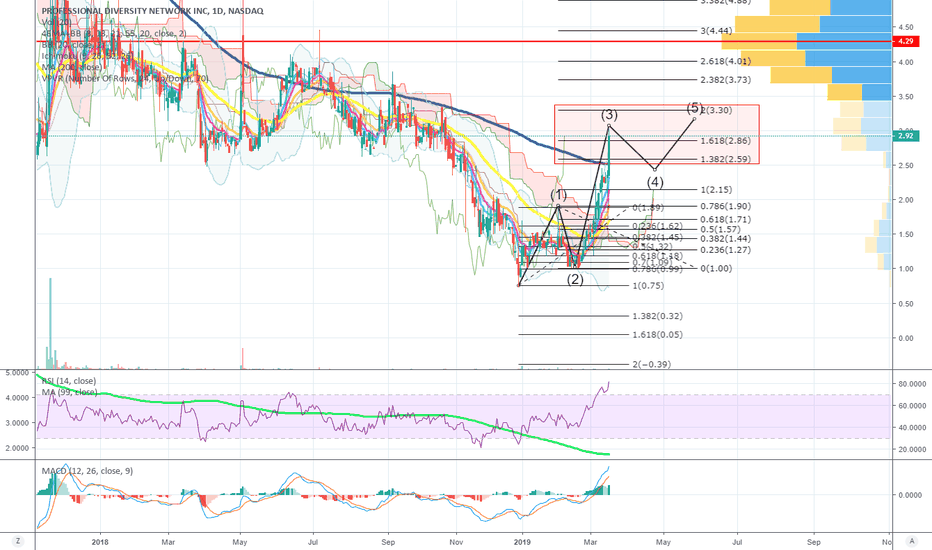
URGENT:Past pick $HYRE forming #DoubleTop w/ #BearishDivergence!URGENT: Past pick $HYRE forming #DoubleTop w/ #BearishDivergence! Starting to look like a GOOD PLACE to SHORT, however be sure to #LADDER in those orders at RESISTANCES!


