BTCUSD 15M/DAY STOCHASTIC STRATEGYThis trade is from our free pdf "15M/DAY STOCHASTIC STRATEGY"
PM me if you have any questions, I will be happy to help.
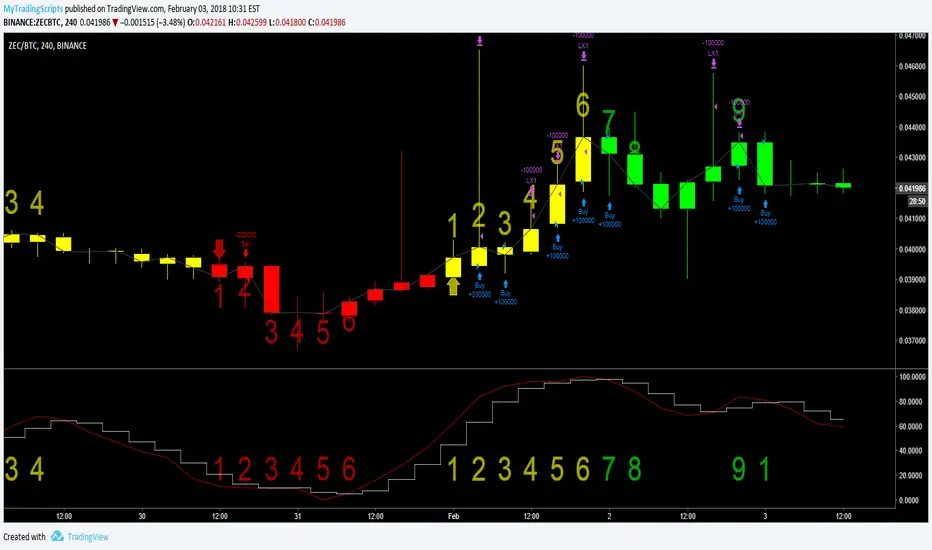
Overbought

GBPUSD - Descending ChannelThe previous chart showing this trade setup (along with the majority of my other charts) were hidden/deleted due to accidentally breaking the rules with my descriptions. Sorry guys!
I'm re-posting it since it was still on my screen... Black line is entry, green line is initial TP level, red line is SL.
I don't know how much of a demand there is for me posting here. I'm not sure if anybody other than those who are connected to me via other channels are even able to view these charts as visibility is skewed towards those with thousands of followers on the home page... So I'm unsure if I will continue posting. Maybe occasionally, I'm not sure yet... You guys know you can always PM me to discuss trade ideas though or ask for friendly advice.
But anyway, this is fairly safe, low risk trade. Enjoy.

BTC Bullflag but overboughtWe have a Bullflag forming on the 1 hr chart but the rsi and stoch has been sitting in the overbought area for sometime, so be careful, bullflags do fail, and we could see a drop 10200 before finding support.
Good Luck, I hope you made some money yesterday. It was a great day for profit.

EURNZD 4H Trade Setup-30m Timing-5m Entry PointThese 3 charts helps us understand how to use a 4H chart to find a trade, how to use a 30 m chart to find the market timing as not to enter too early into the trade, and the 5m chart to find the best entry point to give us the best risk to reward entry.
Macd helps us to find direction and reversal points from the Macd being over sold/bought from the stochastic 20/80 blue dotted level lines. The Macd red 0 level line helps to know trend bias (price above red 0 level possible bullish bias)
Take profit levels will be covered in an update.
Any question you have on the dual macd/stochastic send me a PM and I will be glad to help you setup this indicator.


TJX Stochastic Trending DownTJK Overbought Condition
Waiting For New Number And Color
Color Green
Number None

XRPUSD 4Hr Forming WedgeXRPUSD Almost Overbought
Waiting For Change In Hull Ma To Confirm Direction
Color Blue
Number None

QQQ Stochastic Overbought At The 80QQQ Stochastic Overbought
May Test Hull MA To Confirm Direction
Color Magenta
Number 3


USD/CAD : Short entry to 1.21 (R/R : 8) Hey guys !
Here is a nice potential short entry on USD/CAD .
Accumulation of :
- Bearish structure
- Fib 61.8 / resistance zone combo
- Standard deviation
- Weekly trendline
- SMA 100 & overbought combo
Im looking for a double top on the channel
You can follow me for more high probability setup .
Good luck ! :)

XRPUSD Overbought At The 80XRPUSD Waiting For Change In Color On Hull MA To Confirm Direction
Color Green
Number 7


BTCUSDT 3 Chart Case StudyWe are going to study over the weekend how this pair moves.
We have a 4H - 30m - 5m chart opened.
We are going to study how price moves around our 50/100 sma
We are going to watch how the macd moves around the macd 0 level line and
the stoch 20/80 levels - blue dotted lines
The 4H is in-between the 50 and 100 sma. This I call an inner range. it has no real direction or momentum. When price breaks out of the inner range it will have direction and momentum. Watch this pair over the weekend and make copies of your chart with the camera in the lower right corner.
The 4H macd is above the 80 level. Price can go half way across to the 100 sma and fall back to the 50 sma because the macd is above the 80 level. Let's watch and see if it does.
Price may just go across to the 100 sma so let's watch if that happens and what the macd looks like during that.
If price does come back to the 50 sma two things can happen. It can break below the 50 sma and retest the swing low on the 4H. or price will try a second time to make it across to the 100 sma. Watch how the macd looks like during all of this and make sceenshots. We are not trading here we are just studing and educating ourselves how to use this indicator. As the 4H is doing all of this you want to be watching and documenting how the 1H and 5m charts look and how they are acting in these different situations. This is a great pair to teach you all of the ebb and flow of price and how the indicator reacts to it.
You are watching on the 30m and 5m how price moves around the 50/100 sma and how the macd is moving around the 80/20 levels and the 0 level line.

SNAP - You guys seeing this?>be Snap Inc.
>announce first ever earnings "beat"
>"we blew less money than expected"
>moremoneypls.emoji
Get yourself some March/April puts


ETHUSD 3HR Overbought At the 80ETHUSD Testing The Hull MA, Stochastic s Overbought
Color Green
Number None

BTCUSD - Bulltrap and Rollercoaster ahead + psychology analysisThis is no wizardry: don't look so much for cause-effect in the news, when the charts can offer a lot more insight:
The trading bots belonging to bigger and smaller whales are running on auto and manually, all to fine tune the milking of larger and smaller investors who think that now the crash ("correction") is finally over.
Their algorithms are well-designed and now adapting to more buying orders in order to lure even more fish into their BULLTRAP.
Yesterday, 6th Feb 2018, we already fell to 5800-6000 (depending on your sources) which nearly exactly corresponds to the dip on 12th Nov 2017.
Will we retest this area again?
Sure we will.
Revisiting 6000 and below might even cause more panic selling which will result in an even deeper fall to 5500 (25th Oct 2017) or 5200 (18th Oct 2017) or 4200 (5th Oct 2017) or 3600 (22nd Sep 2017) or 3000 (15th Sep 2017)
Not trying to paint it black, simply listed a few major dips in the last 5 months.
If you have observed the global crypto market cap volume in the recent weeks you have probably realized that pumps&dumps do differ in length, intensity and frequency.
Generally now normal investors are not only desperate but also confused and hopeful that BTC might be going to the moon again only to be deceived by a _longer_ upward motion and getting eaten by the sharks again later around 8000-8500.
Meaning that they simply want to build up more hope in crypto-investors by increasing the duration of uptrends.
Until 70% fall for the FOMO finally. Everyone would like to believe that crypto will moon anytime soon to the all-time-high of 19900 but this is merely just wishful thinking as historical charts nearly always show a 80-90% retrace after such a steep rise. Compare the 75% retrace from Dec 2013 to Jan 2015 (from 1000 to 250) - was a long correction, this time it shouldn't take that long.
Don't be fooled, the market is still bearish , controlled by bots, just cleverly disguising it with 'news'. And don't panic.
How many bulltraps will we face now? A few - just watch the charts - I don't have a crystal ball either to predict when exactly. How will the crypto market react to the G20 meetings in 2018?
Maybe things will stabilize around Chinese Lunar New Year 16th Feb 2018, maybe not, considering that now it got a lot harder for people in China to acquire crypto.
Some say that it's _not_ wallstreet vs. crypto but the old system hardliners won't just give in / give up easily.
Or not without profiting from the new development.
Regulations and FUD and obstacles in our way will be spread frequently, which will partly increase the popularity of crypto anyway since most people by now know that it's sometimes a good idea to investigate topics deeply that mainstream media, g0v and corporate representatives portray as 'bad' or 'concerning'. Especially if it could affect their financial pyramids in the future.
While the crypto market still has a lot of room to grow, considering visualizations such as: www.visualcapitalist.com
One could think all this represents "fear of change" on the part of large institutions, although it's more likely that they're already invested and don't want 70% of the herd to follow.
The same with wishful thinking on our part - don't just "hope for a good change" so we can go to the "moon".
Actively supporting this innovative technology is key. Get involved with projects, learn programming, get in touch with the teams.
The more strong projects there are, the more solid and diverse the whole crypto world becomes.
Basically they don't want to crash this market totally as they are already making tons of $$$ via bots moving in&out massive amounts and the high volatility which is a lot more fun for trading than stocks.
This is not professional investment advice.
Might be a good idea to use the next dip for a small / medium position, but not clear if it will be the last major dip or if it will dip even deeper.

BTCUSDT Returning to the previous channelMarket grew up significantly during this night, volume is also rising. BTC price went up and returned to the previous channel after the rebound from Fib 1 support level. In a very optimistic scenario it has chances to consolidate there after a small price decrease as it is in the overbought zone. Then important resistance level of Fib 0.786 will be broken and the price will head to the upper edge of the channel and after consolidation and bounce from a formed support around $8900 will broke upward the descending channel and may head to the next resistance level of Fib 0.618. This will be a critical moment for the market recovery. In the realistic scenario we may face with other manipulations and dumps, but overall significant volume rising is a good sign.


GBPUSD testing a major resistance : SHORT Price is approaching a major resistance that has already been rejected on the daily chart. The price respected the Fibonacci extension levels and RSI shows that price tends to be overbought at this major area. I would expect a major drop to the major support at 1.36 area. I would suggest then : SL at 1.39600 with a TP at 1.36181

EUR/AUD : Quick short & High R/R Accumulation of :
- Resistance zone
- Fibonacci confluance
- Standard deviation
- Bearish structure
Good luck !
2018 will be a good year for me and my follower , don't miss the train !
