UK100 On Strong ResistanceUK100 is at the moment touching the strongest 7600 resistance line. There are now 2 topping tail which indicates rejection of closing the price higher. Also RSI(14) is currently nearing the overbought territory. If price can close around 7570 level, I'm planning to short it with profit target is somewhere around 7445, which is the previous strong support line.
Overbought

NZD/USD : Daily Short** ( High R/R) Here is a nice potential short entry on NU
Accumulation of :
- Fib confluance
- Resistance zone
- Trendline retest
- Standard deviation
- Overbought & Moving average combo
There is 3 targets on the chart , I will put my stop Loss at entry point quickly .
You can follow me for more analysis !

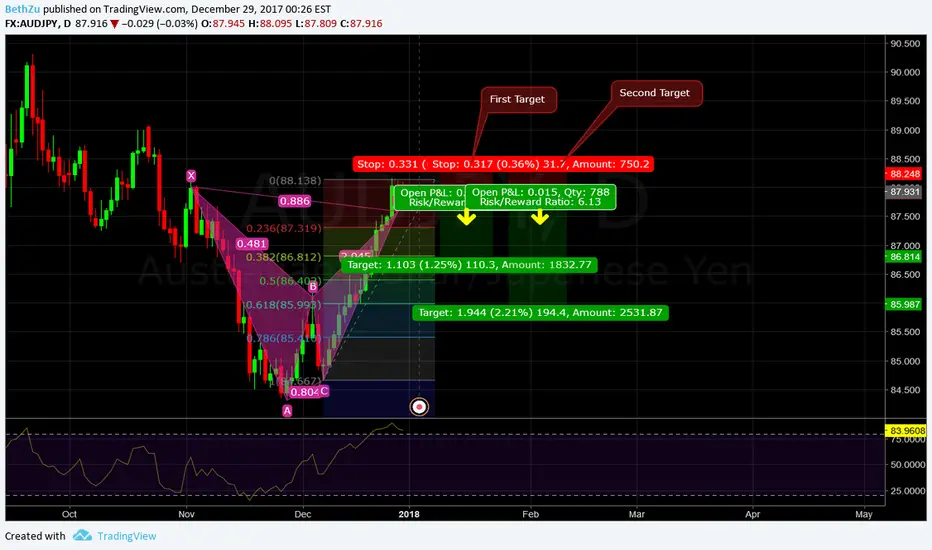
Bat bearish pattern completed and the RSI is very high...A Bat Bearish pattern was completed at 87.600 and right now price is been rejected by an important selling zone... and with the RSI showing over bought, for me it is an amazing moment for short... what do u see guys?...
XMR - Trend analysis (SHORT)Alright, looks like Monero (XMR) has been overbought and a short position would be the most optimal here.
We have crossed the support line which supported this current trend, and now the market is looking for the new support level.
Given the current base support line, I think a very reasonable target price would be $230.
Trade cautiously!

IOTA Gann Fan + Trend Analysis - SHORTIOTA was Overbought twice in a short period of time. There will be heavy volatility in the near future, and market consolidation is to be expected.
Given the current trends, I personally believe that shorting IOTA would be the best choice here. The price is nowhere near a 1/1 retracement, and is showing little signs of a reversal into a bullish trend in the (very) near future.
Also, with all the other coins I took a look at, it looks like a correction is imminent across the board. Be cautious!
I'll take a look back soon to help confirm/deconfirm what is being shown right now, but it's not looking too good.


ZECUSD - Trend Analysis + Gann Fan + Head/Shoulders (SHORT)Not lookin' too good for ZCash here.
Very clear bearish trends. Not even close to the 1/1 retracement angle to be considered at all bullish.
ZCash was overbought heavily at numerous points in recent history, and ZEC is still fighting the inevitable correction.
The uptrend wave on the right shoulder is a bulltrap, and that we're going to see ZCash heavily in the red in the near future.
Trade cautiously!

USD/JPY : H4 Sell Entry ** (Target 110)Hey guys whats up !
Here is a nice entry for UJ
Accumulation of :
- Resistance zone
- Standard deviation
-Overbought
-Abcd
- Possible HS formation
- Bearish structure
- Breakout and retest
There is 3 targets on the chart and a breakeven lvl .
Good luck and follow me if you want more analysis :) !

BTC correction idea for this monthSo a correction is in play now, and BTC likes to do 30-40% corrections in this runup since the end of 2015.
This woul coincide with the middel 1d bollinger band, and would allow the 1d stoch RSI to cool down again from overbought levels to oversold levels. This would lead to an exceptional entry point within the next few days to go long.
However, I strongly advise against shorting, because there is a not so low probability that BTC will just continue the rally on monday, and the full correction will not play out.
This is a scenario to which I attribute a probability of about 60-70%. Since BTC is in ultra bull mode, the whole correction might not even come to pass.
However, the indicators say that it is quite possible, so I will position myself accordingly, as this would be a perfect entry for a new long position. The next days/week till the 18th, and on the 18th especially, might show some insane volatility, so be careful :)


EURAUD--"X-ray anatomy" of a good Trade to comeEURAUD--"X-ray anatomy" of a good Trade to come.
An overview scheme that might explain what is happening with this pair.
Just Grab a good Trade..Cheers!

USD/JPY : Short entry to 110.20 Hey guys
Here is a nice potential entry on USDJPY
Accumulation of :
- Retest of resistance zone
- Fibonacci confluance
- Trendline & bearish structure
- Will be overbought
Good luck :)

NZD/JPY : Potential short Entry ( Daily ) Hey guys !
Here is a nice potential short entry on nzdjpy .
I will look for a reversal confirmation on this one , because nzd look exhausted .
Good luck

USDCHF D1 SHORTLooking to short this pair on lower timeframe, bouncing of resistance level at 1.0000
Take profit target at 0.9856

CAD/JPY : Short Entry (H1)Hourly short entry on cad/jpy .
Accumulation of :
- Double fibonacci + pivot point confluance
- Overbought
- Bearish structure
- Breakout and retest of uptrend
There is 3 targets as you can see on the chart
I will put my stop loss at entry price when first target is hit .

USD/JPY : H1 Short Entry (R/R = 4)Accumulation of :
-Breakout and retest
- Overbought
- Resistance zone
- Bearish structure
Good luck !
