✅NZD_CAD SHORT FROM RESISTANCE🔥
✅NZD_CAD went up sharply
And the pair is locally
Overbought so after it hits
The horizontal resistance level
Of 0.8287 we are likely
To see a bearish move down
SHORT🔥
✅Like and subscribe to never miss a new idea!✅
Overbought

Avalanche(AVAX): Near The Major ResistanceAVAX has had a magnificent bullish movement during the past few past weeks but it seems like it is getting tired and bulls are not feeling so pushy
There are high chances to see prices rebound near lower zones for some kind of correction!
Swallow Team

Ethereum(ETH): Will We Head Towards $3500 Soon? We are back with the ETH coin, where we see that after that major breakout near $2150 we had, a clean re-test price seems to be ready for another bullish movement sooner or later.
As we are getting closer to the close of the yearly candle price, it seems to act like a "calm before the storm," where the price is making minimal moves but still teasing both buyers and sellers.
We are looking at a bigger picture here for a potential bullish movement after breaking that upper resistance line (orange line). Once. we break and secure it we should be good for long-term movement towards $3500

Bitcoin(BTC): We Had A Dump, Did You Sell Like We Did?The new week is here, and the first day is looking promising for bulls, but is it enough for a push??
Let's be honest here: prices were way to high and still are (pre-halving push is not good for BTC)
We are seeing this as a nice start of downward movement here and we see almost zero to none chances of price reaching $50K as of now (but who knows, we might change our mind about it as we have to judge the coin in its current state)
One point of interest for us is also the $45K zone, which might be re-tested one time before further movement, so eyes open at that zone. Overall, we are still seeing further movement to the FWB:36K zone at least.

Bitcoin(BTC): Another Rejection At $45,000With the new weekly opening, we see another week (the last one) closing below the strong resistance zone at $45K. Resistance is holding strong, and the new weekly is showing yet further weakness.
Sure, ETF news and rumours are putting some uncertainty into traders, but nevertheless, one thing is sure: wealthy people would benefit more from rejecting or postponing the ETF.
With that being said, we are still looking for BTC to go into the liquidity grab zones. We personally are still short.

Bitcoin(BTC): Fake ETF Approval = Markets Dumped!Here we are touched nicely by that FWB:48K zone that we have been telling you about and also which activated for us the third and last entry on our short position.
We are now looking to see no more further growth here and more downward movement, for sure!
As we mentioned already, we see that fake news we had was like a small test run. People have seen an approval, yet markets dumped even before the confirmation of it being fake announcement. Traders are shorting and going by the rule of "Buy The Rumor, Sell The News."
Swallow Team

Bitcoin(BTC): Markets Are Extremely Greedy!! Be Careful!!The second day of the week started with some breakouts from $45K, which has been one struggle zone for many days already. Now that we have broken that zone and resulted in another big green candle (which lately has been common), we have entered into the "Extreme Greed" situation with the marekts!
Only based on that index can we assume that we will see a drop, but this is one good additional confirmation for us that we are going to see a nice potential downfall very soon!
Greed and Fear Index: Extremely Greedy / 76
Swallow Team

Dogecoin(DOGE): Has reached Major Resistance / Rejection? DOGE is at a pivotal moment, as it confronts a significant resistance zone. After a substantial rally, the RSI is telling us that the market is overheating and entering overbought territory. This could indicate that a correction is near the corner.
We're watching for a decisive move; a sustained break above the resistance could signal continued bullish momentum, while a rejection might lead to a retracement towards the lower support levels at $0.08230 and potentially to $0.07535, which are our current targets as we stay below this resistance zone. As always, we'll look for confirmation in the price action and other indicators before making any moves.

Bitcoin(BTC): Rejected $45K Zone!!!We got what we came for!! We have a very nice rejection near the $45K zone, which shows demand for further movement to lower zoes.
Remember, the longer the tree grows, the harder it falls. We are still way too expanded and overbought on BTC, so keep your eyes open for potential further movement to lower zones!
The start looks promising, but we gotta be careful for any short-squeeze!
Swallow Team

Bitcoin: We Are Entering Re-Accumulation PhaseWith the expansion phase being on the higher high zones, we are soon to enter the re-accumulation zone, which means we might see some sharp movements soon and a potential movement to the lower zones to liquidate the majority of the long position before finally entering the bullish market!
We are still 4 months away (around 127 days) from the next halving, and recently we witnessed a nice expansion phase that resulted in a ROI of 175%. This is more than enough for the expansion, which means we are going to enter very soon into the re-accumulation phase.
Swallow Team

Bitcoin(BTC): Did not secure $45K zoneThird day of the week, and BTC is going to attempt another breakout here! With last daily candle closing below $45K zone, we did not get confirmation of a breakout from that resistance zone, which is good for sellers (and us as well)
But the new daily is already showing some strength, potentially going for another attempt to secure that zone!
What's also crossing our attention is that while it is going for another attempt, it is also pushing to stretch the Bollinger Bands, which, usually in combination with resistance, has been a good strong spot! The plan is still the same!

Bitcoin(BTC): FVG Zones Can Be Filled Soon!On the first day of the week, we are showing you the major FVG zones that are still are waiting to be filled (lowest being near $26K zone)
As for the major picture, we already told you guys that we are shorting the BTC coin and targets are near the $32K zone.
The major resistance has been holding strong for now, but we might see one last short squeeze before the downward movement, so be careful here for sure! Do not overleverage if you trade on your own!!
Swallow Team

Bitcoin(BTC): Struggle To Break $45K - Good Moment To DCA!For the last 21 days, the price of BTC has been held back by that major resistance zone at $45K, which is giving us a small clue that the volume of buyers is decreasing, and with every new weekly candle, we see that they find it harder and harder to break that resistance.
With the amazing pre-halving pump markets have had so far, we see the dominance of BTC getting back on its feet (with the fact that yesterday's small drop resulted in some major moves on alt coins).
We are still seeing a nice breakdown happen to reclaim those major liquidity zones at $34K and $26K as well. Be safe and trade smart; this week will be hard on many traders for sure!

Ethereum(ETH): Smaller Timeframe ScenariosETH, on a smaller timeframe, is showing us some interesting patterns as well. As we can see, that upper, smaller resistance is primarily holding price, which will determine the following significant movement.
Breakout + Re-Test = Bullish Movement
Rejection + Re-Test = Bearish Movement
Swallow Team

Bitcoin(BTC): First Weakness In 60 Days = Liquidity Hunt StartsThird Week: We are seeing a nice rejection happening near the $44,500 zone, where the last weekly candle closed with nice and good dominance from bears. With that being said, we are seeing the first weakness kick in since October 16th (2 months of straight green candles).
Now that the first weak link has accrued, we are seeing a nice start of downward movement, which can easily reclaim a lot of FVG zones on the lower timeframes, where also the majority of liquidity is!
The start is nice, so let's see if we can keep it up from this point!

Bitcoin(BTC): Hard To Break That $45K = We Start To SellWith holidays just around the corner, the price of BTC is having hard times breaking that major $45K zone, which has been some kind of resistance for quite some time.
With that being said, we see a weakness in volume from buyers, which is also good for us as we are getting ready for a potential major correction to happen before the next bullish market cycle.
Swallow Team

Cosmos(ATOM): Waiting For A Re-TestRejection from a key resistance area suggests a potential trend reversal. After a promising rally, resistance rejected ATOM's price, providing an opportunity for a potential entry into a bearish move.
If this rejection signifies a true sentiment shift, we may witness a pullback towards the next substantial support levels, mapped around the $9.68 and $8.51 price points. So in short, we are waiting for that lower trend, which was broken, to be re-tested, potentially giving us a good entry for some short-term push.

Bitcoin(BTC): Near $45K Zone!! We Are Soon ShortingBitcoin has had a nice rally to the upper zones, for which we have been waiting for some time now. As the price approaches our major target, we are getting ready to short BTC (most likely DCA).
Our point of interest is also the FWB:48K zone, which can be taken as a quick liquidity movement, but the major target for us still remains the unclaimed $34K zone and the $26K zone as well. We are expecting very good returns on investment soon!
Swallow Team

Cardano(ADA): Time To Short! The price has recently formed a rounded top, indicating a bearish reversal pattern. A critical support line around $0.5486 is currently under pressure. If this level fails to hold, there's a strong likelihood of a breakdown.
This potential breakdown could accelerate a move towards the next significant support levels. We monitor this support closely for signs of either a bounce, which could offer a bullish scenario to upper zones (small one), or a breach, which may confirm the bearish outlook. A decisive daily candle close below this support could be used as confirmation for a bearish outlook.

Bitcoin(BTC): We Are Going Towards Re-Test ZoneSince yesterday, we have been having a nice movement so far toward our major resistance zone, potentially fulfilling that re-test we have been waiting for!
We are aiming here to see the price hover near this zone and open a nice mid-term short position with some major targets and FVG zones to be filled during that movement we are looking for!
Swallow Team

FRANCE40 forecastRSI few days ago was record high 82 on daily chart, which means the market heavily overbought. No market is going up constantly. Correction is expected to happen anytime, with two potential targets at 20EMA or 50EMA.
I don't believe the approach of soft landing on recession. In my opinion the recession will come and when it comes, it will hit hard.
It's normal for markets to rally at the end of the year, statistically beginning of January is a little cooling off period.
*This is not a trading advice. Trading is risky. Always do your own analysis before entering the market.*

Bitcoin(BTC): Do Not Miss That DROP! Bitcoin is showing some weakness at the start of the day, with the price heading back towards the $40K zone.
As our major target are those lower zones (in order to grab all the liquidity there), we are also looking at a potential re-test to the $45,000 zone before that final major drop! Eyes open for sure and not rushing much into "FOMO" mode of missing that potential nice drop!

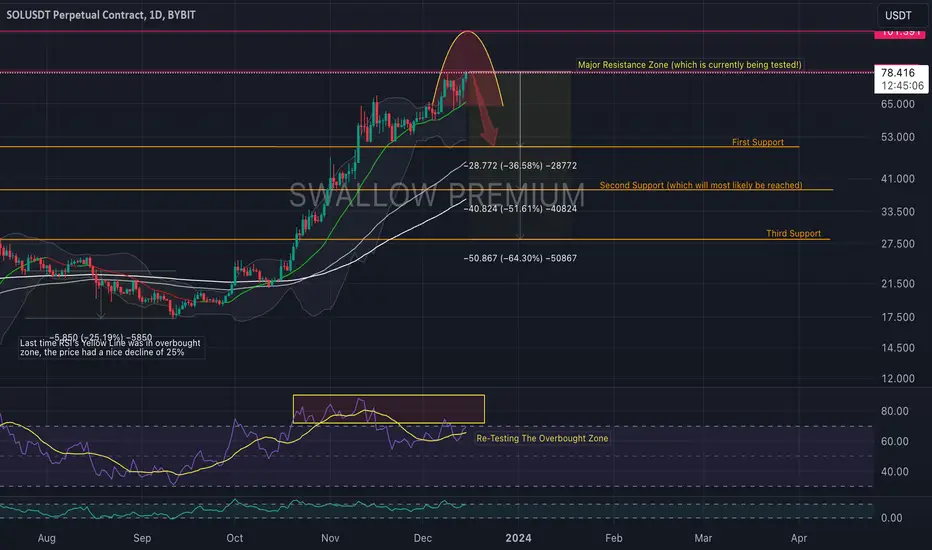
Solana(SOL): Major Resistance Is Approached!!!We see a good potential for retracement from the major resistance zone at approximately $79, which is currently being tested. The RSI is hovering near overbought territory, indicating potential for a price pullback.
So with that being said, we are aiming here for three major zones. We have displayed three key support levels: the first support at around $53, followed by a more substantial second support at $41—which appears likely to be tested—and a third support at $27.5.