XAG/USD ↘️ Sell Trade Setup ↘️Hello Everyone 🙋🏽♂️
We are in supply zone with an overbought RSI indicator.
🟠 EP 23.92943
🔴 SL 24.35149
🟢 TP1 23.48040
🟢 TP2 23.06730
🟢 TP3 22.65874
We are not responsible of any losses for anyone, our trades are profitable more for long terms and we take losses as everyone,
manage your lot size as well and your SL and TP and my opinion is 0.01 lot for each 500 $.
Don't forget to hit the like bottom and write a comment to support us.
Follow us for more 🙋🏻♂️
Best Regard / EMA Trading .
Disclaimer:
----------------
It's not a financial advise, As everyone we take losses sometime but for long term trading we are profitable traders, so manage your account well with SL and TP and your lot size to keep your account safe and stay in the market
Overbought

CHF/JPY ↘️ Short Trade Setup ↘️Hello Everyone 🙋🏽♂️
Overbought + Breakout
🟠 EP 167.043
🔴 SL 168.309
🟢 TP1 165.828 ⚠️( Close 33% of the trade and Set the SL on EP )⚠️
🟢 TP2 164.401 ⚠️ ( Close 33% of the trade )⚠️
🟢 TP3 163.246 🔥 ( Final result)🔥
We are not responsible of any losses for anyone, our trades are profitable more for long terms and we take losses as everyone,
manage your lot size as well and your SL and TP and my opinion is 0.01 lot for each 500 $.
Don't forget to hit the like bottom and write a comment to support us.
Follow us for more 🙋🏻♂️
Best Regard / EMA Trading .
Disclaimer:
----------------
It's not a financial advise, As everyone we take losses sometime but for long term trading we are profitable traders, so manage your account well with SL and TP and your lot size to keep your account safe and stay in the market

AUD/CAD ↘️ Sell Trade Setup ↘️Hello Everyone 🙋🏽♂️
Overbought + Supply zone
🟠 EP 0.89430
🔴 SL 0.89605
🟢 TP1 0.89255⚠️( Close 33% of the trade and Set the SL on EP )⚠️
🟢 TP2 0.89075 ⚠️ ( Close 33% of the trade )⚠️
🟢 TP3 0.88895 🔥 ( Final result)🔥
We are not responsible of any losses for anyone, our trades are profitable more for long terms and we take losses as everyone,
manage your lot size as well and your SL and TP and my opinion is 0.01 lot for each 500 $.
Don't forget to hit the like bottom and write a comment to support us.
Follow us for more 🙋🏻♂️
Best Regard / EMA Trading .
Disclaimer:
----------------
It's not a financial advise, As everyone we take losses sometime but for long term trading we are profitable traders, so manage your account well with SL and TP and your lot size to keep your account safe and stay in the market

NEAR/USDT Short Sell Trading ⬇️Hello Everyone 🙋🏽♂️
Overbought + Supply zone
🟠 EP 1.980
🔴 SL 2.081
🟢 TP1 1.860 ⚠️( Close 33% of the trade and Set the SL on EP )⚠️
🟢 TP2 1.740 ⚠️ ( Close 33% of the trade )⚠️
🟢 TP3 1.618 🔥 ( Final result)🔥
We are not responsible of any losses for anyone, our trades are profitable more for long terms and we take losses as everyone,
manage your lot size as well and your SL and TP and my opinion is 0.01 lot for each 500 $.
Don't forget to hit the like bottom and write a comment to support us.
Follow us for more 🙋🏻♂️
Best Regard / EMA Trading .
Disclaimer:
----------------
It's not a financial advise, As everyone we take losses sometime but for long term trading we are profitable traders, so manage your account well with SL and TP and your lot size to keep your account safe and stay in the market

AAPL's Overbought Indicators Hint at Possible CorrectionCurrently, Apple Inc. (AAPL) shares are presenting intriguing signals for discerning investors. Two key technical indicators, Stochastic RSI and MACD, provide indications that AAPL may have reached a point of overbought conditions.
Stochastic RSI, serving as a measure of market saturation, highlights AAPL's overbought condition, suggesting that the price has likely reached a level prone to correction or decline. Furthermore, MACD shows negative divergence, indicating the potential weakening of the upward momentum in prices.
It is essential to direct attention to the Support and Resistance level (SNR) around 182.34. This level not only boasts a strong history as a previous resistance level but may also play a significant role as a support level.
However, it is crucial to bear in mind that trading always involves risk, and trading decisions should be based on comprehensive analysis and well-calculated risk assessments.

SPX : Overbought zone by Band of Midas
Nothing much here. Just a reminder.
Personally, i took my handsome profit.
1. 5 green candlesticks overbought.
2. Go into Upper Band of Midas.
3. Take profit and wait the next entry near mid midas line.
Huge profitable week. Took profit and have a good weekend. #bandofmidas

GOLD Technical Analysis! Sell!
Hello,Traders!
GOLD keeps growing
And seems unstoppable
However, it looks overbought
So as it is about to retest the
Horizontal resistance of 1950$
I believe a bearish correction
Is to be expected
Sell!
Like, comment and subscribe to help us grow!
Check out other forecasts below too!

USDJPY - Getting Over-Bought ❗️ AgainHello TradingView Family / Fellow Traders. This is Richard, also known as theSignalyst.
USDJPY has been overall bullish trading inside the rising broadening wedge pattern in red, however it is currently approaching around the upper trendline.
Moreover, the zone 150.0 is a resistance zone and strong round number.
🏹 So the highlighted purple circle is a strong area to look for sell setups as it is the intersection of the blue resistance and upper red trendline.
As per my trading style:
As USDJPY approaches the purple circle zone, I will be looking for bearish reversal setups (like a double top pattern, trendline break , and so on...)
📚 Always follow your trading plan regarding entry, risk management, and trade management.
Good luck!
All Strategies Are Good; If Managed Properly!
~Rich

#OIL selling opportunityHi dear traders and colleagues, lets look at oil and see if there is any selling opportunity in this commodity or not.
As you can see on the chart we have done a research and find out that any time when stochastic indicator is in overbought in Weekly timeframe and cross below cross below its signal line we have seen a bearish move by the price.
Other things that gives us more confluences to take this trade is the fact that price currently is testing resistance area and also close to tentative bearish trendline.
from fundamentally perspective also we know although we shortage supply by the side of suppliers especially from Saudi Arabia but the fact that we are close to the end of hiking cycle by the central banks and as a result we can see some damages in economic which cause lower demand for the oil.
These are all showing that at least having a bearish correction move in Oil prices is possible and even if price wants to go higher we can have correction from this area.

VRAUSDT Looking Severely OverboughtA potential Reversal on VRAUSDT is imminent as things are looking incredibly overbought at the moment.
To further back the point of a potential reversal, Bitcoin, which leads the crypto market, is also looking oversold.
On higher timeframes, a reversal has not been signaled yet, but things are also looking oversold.
There can be a potential short squeeze before making it's way down.
This is not financial advice, all ideas are for educational purposes only.

SPY- Bearish- UpdateHas been a while since I've posted an update on the SPY as a lot has transpired in financial markets over the past few weeks, and months. The SPY has been trading significantly under its average daily volume, which has primarily been the driving force behind the momentum in my opinion. On the other hand, the SPY is holding a nice symmetrical triangle on the weekly timeframe. Nonetheless, buyers and sellers continue to battle, however, on the daily timeframe the SPY is overbought on the RSI, and two Bearish Megaphones are currently still playing out. The SPY is yet again, at a make-or-break spot in my opinion. If we see another leg down, we could see a re-test of the COVID-19 trendline support. As I've said before and will happily say again, where I stand, we're in unchartered territory - Just some support and resistance levels to keep an eye on in the interim, along with some RSI-based supply and demand zones, staying hedged. --Previous Charts Attached In Description --
Weekly Timeframe
Daily Timeframe
Covid-19 Trendline Support

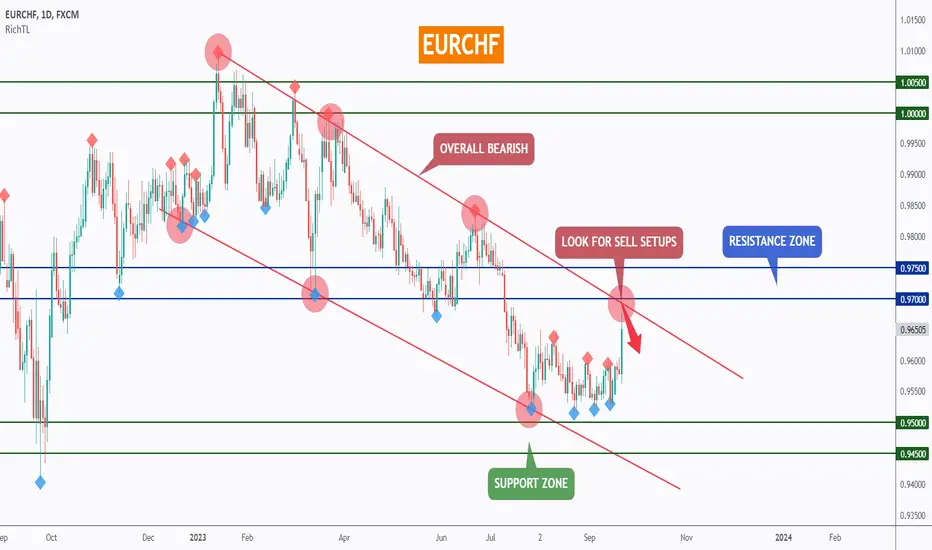
EURCHF - Already Overbought ↘️Hello TradingView Family / Fellow Traders. This is Richard, also known as theSignalyst.
EURCHF has been overall bearish trading inside the falling channel in red, and it is currently approaching around the upper trendline.
Moreover, the zone 0.97 - 0.975 is a strong resistance.
🏹 So the highlighted red circle is a strong area to look for sell setups as it is the intersection of the blue resistance and upper red trendline acting as a non-horizontal resistance.
As per my trading style:
As EURCHF approaches the red circle zone, I will be looking for bearish reversal setups (like a double top pattern, trendline break , and so on...)
📚 Always follow your trading plan regarding entry, risk management, and trade management.
Good luck!
All Strategies Are Good; If Managed Properly!
~Rich
USD-CHF Short From Resistance! Sell!
Hello,Traders!
USD-CHF is going up
To retest the resistance at 0.901
And the pair is locally overbought
So I think that we will see
A local bearish correction
After the pair hits the resistance
Sell!
Like, comment and subscribe to help us grow!
Check out other forecasts below too!

CADJPY - Waiting For The Bears!Hello TradingView Family / Fellow Traders. This is Richard, also known as theSignalyst.
on H4: Left Chart
CADJPY has been overall bullish trading inside the rising channel in orange, however it is currently approaching around the upper trendline.
Moreover, the zone 109.0 is a strong supply. So we will be looking for sell setups on lower timeframes.
on H1: Right Chart
CADJPY formed a valid channel in red but it is not ready to go yet.
For the bears to take over, we need a momentum candle close below the last high marked in gray.
In this case, we will expect a shift in momentum from bullish to bearish.
Meanwhile, until the sell is activated, CADJPY would be overall bullish and can still trade higher inside the resistance.
📚 Always follow your trading plan regarding entry, risk management, and trade management.
Good luck!
All Strategies Are Good; If Managed Properly!
~Rich

CADJPY - Approaching A Strong Supply 🔎Hello TradingView Family / Fellow Traders. This is Richard, also known as theSignalyst.
CADJPY has been overall bullish trading inside the rising channel in orange, however it is currently approaching around the upper trendline.
Moreover, the zone 109.0 is a strong supply.
🏹 So the highlighted red circle is a strong area to look for sell setups as it is the intersection of the green supply and upper orange trendline acting as a non-horizontal resistance.
As per my trading style:
As CADJPY approaches the orange circle zone, I will be looking for bearish reversal setups (like a double top pattern, trendline break , and so on...)
📚 Always follow your trading plan regarding entry, risk management, and trade management.
Good luck!
All Strategies Are Good; If Managed Properly!
~Rich

GOLD Short From Falling Resistance! Sell!
Hello,Traders!
GOLD was going up
Lately and it is locally
Overbought so as the price
Is retesting the falling
Resistance line I think that
We will see a bearish reaction
And a local move down
Sell!
Like, comment and subscribe to help us grow!
Check out other forecasts below too!

✅DXY MOVE DOWN AHEAD|SHORT🔥
✅DXY has been growing recently
And the index seems locally overbought
So as the price has retested the horizontal resistance of 104.665
Price fall is to be expected
SHORT🔥
✅Like and subscribe to never miss a new idea!✅

USD-CAD Swing Short! Sell!
Hello,Traders!
USD-CAD was trading in
A strong uptrend but now
The pair has hit a horizontal
Resistance level of 1.3653
From where I will be expecting
A bearish correction
Sell!
Like, comment and subscribe to help us grow!
Check out other forecasts below too!

✅SILVER SWING SHORT🔥
✅SILVER keeps rising and
The price grew by almost
10% from the recent lows
So Silver looks overbought
Thus after it hits a horizontal
Resistance around 24.5$
We are likely to see a
Bearish reaction and
A local price drop
SHORT🔥
✅Like and subscribe to never miss a new idea!✅

✅GBP_CAD SWING SHORT🔥
✅GBP_CAD is trading in an
Uptrend but the pair will soon
Hit a massive horizontal resistance
Of 1.7358 from where I think
We will see a bearish correction
SHORT🔥
✅Like and subscribe to never miss a new idea!✅


SPY- Bearish- UpdatePosting a quick update here on the SPY as a lot has transpired in financial markets over the past few months. The SPY has been driven by buyer volume and momentum. Prime examples include but aren't limited to, NVDA-reported earnings, following the existing hype surrounding the AI Sector, which for lack of better words, has created a bubble in itself by only furthering the existing momentum. Simultaneously, while 5 stocks carry the S&P, smaller-cap names have been trading sideways or have been getting crushed amid all of the intraday volatility, creating the market that we're currently in; over-extended, with no fundamental rationale to support it considering the state of the economy. Where I stand, we're in unchartered territory. Interest rates already being very high, the 30-year hitting 7% last week, a strong job market, and the NAIRU remaining above 4% along with the NROU at 4.22% and the NAIRU being.
SPY-Weekly
On a technical note, pictured on the chart are two massive bearish megaphones, one drawn in red, and the other blue. The RSI on the SPY is bordering on overbought territory, the VIXY is looking very bullish, holding a large falling wedge, with momentum increasing as the Heiken Ashi Candles indicate. With the USD sliding and geo-political turmoil rising, the markets are in unchartered territory. Treading lightly here, again, some RSI-based supply and demand zones to keep an eye on in the interim along with key support and resistance levels in white, bearish short-term & eyeing long-term holds to scale into.
VIXY - Daily
--Previous Charts Attached Below--

NATGAS Local Short From Resistance! Sell!
Hello,Traders!
NATGAS shot upwards but
Has hit a horizontal resistance
Level of 3.017$ from where
I think we will see a local
Bearish correction
Sell!
Like, comment and subscribe to help us grow!
Check out other forecasts below too!
