OKTA: Oversold?OKTA
Short Term - We look to Buy at 73.79 (stop at 59.02)
The medium term bias remains bearish. Trading close to the psychological 72.00 level. Support could prove difficult to breakdown. A higher correction is expected. We therefore, prefer to fade into the dip with a tight stop in anticipation of a move back higher.
Our profit targets will be 109.67 and 120.00
Resistance: 110.00 / 139.00 / 200.00
Support: 72.00 / 50.00 / 30.00
Please be advised that the information presented on TradingView is provided to Vantage (‘Vantage Global Limited’, ‘we’) by a third-party provider (‘Signal Centre’) . Please be reminded that you are solely responsible for the trading decisions on your account. There is a very high degree of risk involved in trading. Any information and/or content is intended entirely for research, educational and informational purposes only and does not constitute investment or consultation advice or investment strategy. The information is not tailored to the investment needs of any specific person and therefore does not involve a consideration of any of the investment objectives, financial situation or needs of any viewer that may receive it. Kindly also note that past performance is not a reliable indicator of future results. Actual results may differ materially from those anticipated in forward-looking or past performance statements. We assume no liability as to the accuracy or completeness of any of the information and/or content provided herein and the Company cannot be held responsible for any omission, mistake nor for any loss or damage including without limitation to any loss of profit which may arise from reliance on any information supplied by Signal Centre.
Oversold

PLAB stick at bottom of a horizontal channelwith earningss in one more trading day.
MACD is in oversold territory while the RSI is showing
relative weakness. I will watch this the day before
earnings, Any accumulation or a volume surge will
be my entry signal to buy the earnings play.

Overbought EntryProfit taken at anticipated level. Happy for todays trade. I moved stop loss above entry and whatever happened I'm still in profit.

Is NVAX oversold following its earnings miss?A few days ago, NVAX gapped down 30 percent on a large earnings miss. This means that now NVAX is down over 87% from its ATH.
Why I think NVAX is a buy right now
The stock had a minor rally off a long term support level extending to 2020, and has higher lows than during the previous rally off this support level. It is trading at a heavily discounted price/sales of 2.55, far below its peak p/s at 249.16. There is a large upside, with the nearest strong resistance level roughly 50% above the current price.
I'm buying in at around 42.2 with a high risk reward ratio. I'll be targeting a roughly 20% return with a 5% stop.

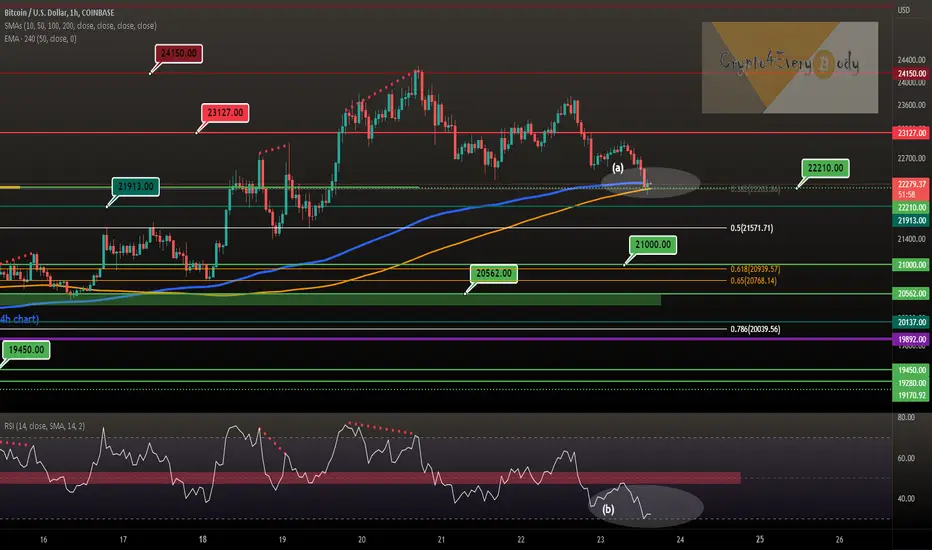
Bitcoin short-term view - oversold but second leg possibleBitcoin short-term view - oversold but second leg possible
(a) BTC currently at $23.056 - $23.115 (FIB golden pocket) - RSI oversold
(b) a second leg down to FIB 78.6% at $22.807 possible
Maybe we see a bullish divergence from there and some recovery dear Crypto Nation
*not financial advice
do your own research before investing

RSI Overbought & Oversold Strategy
What Is the Relative Strength Index (RSI)?
1. The relative strength index (RSI) is a popular momentum oscillator introduced in 1978.
2. The RSI is displayed as an oscillator (a line graph) on a scale of zero to 100.
3. An asset is usually considered overbought when the RSI is above 70 and oversold when it is below 30.
4. The RSI line crossing below the overbought line or above the oversold line is often seen by traders as a signal to buy or sell.
5. The RSI works best in trading ranges rather than trending markets.

$GRAB - Buy with upside of +50% to +90% Technical Analysis
Oversold with weekly William %R and RSI starting to show reversal signs.
Daily RSI crossing above 50 and looking ready to curl upwards.
Price consolidating between $2.60 - $3
Broke out of the wedge.
Price Target
Buy between $2.60 -$3.00 or above $3 for confirmed breakout.
Analyst Price target: $4.6 (
Fib Level Price Target of $5.70 (upside of +90%)

$SXTC - Reversal swing with +50% upsideTechnical Analysis (TA)
Weekly oversold and needs a break above -20 William %R to start a potential mean reversion play to $3.50
Lacks a catalyst so it will be worth waiting until the end of this week to see how price responds to the 1D 50EMA level.
Price Target
Entry: $2.15
Target 1: $3.38

$ATLY - Oversold with +40% upside potentialTechnical Analysis ( TA)
Weekly William and RSI look very oversold so I am expecting a mean reversion to at least 0.20
Daily chart is showing initial signs of the mean reversion/reversal but its not let confirmed on the reversal until we cross the 50EMA.
Price Target
Entry: 0.175 - 20.5
Target 1: 0.25 (+40%)
Fundamental Analysis (FA)
Financial Metrics look good.

$MSFT - Weekly support and continuationTechnical Analysis (TA)
Monthly oversold and Williams %R showing signs of a reversal.
Weekly MA's resistantce broken and held key 100MA as support. Needs to break Monthly 10EMA to show upside momentum.
Price Target
Entry : $281
Price Target 1: $315
Price target 2: $350
Fundamental Analysis (FA)
Strong Quality Screen and metrics.

EURCAD OVERSOLD - BUYThe pair has dropped significantly in the past few months and is oversold on the daily and weekly timeframe.
In addition to that,the price has closed above the support level twice now and has formed a double bottom pattern with bullish divergence on the daily timeframe.
This is a clear indication of a bullish retracement in the coming weeks.
Initial targets are :
1.3300
1.3450
1.3714
Look for entries on lower timeframes with proper risk management.

FILUSDT - Oversold (Weekly chart!)I will keep this brief:
1) Price has dropped over 98% (!) from ATH
2) RSI is as oversold levels, descending wedge forming
3) The falling wedge drawn
4) It has printed red candles for a consecutive 10 weeks. How much more can it drop?
5D BTC pair chart looking nice too
Can the price drop more? Sure. But after a 98% correction? I am willing to say chances are in favor of upside.
TImeframe: Weeks
Return: Don't know
Leverage: 2-3x if you need to use

GOLD Breakout Long! Buy!
Hello,Traders!
GOLD was trading in a loose falling bullish flag
Then the price broke out to the upside
Which together with the fact that gold was oversold
Makes us locally bullish biased
So we will be expecting a move up after the
Retest of the broken level
Buy!
Like, comment and subscribe to boost your trading!
See other ideas below too!

#Bitcoin short-term view - #BTC at SMA and EMA supportBitcoin short-term view - BTC at SMA and EMA support
(a) price at SMA200 and EMA50 (4h chart) that should give BTC some support
(b) RSI oversold since some July 13th
A second leg down possible - maybe with a bullish divergence dear Crypto Nation
*not financial advice
do your own research before investing
Larsen & toubro infotech ( can break either)1 week frame shows it has reached the support level and near to the oversold zone. Just for information purpose

PTON:Due for some bullish relief!Peloton
Short Term - We look to Buy at 8.66 (stop at 7.14)
We are trading at oversold extremes. Due to an Ending Wedge formation, we continue to treat extended losses with caution. Dip buying offers good risk/reward. Although the anticipated move higher is corrective, it does offer ample risk/reward today.
Our profit targets will be 12.95 and 15.00
Resistance: 13.00 / 15.00 / 20.00
Support: 8.50 / 5.00 / 2.00
Please be advised that the information presented on TradingView is provided to Vantage (‘Vantage Global Limited’, ‘we’) by a third-party provider (‘Signal Centre’). Please be reminded that you are solely responsible for the trading decisions on your account. There is a very high degree of risk involved in trading. Any information and/or content is intended entirely for research, educational and informational purposes only and does not constitute investment or consultation advice or investment strategy. The information is not tailored to the investment needs of any specific person and therefore does not involve a consideration of any of the investment objectives, financial situation or needs of any viewer that may receive it. Kindly also note that past performance is not a reliable indicator of future results. Actual results may differ materially from those anticipated in forward-looking or past performance statements. We assume no liability as to the accuracy or completeness of any of the information and/or content provided herein and the Company cannot be held responsible for any omission, mistake nor for any loss or damage including without limitation to any loss of profit which may arise from reliance on any information supplied by Signal Centre.

NI technical overviewNI has currently a pretty nice position from the technical point of view. The market conditions are oversold and an entry can be considered.
Target is $32.50 and probably a break at $33 if we are patient!

EURGBP: Who from the weak?!EURGBP
Intraday - We look to Buy at 0.8425 (stop at 0.8395)
Although the bears are in control, the stalling negative momentum indicates a turnaround is possible. We are trading at oversold extremes. A higher correction is expected. We look to buy dips. Although the anticipated move higher is corrective, it does offer ample risk/reward today.
Our profit targets will be 0.8515 and 0.8600
Resistance: 0.8460 / 0.8600 / 0.8720
Support: 0.8400 / 0.8325 / 0.8200
Please be advised that the information presented on TradingView is provided to Vantage (‘Vantage Global Limited’, ‘we’) by a third-party provider (‘Signal Centre’) . Please be reminded that you are solely responsible for the trading decisions on your account. There is a very high degree of risk involved in trading. Any information and/or content is intended entirely for research, educational and informational purposes only and does not constitute investment or consultation advice or investment strategy. The information is not tailored to the investment needs of any specific person and therefore does not involve a consideration of any of the investment objectives, financial situation or needs of any viewer that may receive it. Kindly also note that past performance is not a reliable indicator of future results. Actual results may differ materially from those anticipated in forward-looking or past performance statements. We assume no liability as to the accuracy or completeness of any of the information and/or content provided herein and the Company cannot be held responsible for any omission, mistake nor for any loss or damage including without limitation to any loss of profit which may arise from reliance on any information supplied by Signal Centre.

Bottom Still Not InOversold it is, higher it must climb, until lower it gets again. Bounce coming- likely. Bull run again- unlikely imo.
Every bottom lifts VIX to >40 and true capitulation usually triggers trading halts. Didn't see these yet; not done.
Bear markets are not quickie corrections that serve as dips to buy. They grind on for months or years, median 17 months.
Don't expect any monster rallies although a summer rally is likely before the real bear growls in September.

Bullish Shark Potentially Targetting 38k-48k on the WeeklyWe may see a spike down during the weekend but despite that we do have an oversold condition while BTC sits at the 1.13/1.618 Pattern Completion Zone of a Bullish Shark Visible on the Weekly and if it plays out we could see it rally up between a 0.382 at the least and a 0.55-0.618 Fibonacci Retracement if the pivot is strong.
If BTC wicks down during the weekend and triggers my stop but comes back up to the original entry zone then i will reenter though preferably BTC will just go up from here without any stop hunting.

NKN Buying indicator gave PERFECT buying momentBuy nkn now , very oversold. Do your own research. Dont trade based on my ideas. Goodluck!

XCHUSDT - 10x opportunityOn the weekly chart above:
1) RSI has been heavily oversold for quite some time.
2) Bullish divergence as drawn, RSI forming descending wedge.
3) Price has declined over 90% from ATH.
Also the 3D BTC pair below breaks out of resistance quite decisively and prints a bullish engulfing candle (Also BE candle printed on 1W BTC pair. Wow!)
Initial targets 41-54 USDT (1.5-1.95x) as marked by fib retracement
Timeframe: Weeks
Leverage: 3x at most for me (although with these signals printing the probability of more downside is very slim)
Hasta luego

How to catch a falling knife?!!!We are oversold on the indices and will be looking for a bounce...dnt know if its just temporary relief or the bottom....I dnt care actually I will just carve up my piece of the meat:)... buy stop at 6475. . . . .(already pocketed gains from the short see attachment)
