BTC to 29K !!!!Hi everyone!
Daily 4H 1H
As previously said on my previous post mentioned that BTC had a chance to test 45K. But unfortunately the current circumstances across all markets are NOT looking good all this as been referred to the current situation with Russia and Ukraine.
But NOT everything is bad as good outcomes come from Red markets: We can accumulate Long term potential coins with solid projects. Forget meme coins and focus on solid structured projects, much suggestion is to stay away from Scalping unless you know what you are doing.
I mentioned that "If failing to hold above this level and( a) daily candle closes below $40.8K (White broken line)Would mean that the Price Channel is broken BTC cloud drop to $35k or even lower." My $34.5k New trend line in blue has touched for the second time and is playing a key support If failing to hold we can see it going down to $29K.
ALWAYS look for extra confirmation before making any trade.
Happy trading people
(No financial advice)
DISCLAIMER
The trading ideas, analysis, and comments above should not be considered financial advice or recommendation to trade or invest in any financial product. Your personal situation has not been taken into consideration in the trade ideas. This page is for general educational purposes only. Do not buy or sell any product discusses on this page before doing your own research DYOR. Always do your own analysis and research and be aware of the risks involved in trading any financial product :)
Oversold

Bitcoin: Building support at 43,600 necessary for attacking 45kWith simplicity on the chart, it looks a lot like Bitcoin is building a necessary support at ~43,600 which is necessary for the major attack to finally conquer ~45,000
If the past 2 weeks we haven't seen much clarity on the charts, unsure were all of this is going, we now finally start to get a sense of the general direction.
It is most likely we have already seen the bottom. Most of us can agree that we are massively oversold, and it is more likely we will go up than more down.
45,000 is the nemesis. Conquering this price level is most probably the final milestone before entering ~50,000

UPST - Bearflag BUT showing signs of bottomRallied 50% from the recent low...and pulled back from the supply.
Bearflag should have pushed price further down today, but it recovered well.
Price action is not all that bearish right now, so bears need to be careful if THIS can manage to stay above 91..
Targets, below 91, 75 (double bottom?), 54
Above 91: 105, 128, 154

Looks bullish to meStock is very oversold on the rsi. We retraced to fib level. I'm tempted to sell some puts on this stock.

DKNG UpsideAs you can see from the chart DKNG bounced at a strong support area that was established back in Feb 2020 - April 2020. We can see that shortly after this bounce occurred there is a strong indication of a bullish macd crossover in unison with RSI moving out of oversold territory. On the 1 day chart we can see that DKNG is now in an ascending price channel and I expect some decent upside over the next month or 2.

FB looks good on the monthlyHello Friends!
I think this selling might be coming to an end soon. I’m looking to add at the $217 - $207 zone. This would be a long hold for me.
As always thanks for your follows, likes, and comments. Let’s learn and grow together. Cheers!

VRM setupHello Friends!
VRM has been on a downtrend for a while. Now it’s oversold on the daily, weekly, and monthly. It’s been consolidating in the $7 to $8 zone. A move past $8.18 with volume might setup a nice move to $9.77 and then $11.64.
Be careful with this trade, especially when their earnings is around the corner (Feb. 28).
As always thanks for your follows, likes, and comments. Let’s learn and grow together. Cheers!

MULTIPLE TIMEFRAME ANALYSISHaving Received countless of Approach on How I look at the Market to gain the Right Directional Bias, here I laid it out bear for your digestion.
I will like to say thank you for reading all my previous post and do not hesitate to comment or ask question.
TOP DOWN ANALYSIS APPROACH
This makes it easier to know which Direction you want to plan your trade in alignment to the HIGHER TIME FRAME.
I hope this will help your ongoing trader development and takes out those confusion when it comes to organising your bias,when to trade and when to be patient and when to start looking for opportunities on lower timeframe to then reduce your risk and keep you focus.
I will start from the Monthly Chart on ONEUSD a cryptocurrency called HARMONY that I believe will 10X it’s current price as we progress in Blockchain takeover
MONTHLY CHART
Monthly TimeFrame Blue 12EMA
A Support that act like a trendline
WEEKLY CHART
Same like Monthly 12EMA
But here Orange 36EMA on Weekly:A
Retracement level to consider adding new
Position in the Direction of the HTF
We saw a slowing week on the last red
That leads to the last week bounce
DAILY CHART
36EMA rejection Bounce on DAILY
Cautious area to take profit
Look for Rejection
Look to BUY Cheaper on OTF
8 HOURLY CHART
36EMA on 8HR with a Candlestick or
PRICE ACTION to look for the Discounted
LONGS and 2 good Confluences
Candlesticks HAMMER Price Action +
36EMA bounce
In Between the 200EMA
633EMA is a VOLATILITY GAP
This is where I observably expect
price to bounce Couple times in
betweenbefore we can make a directional
headway.
A VOLATILE REGION You can identify
in any market as price proceeds. So this gives you
a readiness awareness of what to expect and
for how long. 8HOURS represent a whole trading
SESSION
6HOUR CHART
Higher High 200EMA Selloff
on 6hr Corresponds the36EMA
on DAILY
BULLISH ENGULFING on 6hr 36EMA
after a potential longer term 8hr
(All Asian Session) Price Bounce
And maintaining of Higher Low
Price Structure
4HOUR CHART
Short Term Break of Structure (BOS) on 4hr
Chart is a good caution to let us know that
price won't just rise so easily higher
2 HOUR CHART
For Price to Change Direction
We have seen 1st 2hrs of hitting
200EMA rejection
Another 2hours of Price Slowing
without making a new low follow by 2hrs
of another Price Slowing after a Preceding
Downward Selloff Spiral
A clear indication of good 6hrs of consolidation
That eventually break out higher.Now we have
a good reason to look for BUY OPPS on
Smaller TF
The lower timeframe analysis will follow on hourly to minute charts.

IDEA - My Trading Plan in 2 mins!Hello everyone, if you like the idea, do not forget to support with a like and follow.
Here is the top-down analysis for IDEA, feel free to request any pair/instrument or ask any questions in the comment section below.
Best of luck!

NZD/USD OVERSOLD - potential reversal zoneHello Traders
Here is a new BUY Scenario, nzd is quite oversold but usd is still strong
i expect a retracement or reversal around this area 65.700 - 65.800
In this area there is a strong support, but another analysis will come later if necessary
✅ NZD/USD BUY @0.65700 - 0.65800
TP1 @0.65900
TP2 @0.66100
TP3 @0.66300
SL @0.65000
JamdeJam will not accept any liability for loss or damage as a result of
reliance on the information contained within this channel including

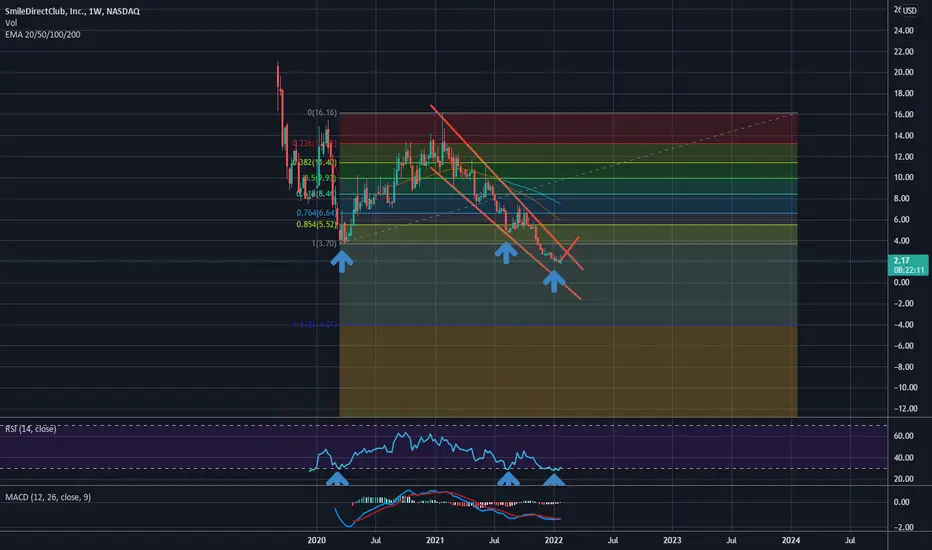
Way oversoldI believe this should squeeze to 4 area. Because it's way oversold at this point. We might even break the channel and make a new one. Because if it keeps dropping like this it will be bankrupt in not even few months. Which seems unlikely to me.
We are in for a short term bounce but still in bear marketThe rsi is very oversold. We should be in for a short bounce but it might not be meaningful in this weak tech market. However it's probably not a bad area here to start averaging down.

$PLTR Trade-Setup LONGI rally like Palantir at this spot, backtest of the pattern completion zone of the harmonic in the 4h chart.
Daily chart RSI is at 16, poised for some kind of bounce.
Buy in, TP's and Stopp Loss as in the chart.
Good luck out there!
Like, Comment and subscribe pls! :)

Symmetrical Triangle - UpdateHD catching my eye here after it bounced off the long-term uptrend it has been holding- Currently sitting right on its 200-day EMA, seemingly looking to reclaim and close above the .786 FIB level, MACD cross on the 4-hour, forming a big symmetrical triangle while also starting to break out of a falling wedge on the hourly timeframe. Additionally, HD formed a massive bullish shark harmonic pattern- Personally am bullish and will be looking for a breakout here (Broader Market Conditions Permitting) Just some FIB levels & RSI-based supply and demand zones to keep an eye on in the meantime - Previous charts are attached below
- Bullish Shark Harmonic Pattern
- MACD Golden Cross on the 4-Hour Timeframe (Not Pictured)
- Breaking out of a falling wedge on the hourly timeframe (Not Pictured)
- Sitting on the 200-day EMA as well as the .786 FIB level
- RSI starting to get out of oversold territory with buyer volume picking up
PT1- $360.68
PT2- $361.17
PT3- $362.12
PT4- $354.20
--Previously Charted--

Bullish Crab Looking For Bids to the UpsideWe have a double bottom here at the pcz after reaching oversold multiple times this my be the indication of a temporary bottom.

Amazon and my shopping basketDisney, T Mobile, Amazon, Charter Communications, Netflix.
What do all of these companies have in common?
1) They are all >$100B market cap.
2) They all have >10B Gross Profits.
3) They are all at 52 Week Lows.
4) They're all on my shopping list.
Amazon just had it's worst week since 2018 after underperforming the S+P in 2021, but this behemoth isn't going anywhere. I don't need to tell you about the value of it's core ecommerce business that we all use, or the AWS that runs a huge chunk of the internet, the 2nd largest hosting provider with their cloud hosting servicing 42% of the top 10k websites by traffic (Source: BuiltWith), or the success of Prime through logistical brilliance, a successful streaming platform and acquisition of Wholefoods to make the most convenient home shopping platform in the world.
I don't have to tell you about the 31 acquisitions Amazon has made since 2017, 15 of those since 2019.
I don't have to tell you that Amazon is an incredible company that still has a long runway of success and innovation ahead in a growing number of sectors (drones? Yes please!)
That's why Amazon is one of my top choices for investment in 2022.
The business circumstances for each company deserve separate posts in their own right, but to put it simply these companies are the cream of the crop in their industries and we currently have a fire sale.
When the market dips, it's the perfect time to go shopping, and each of these companies deserve serious consideration in your portfolio. Do your own research and make your decisions, but when it comes time to go bargain hunting why not start with the best in class?
A few more stocks I'm looking at meet that >$100B market cap, >$10B gross profits, industry leaders but that are at 6 Month Lows include:
Estee Lauder
Target
Oracle
Blackrock
Salesforce
Alphabet (GOOG)
We can see where the market takes us this week, but I can say with certainty I'll be a buyer on a number of these names this week.

Falling Wedge- Bullish (Long) - UpdateBeen a while since I've posted an update on ETH, starting to catch my eye here as it continues to sell off for potential long entries. ETH is holding quite a large falling wedge here on the daily timeframe but also is testing a long-term uptrend line. ETH is also seeming to be following an ABCDE Elliot wave so will be looking for a potential bounce or breakout after completion. (correctional wave, however, if at the end of the E wave there is no demand on the buy side, there will be no breakout).
Lastly, something certainly worth noting and keeping an eye on the weekly timeframe- a bearish bat harmonic pattern is formed and currently playing out (See Attached Chart Below). Just some support and resistance levels to watch along with some RSI based supply and demand zones to keep an eye on in the meantime- Bearish in the short-term but bullish in the long-term so will be watching closely for potential long entries, all previous charts are attached below
- Falling wedge on the daily timeframe
- RSI in oversold territory on the daily timeframe
- ABCDE Elliot Correctional Wave playing out
- Bearish bat harmonic pattern on the weekly timeframe (See Attached Chart Below)
- Declining volume on the weekly timeframe (See Attached Chart Below)
--Weekly Timeframe--
--Previously Charted--

$SPY oversold?? $SPY broke the previous support of 457 approaching below 430. in all time frame SPY is really bearish. but the RSI on 1hr and 4hr chart shows that its oversold.
oversold level doesn't mean it will bounce there. But the probability of short bounce is there. overall it seems the market is trying to deplete itself at the moment.
most of the stocks that is rallying from this market are the retailers and energy. basically there is probability that the market is going in cyclical rotation but I could be wrong..
Day trade or scalp target play: 01/24/22
Buy call above 444.44 sell at 450.93
Buy puts below 434.60 sell at 431.22
Hello everyone,
welcome to this free technical analysis . ( mostly momentum play )
I am going to explain where I think this stock is going to go over the next day or week play and where I would look for trading opportunities
for day trades or scalp play.
If you have any questions or suggestions which stock I should analyze, please leave a comment below.
If you enjoyed this analysis, I would definitely appreciate it, if you smash that LIKE button and maybe consider following my channel.
Thank you for stopping by and stay tune for more.
My technical analysis is not to be regarded as investment advice. but for general informational proposes only.

GBP/USD Bearish Scenario expected - oversoldHello Traders
Here is a new SELL Scenario, oversold signals coming from the RSI and the Stochastics.
💹GBPUSD SELL STOP
✅ Entry @1.37200 or below
✅TP-1# 1.37000
✅TP-2# 1.36800
✅TP-3# 1.36600
✅SL# 1.37600
JamdeJam will not accept any liability for loss or damage as a result of
reliance on the information contained within this channel including
data, quotes, charts and buy/sell signals

BNB (Updates)BNB is going down too, continuing deeper with the bull flag pattern on the hourly. 417.5 we might get a bounce off from there. Bearish cross on the macd, rsi reaching oversold. Drag down by BTC.
BNB 1H

Playing Sofi long here! Picked up a nice size position based on December 28,2020 candle wick high of $13.04. I've got another buy set for December 22,2020 high of $12.14. Doesn't look like it will get there, but I'm prepared.
Now I'm looking for a move to $13.93 this week and then $17.15 this month.
I like the fundamentals of sofi. With higher interest rates, pending bank charter approval, year over year growth, and super bowl LVI this year; it has potential.
Long on Sofi and the new developing neobank eco system.

Correction , Wedge-pattern , Possible Bullish reversal trendHello Traders !
I hope your doing well :)
- Please push the like button if you like the content or drop a comment to share your idea!
- On Weekly chart we can that ALGO is trading in ascending channel making higher highs and higher lows , if we zoom in to catch more data we can see that on our 1 daily time frame chart ALGOUSDT is currently trading inside an falling wedge pattern after the big impulse we had on 8 September 2021 , since then correction started.
-Based on the favorable scenario buyers will try to maintain level of support 0.9$-1.0$ ( strong demand area ) which is confirmed back on September 2021 where we had our RBR ( Rally , Base , Rally ) indicating that this an important level for buyers to push price higher.
-Until now Price action is performing inside this wedge pattern making lowers lows and lower highs waiting for the scenario to be achieved, otherwise we can fall towards level of support of 0.75$ which i doubt.
-We need to see the buyers taking price higher soon starting from our demand zone and reclaiming the last low swing and initiate the breakout to validate our scenario.
Good Luck Traders!

Shiba Inu is it ready for another zero down?Hello Traders,
Just wanted to make a few points here and talk about my plan for shib. As you can see Shib has been forming a descending channel for 3 full months. Which recently on the last pullback within the channel the RSI reached oversold territory. Previously back in September of 2021 the RSI also hit this same area and this indicated it had bottomed. I am looking to see if it does the same this time. You can also see some bullish divergence on the MACD.
Yet, if we do see one more pullback from this area I would think the RSI would be diverged as the price action hits the bottom of the channel in the demand zone as well as the area where the trend line having a nice confluence of areas to buy, then I would enter my trade there and place my stop loss directly under this area as you can see on the chart.
Have a green week and I will see you in the next analysis!
Savvy
