Bullish Gartley PCZ Entry Reached; RSI OverSOLd.We finally had a huge sell down into the PCZ entry of this Gartley with lots of volume behind it; lets see if we can get a bounce and start going up from here again.
Oversold

Citigroup $C is cheap and oversoldBanks are still very cheap, $C trades at 6 PE with a 3.14% dividend yield and technically speaking its stock price is now at the lower part of its trading range for most of this year. Both the Range Strength and Hurst Exponent indicate the price is in a non-trending ranging mode, the RSI is at 22 and price is 8.38% below it's 50 day MA which is a lot for a mega cap like Citi, here looks like a good long play back to the 50 day MA.

Falling Wedge - Gap Fill- BullishUPST starting to look really interesting after seemingly finding a bottom after selling off post-earnings leaving a big gap to fill on the upside. Big falling wedge on the 4-hour timeframe along with a bullish cypher, RSI is also way in oversold territory. Bollinger bands are squeezing on shorter timeframes and buyer volume picking up. Bullish will be looking for a breakout from this wedge & for UPST to go for the gap fill on the upside (Broader Market Conditions Permitting)- Just some support and resistance levels to keep an eye on along with some RSI-based supply and demand zones in the meantime
- Falling Wedge
- Gap on the Upside to Fill
- RSI Oversold
- MACD Cross
- Bullish Cypher Formed
- Bollinger Bands Squeezing on the Hourly Timeframe
PT1- $220.25
PT2- $225.94
PT3- $228.04
PT4- $256.38 + Gap Fill

$BTCUSDT #Bitcoin$BTC bitcoin 4 hr bullish divergence likely to be played out ..More likely thr bottom is in or very close to the bottom looking for reversal

Intra-Wave Bitcoin TrendsBy taking a trend line from the beginning (20th July) of the current wave up along the previous correction low (21st September), we can visualize a trailing price of support.
Bitcoin is trading in a falling wedge, while the MACD approaches a crossover. If there is sufficient momentum to push the MACD above 0 following a cross-over (price action to the upside occurs), a more prolonged move to the upside may be expected.
The MACD is looking very similar to the beginning of the last wave up.
Lastly, the stochastic RSI informs us that the price is OVERSOLD, which holds great significance on the daily charts, and we may be approaching a state of being OVERBOUGHT in the very near-future .
The trend is your friend! Personally I think a 3 Trillion TOTAL CRYPTO Market CAP is realistic soon, so I can expect bitcoin to progress towards the $70,000 in the near future.
This is not financial advice.
Thanks!

$CRSP RSI Oversold; Expecting Bounce to $105Historically everytime RSI was this oversold, stock had a nice bounce/run ~ based on history expect a bounce to to $105 /// Additionally $75 seems like a strong support...I think bottom is in - I'm long Dec & Jan calls / not financial advice do your own research NASDAQ:CRSP

#EURUSD trying to test long term trendline looking for support!!Hi All, my main 3 take-outs from this analysis are the following:
1- EURUSD is approaching the support area of 1.11 (actually it would be between 1.10 and 1.11) which is historically relevant
2- The cross is also trying to test the descending red long term trendline, which was brocken in August 2020 with volumes
3- The RSI in the weekly chart is in oversold territory and everytime this happened in the past, the price rebounded strongly. We might be very close to this to happen
Not a financial advice, just personal opinion. Do your own due diligence and good luck!

WISH - Possible a rebounce today. 1H chart RSI oversoldHi All, my main 3 take-outs from this analysis are the following:
1- The hourly chart shows RSI in oversold territory with high chances of a rebounce
2- Price might be retesting the resistence at arund 4.60$ in the next days
3- Still valid the possibility of an upward breakout of the descending wedge shown in the daily chart
Not a financial advice, just personal opinion. Do your own due diligence and good luck!

NZDUSD: Ready for a pullback after the break.NZDUSD looks like it is ready to make a pullback towards 0.6965-70 area as it comes from an oversold technical picture. We will try small positions at current levels (0.6930-35) setting the stops below 0.6920 targeting 0.6960-65.

GBPUSD around support 1.3375/1.3360With an ABCD pattern and a 5-0 Harmonic pattern with their potential reversal zones at 1.3375/1.3360, a bullish push-up is expected. As a confirmation, the market is close to the lower volatility band and is diverging with the RSI in a sign of the exhaustion of the bearish momentum.

Too much noise in the lower timeframesPrice is moving sideways in the lower time frames. The higher time frames will keep saying it all.
Once i confirm Divergence in M15, i will send out the possible buy signal in my next post here.
I appreciate the love so many of you show towards this channel, and to as many that keeps supporting us, i say a big 'thank you' !.

Symmetrical Triangle - Gap FillKeeping a close eye on DIS here- Sold off after earnings leaving a big gap to fill on the upside. Holding a big symmetrical triangle on the daily timeframe along with a falling wedge on the 4-hour timeframe. With buyer volume should really pop- Will be looking for a breakout from this triangle (Broader Markets Permitting) - Just some support and resistance levels to keep an eye on in the meantime along with some RSI-based supply and demand zones - Bullish and looking for a breakout
- Symmetrical Triangle
- Falling Wedge on the 4-Hour Timeframe (See Attached Chart Below)
- RSI in oversold territory
- Slight bullish divergence on the RSI
- Big Gap Fill on the Upside
PT1- $158.76
PT2- $161.83
PT3- $163.67
PT4- $172.55 & Gap Filled
4-Hour Timeframe
Previously Charted

coal indiacoal india has formed a doji in 1hr candle today and the rsi is in over sold region better to buy at gap up
for swing only
buy-160.8-161.2
t1-170
t2-175
t3-184
stoploss-153

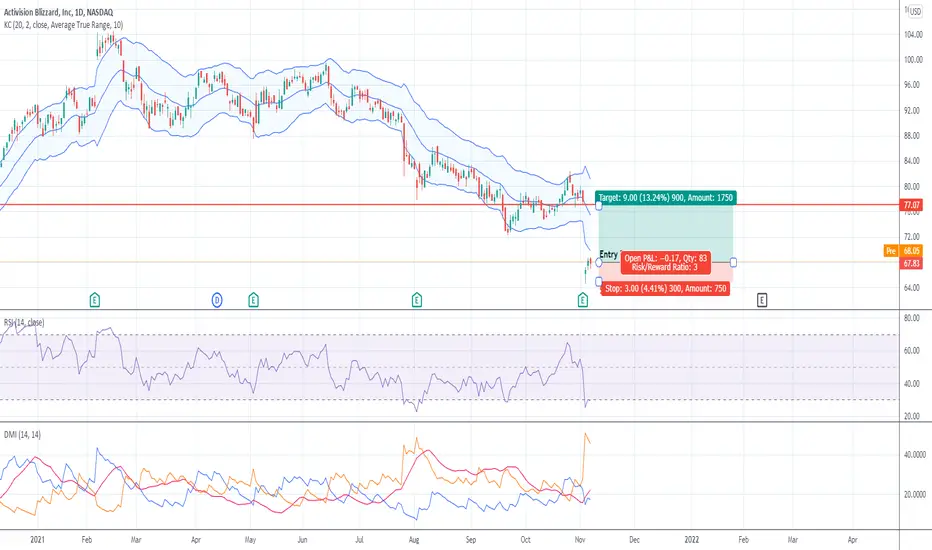
Activision Blizzard (ATVI) - longCompany Profile
Activision Blizzard is a company listed in the S&P 500 index and operating in the sector of Communication service, industry of Electronic gaming and Multimedia.
Signals
Position: Long
Target Price : $77
Entry Price: $68
Stop loss: $65
Indicators
MACD shows a strong bullish momentum
DMI shows the negative trend is not strong, ADX is at 22
The stock price is outside the lower band of the Keltner channel
RSI and STOCH are at overbought threshold
Analysis
The stock has experienced a dramatic gap three candlesticks ago, caused by the announcement of a delay in the game launches of 2022, that pushed the price below the lower bound of the Keltner channel. According to the RSI (30) and Stochastic indicator(20) the stock is oversold, so from these three indices we can expect the stock price to rise and reenter the Keltner channel to get closer to the moving average. If we design the most important simple moving averages we can observe that SMA 7<SMA 20 < SMA 50<SMA 100<SMA 200, meaning the stock is on a downtrend and so we discourage to take a position trade, but instead to keep the stock until the impulse phase makes it reach the previous support that could become resistance. From the DMI we can observe how the bearish momentum is becoming weaker (D- has negative slope) and the bullish momentum could start at any time, if the market recognizes the overreaction to the delay news.
No financial advice.
Falling Wedge- Bullish - UpdateCHPT still hovering right above oversold territory on the RSI, however, has been holding a massive falling wedge for quite some time now. By no means is this a short term play, regardless, will be looking for a breakout from this wedge- Just some FIB levels along with some RSI-based supply and demand zones to keep an eye on - Bullish long **(See Previous Charts Below)**
- Nearing the oversold range on the RSI (Slight bullish divergence on shorter timeframes)
- Bollinger bands squeezing
- Massive Falling Wedge
- Good long-term entries
PT1- $21.67
PT2- $24.09
PT3- $26.65
1-Hour Timeframe
Previous Charts-

ROBOTRADER ETH BUY OVERSOLD AT 3900, Last chance???Buy ETH as Wall Street is shorting the futures to scoop up physical off crypto exchanges. Investory is crashing, ETH will be $10K and people will wonder why...
Top next day opicks in order of preference:
ETH - oversold at support, accumulation by banksters who monkey with shorting futures to buy physical
BTC, anticipating break out back $59-65 violent, everyone eager to buy the dip. The Pullback was it. This is crypto, it's the value of the dollar that's crashing!
DOGE - Don't bet against Elon Musk. Takes 10% of SpaceX and backs DOGE with it. It could happen!
SHIB - Mega pump - you need 10% of this one but it;'s toppy here at 6000, of crypto turns bearish, SHIB Futures will pop up at the CME for a nice short session with the wolves.


USDJPY too overstretched! Correction Likely to Occur USDJPY is too overstretched or to put it in technical analysis term, its too oversold. Therefore an anticipated correction would likely occur. However as traders we perform technical analysis and await confirmation that a correction would likely take place.
Here we have a 4H chart of USDJPY. 115.000 represents a concrete monthly psychological resistance where the prices might likely reverse for time being. Also on the chart an ascending channel is visible and MONTHLY pivots. A confirmation which is needed here would be the following:
1) break of ascending channel
2) Close of 4H candle below the 4H 50 EMA
3) close of D candle below R2 monthly pivot
After all the above criteria have met, its important to know that the initial target would R1 MONTHLY PIVOT (112.500). However since this trade is on 4H timeframe, an extra caution is required which would be to notice where the weekly pivot pointS are located when the trade criteria has met. Combining all these, the risk to reward ratio evaluation is required and SHORT trade can be placed.
Note: This is just my personal technical analysis and its not a trade signal. The trade signal would be posted on an entirely different post shall the trade criteria meet.

MU - Bull flag⬆ BULL FLAG
Price $68.02 (AH 10.20.2021)
Target $77.57/ 84.92/ 96.82
Long term $116.08 (7 months)
Stop loss $65.67
IMO

Gap Fill- BullishWatching PINS closely here- Sold off after earnings, patiently waiting for a good entry- with a catalyst or an increase in buyer volume relative to seller volume should really pop- will be looking for a breakout broader market conditions permitting. Bullish, just some FIB levels along with some RSI-based supply and demand zones to keep an eye on.
- Big gap to fill on the upside
- Oversold on the RSI
- MACD is seemingly about to cross
PT1- $57.20
PT2- $58.85
PT3- $60.33+ Breakout

Bullish- Breakout Play (Long)Had my eye on PYPL for quite some time now, RSI is still hovering right above the oversold range on almost every timeframe after selling off after earnings. Will be looking for a breakout (broader market conditions permitting) Bullish - just some support and resistance levels to keep an eye on as well as some RSI based supply and demand zones to keep an eye on-
- Bullish ABCD Pattern Formed
- Falling Wedge (Bullish)- Within a Larger Ascending Triangle
- Sitting right on the 200-day EMA
- Slight bullish divergence on the RSI
PT1- $264.79
PT2- $269.18
PT3- $271.76
PT4- $274.08 + Breakout
(*Previously Charted*)

XAUUSD at a key level!Based on the chart, for XAUUSD, price reached a major support area and a rejection is about to happening but it's not completed yet!
So at this moment we can have to different scenarios that we are talking below:
----------------------------------------------------------------
1. Price rejection from the support level is completed and the price moves up
2. The rejection of price will fail and the major support area will break. Then we've to be ready to sell at the pullback.
----------------------------------------------------------------
So what do we think about the price movement right now?
Currently we have more bullish bias about the next movement of price. So let's check our reasons:
***************************************************
1. We are in bullish trend ( Bullish )
2. Price reached to the bottom of a bullish channel ( Bullish )
3. Price reached to a support area at the moment ( Bullish )
4. RSI(14) is in oversold area ( Bullish )
5. It has been a strong bearish movement which lead the price to the bottom of the channel ( Bearish )
***************************************************
So based on the following scenarios we can still have bullish bias otherwise the scenario changes.
However consider that these are different scenarios and we do not have enough proofs for buy or sell right now (That's why we set this analysis as Neutral )
But let us see what do you think about the next movement? up or down and why? please bring your reasons and feel free. Your idea is always valuable to us!
Good luck and thanks for supporting us!

Update - Falling WedgeJust posting a quick update as ROKU is still looking very interesting here- Double top played out as expected- will be watching closely for a breakout here (broader market conditions permitting). Just some support and resistance levels to watch along with some RSI based supply and demand zones to keep an eye on- Bullish
- Falling wedge ( bullish )
- RSI in oversold territory
- MACD cross looks to be imminent
- With buyer volume should really pop
PT1- $328.71
PT2- $330.58
PT3- $339.90 + Breakout
