BTC Finding Strength On Daily ---> Will We See Halving Pump?Been calling for double bottom to play out in Stochastic RSI on daily timeframe. We can see we've done just that and then some! MACD trend showing exhaustion as MACD Line tests major support. 0.5 Fib level acting as current support.
Expecting a large move to precede the halving in late May. Many alt coins will follow.
Worth noting the increasing noise about BTC & energy waste. This could be a pawn used against it in the future & or black swan event. Will never stop btc but can reduce its adoption by forcing the majority of the world to use another asset... one that works with the banks... which could only be... (insert your favorite coin here ;))
Not on any bandwagon in particular but if you've been in this space for a minute you know how exciting and euphoric thing can get. Opportunities are all around.
Oversold

FANG Stocks| Facebook Oversold Bounce| Fed Rate Cuts?Evening Traders!
Today’s technical update will be on Facebook with an oversold bounce coming to fruition, this is similar across the board due to the immense sell pressure.
Points to consider,
- Trend broke key 200 MA
- Local resistance being tested
- Local support at .50 Fibonacci
- RSI approaching yearly lows
- Stochastics in lower regions
- Bull Volume influx
Facebook broke its key 200 MA which plays a historical significance in determining a bear or bull trend. Currently the local resistance zone is being tested (market close) which is in confluence with the 200 MA. A close above will increase bullish bias. A rejection will technically put in a lower high, which is very bearish.
Local support is at the .50 Fibonacci, this can be considered to be the nest logical support if the bears continue to control price.
The RSI is trading at yearly lows; this level here technically indicates a short term bounce. Facebook’s stochastics is also trading in lower regions, can stay here for an extended period of time, however lots of stored momentum to the upside.
Upon market close, there has been a clear influx in bull volume, signalling potential seller exhaustion for the short term, it would only be natural to have a relief rally at some point.
Overall, in my opinion, Facebook and stocks across the board have a high degree of probability in having in oversold bounce. Oscillators are extended, local resistances needs to break otherwise lower highs will be set, which is extremely bearish.
Will Fed rate cuts save the economy again?
Please leave a like and comment,
And remember,
“The obvious rarely happens, the unexpected constantly occurs.” – Jesse Livermore

XRP Last Round In The Chamber Last fib level for reversal Stochastic RSI heavily oversold. Seeing a possible double bottom pattern playing out right now. Exciting times if you remember the days prior to last ATH when XRP teased us at this exact same price range. Interesting to say the least...
Not Financial Advice.

GBP/USD - ShortI am watching and will be taking a trade if we can pull back up and create a lower high as well as a touch of the trendline with the possible rejection of the 1.3000 resistance level.
We are in a strong Weekly uptrend but at the moment we are having a weak retracement. Looking on the Fibonacci from the low of 1.19566 to 1.35086 we have just tapped and rejected the 50% level, however, I do think we can come down to test the 61.8% level.

ETH- Pullback or march toward the NEXT MAJOR RESISTANCE LVLHello everyone!
BTC dominace lvl has gone down a little and, we start to see more trading volume flow into retail's favorite crypro exchange coinbase as its trading volume increased 50% recently.
Retail money is what makes the uptrend move sustainable!
VPVR looks bullish as the price pierced through VA and both long term and short-term POC with long term trend line acting a strong support below.
However, ETH is currently facing long term fib resistance (32.8) and previous support lvl .
Furthermore, many indicators indicate the overextended status ( bollinger & ichi) and oversold status hovering around 75-80 on both daily and weekly timeframe
In terms of magnitude, 8 straight weekly green candles is probably overheating.
Next major resistance lvl is around 360. Buy on the dip within the buyzone if the price pullbacks.
Please like and follow me if you find my analysis useful. Much appreciated!

OVERSOLDMy set of indicators flagging oversold, odds for bounce high. The oversold levels are always there when it feels like the world might blow up......the most beayifull flowers grown on the edfge of the cliff...

BUY HAS @ 98.8 take +16%, stop -3%Hasbro is a big toy company, one of the largest in the world. Today is New York Toy Fair (21.02.2020) this may impact positively 1st quater of 2020 for HAS.
The price on it's lows after weak earnings report, and it seems to me very pretty!
Buy @ 98.8
Take @ 115.0 (+16%)
Stop @ 95.0 (-3%)
Close stop, long run! It may take a few months to get to the take, be patient.
Low RSI. The stock price has crossed below the lower Bollinger Band, which gives us a buy signal.
Lower support line @ 96.7 (D).

ROKU all out dumpTicker: $ROKU
$ROKU dumped 20% in the last five trading days, all with a lower close than the day prior. Bears are in a great position especially with the help of the overall market weaknesss. A HUGE support ($116.26) is coming possibly on Monday, but definitely this upcoming week.
Break that level and short is going to run with it. If we down to the extremes with 4 hour RSI under 20, I will potentially start scouting for an oversold bounce. I will be extremely picky because of the general market weakness and will monitor the correlation closely.
Change the hourly trend with a higher low, and a high high; as well as break the pattern of the lower high every day pattern and that will be the first indication that a bounce will be playing out.

OXT New Coin Little Price History.. Future Giant?OXT with its little price history offers added risk but increased reward if things turn bullish. If RSI can break above oversold territory I would expect a move to retest resistance at he 50 day MA around 0.285. Volume looks ready for a large spike. At the time of this post OXT market cap is 17.5 million. Will follow up as trend progressed & at the end of the year to see where we are.

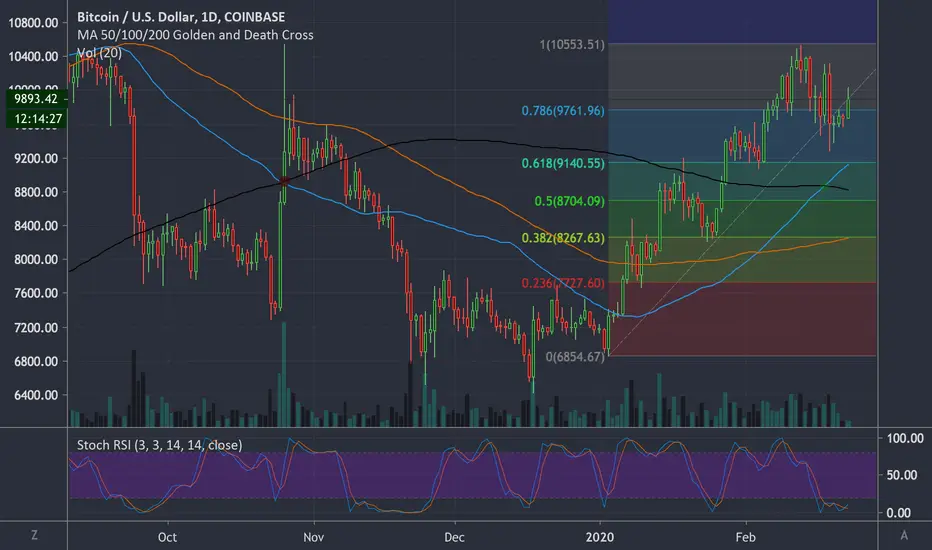
BTC Double Bottom In Oversold Daily RSI & Fibonacci Following up from my previous BTC post I was looking at the possibilities of daily RSI forming a double bottom while the weekly timeframe RSI "cooled off". Fib extension looking to provide support at the .786. If we can do that I would expect to retest the last high around $10.5k. Bearish scenario could take us back to the $9,200's. Really is just about finding the best time to buy right now. Hype fuse isn't even lit yet.. Your grandma will be shilling coinz in the next bull cycle... could be sooner than later.
Please Like & Comment ------> Lets Be Friends **even if we disagree**
HAVE A GREAT DAY. LIFE IS A GIFT.
Not Financial Advice.
TABBOO LOVE: I Like BTC & XRP ---> Idea Below
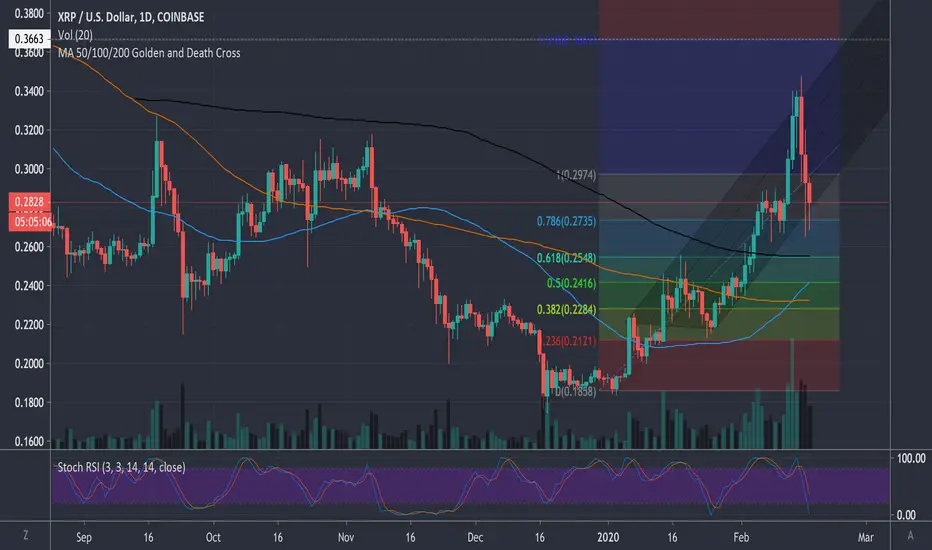
XRP Fib Redrawn With RSI Double Bottom & Golden Cross Near Have been watching a double bottom pattern forming on Stochastic RSI 1 Day timeframes across many major crypto with over bought condition on the weekly. The weekly charts are cooling off while a nice double bottom is forming in oversold conditions on the daily. BTC is a clear example (see idea below). I redrew the fib to the local trend and we are currently looking to retest the .618 resistance. Breaking above that would most likely give the moving averages the momentum to golden cross (blue 50 day over black 200). Declining volume so we could see a large spike to move the market in either direction. If a bearish shituation* plays out then I see strong support around 0.253-0.255 area. A break above the .618 would mean a retest of the resistance around 0.315.
Please Like & Comment ------> Lets Be Friends **even if we disagree**
HAVE A GREAT DAY. LIFE IS A GIFT.
Not Financial Advice.
BTC Double Bottom ---> Idea Below

EUR/USD LONG - 20. FEB. 2020Clear divergence on OBV with Stochastics oversold. Wait for the daily candle to close before entering this trade because the price can continue to go down. Use proper risk management!

ZEC Looking To Double Bottom In Oversold Territory On The Daily ZEC pulling back along with the rest of the market. It has golden crossed on the daily timeframe. Stochastic RSI is oversold. The weekly timeframe RSI is Overbought similar to BTC. ZEC currently attempting to find support on the 50 MA. Thinking we'll see the weekly RSI cool off resulting in the daily RSI turning south in the days ahead to make a double bottom formation. Price could retest the upper $40's potentially. I would suspect candle body to bottom around $55 but that is highly speculative. If you know anything about ZEC is this thing prints insane wicks all the time so watch out with your stop loss. At least consider that in your trading strategy this is a real easy one to get stopped out in rather frequently. Its worth noting that on January 14th or 15th ZEC saw what looks to be its highest amount of buy volume ever recorded. I am long term investor with bullish view overall. Think the charts are showing some bearish potential for the days ahead. Say what you will about Zcash but remember this one thing....
It was once listed for $2,200,000 each. Ridiculous as it may be it still is a fact. Calculate the risks you take.
Please Like & Comment ------> Lets Be Friends **even if we disagree**
HAVE A GREAT DAY. LIFE IS A GIFT.
Not Financial Advice.

BTC Golden Cross On The Daily Despite Recent Sell OffAfter a healthy uptrend BTC has met resistance on the major diagonal resistance line drawn from the 20k & 14k peaks. Despite a strong rejection we have still managed to get a Golden Cross on the daily chart . Stochastic RSI in oversold conditions. However, We are in overbought territory on the Weekly timeframe in Stochastic RSI . Looking at moving averages for support out fist one would be the 50 day around the $8,500 region. We need to breakout of the diagonal resistance before we can put our moon suits on. That time only grows closer each day. Could see a double bottom get printed in daily Stochastic RSI in oversold condition while the weekly cools off. There is definitely some downside potential for BTC and the market overall in the short term. If your focused on the macro picture you know where were going long term. Double digit blocks soon to be a thing of the past ---> for ever.
Please Like & Comment ------> Lets Be Friends **even if we disagree**
HAVE A GREAT DAY. LIFE IS A GIFT.
Not Financial Advice.

XRP Respecting Trend 1D TimeframeSince my last post XRP has rejected off the top of the pitchfork and fallen to the bottom of the pitchfork where it is attempting to find support. Stochastic RSI falling to oversold conditions. We are potentially refueling before another big leg up. 50 day moving average turning vertical looking for momentum to make it over the 200 day moving average.
If your minds on your money then strategically put your money in the markets ;)
Not Financial Advice.
EURCHF swingAnalysing the weekly chart on Eurchf, it has been in a bearish trend since April 2018. With uncertainty regarding brexit, euro has been declining for a long amount of period, where we can see that it has reached a peak, an oversold market. In the next few weeks, Euro is expected to gain strength through monetary policies and manufacturing Pmi.
Another POV, on the weekly chart, possible formation of head and shoulders or a breakthrough to create an uptrend, breaking 1.20033. Look for buys in current price.
Target is 429 pip. However tp3 covers 542 PIPS.

BTC.D Oversold Bounce? | Alt Coin Pull Back? Firstly Happy Valentine’s Day and welcome to another Crypto Update!
Today we will look into the BTC.D chart to identify where the greater market is headed. The BTC.D is likely to experience an oversold bounce which may lead to a probable pull back in the current ALT season.
Points to consider,
- BTC.D broke key support line
- All key moving averages broken
- Testing local support
- RSI in oversold conditions
- Stochastics trading in lower regions
- Volume spiking
The dominance showed a lot of weakness when the key trend line was broken, this initiated the overall Alt season. All key moving averages where broken at the same time, which puts more emphasis on the bearish projection.
Current support being tested is a critical area; a bounce here is probable to cool of all technical indicators.
Currently the RSI is in oversold conditions, historically this leads to an oversold bounce back into neutral territory. The stochastics is trading in the lower regions, can stay here for an extended period of time, however lots of stored momentum to the upside.
Volume is clearly spiking, confirming a true breakout of a key trade location. A break of this current support will continue with bear momentum.
Overall, in my opinion, a bounce is highly probable from such oversold conditions. The BTC.D is testing critical support, if this does not hold, then expect a prolonged Alt season.
What are your thoughts?
Please leave a like and comment,
And remember,
“In order to succeed, you first have to be willing to experience failure.”
― Yvan Byeajee,

EURNZD o/s levels all timeframeEURNZD oversold levels in all timeframe from 30 mins into higher Daily timeframes
Indicators & Oscillators are oversold waiting for reversal
Confirmation 30 pips move for long position
Bull flag pattern 30 min

Crude Oil OverSoldOil has gone through great lengths with bringing price down immensely. Price is showing either a reversal tone or the beginning of where price is looking to retrace. Through Historical Data, price that has converted from bearish to bullish, has reached our potential exit which is the Top Blue Line. Waiting for Proper Candlestick Confirmation for a Double Bottom to secure our reason to enter Bullish.

EURUSD : Which Cypher ? Hi.
At EURUSD, first the Bearish Cypher Pattern worked and we came down.
Now for the work of Bullish Cypher Pattern,
A closing on the Blue Trendline is required.
There is not much hint when we look at COT Net Positions :
Only 2% Position increase is observed on Autonomous LSTM Adaptive Period.
Let's follow the Blue trendline.
1W Chart Status :
And we are under the influence of Bearish Cypher whenever we cannot break this trend line.
It should not be forgotten.
Finally, if you think this analysis is useful to you,
press the LIKE button )
Regards.

EURJPY Long SetupHello, we have moved to some more oversold territories.
The Buy Signal has also observed.
The analysis currently includes a nice Risk / Reward Ratio.
And I think you can try.
But let's not get loaded because if we fail we have the opportunity to try again.
I think this analysis may have less risk in the following parameters:
Risk/Reward Ratio = 1/3
Position Size = %0.05
Stop-Loss : 119.669
Goal : 121.058
Don't forget to look Related Ideas to understand this analysis' Main Structure.
Regards.

Coffee has taken a dive, now looks ready to rally againPost the sugar-rush of speculative buyers, the commodity sold off heavily, gapping through a short term uptrend-line. Now the commodity, represented by the ETF JO, looks to be stabilizing at the 38.2% Fibonacci level from the Dec 13 high. Moreover, we see a cluster of moving averages, including the 200day Exponential Moving Average at this level. Given the current risk-on, and dollar-down environment, coffee should be supported moving forward. This sell-off is overdone, and other soft commods such as Cocoa and Sugar have performed splendidly in recent weeks. There is no reason for Coffee not to do the same. I am targeting new near term highs, and a 141% extension from the previous rally off the lows.

EUR/USD Daily - Possible Bullish ReversalTuesdays close on the 1D chart gave us a bullish hammer. Depending on the outcome of Wednesdays daily close we may have a sign for a bullish reversal.
RSI is sitting around 35 which may also give the indication the trend has tired out.
Strategy:
Wait for Wednesday close.
If we close above 1.1025 (the hammers high) then I will be looking for a long position.
If we close below 1.1000 the possibility of bearish continuation is in sight, then I will be opening a short position.
