GBPCAD Technical Analysis! SELL!
My dear subscribers,
GBPCAD looks like it will make a good move, and here are the details:
The market is trading on 1.8356 pivot level.
Bias - Bearish
Technical Indicators: Both Super Trend & Pivot HL indicate a highly probable Bearish continuation.
Target - 1.8184
About Used Indicators:
The average true range (ATR) plays an important role in 'Supertrend' as the indicator uses ATR to calculate its value. The ATR indicator signals the degree of price volatility.
Disclosure: I am part of Trade Nation's Influencer program and receive a monthly fee for using their TradingView charts in my analysis.
———————————
WISH YOU ALL LUCK
P-signal

LTO - Two Potential Longs!Hello TradingView Family / Fellow Traders. This is Richard, also known as theSignalyst.
📚 LTO has been rejecting a massive weekly support and the key $0.02 round number.
🛡️ As long as this level holds, I'm eyeing a potential 5x move towards the upper bound of the falling channel and the $0.10 round number.
🚀 From a macro perspective, a break above $0.10 could trigger a continuation towards $0.30 — unlocking major upside potential!
📚 Always follow your trading plan regarding entry, risk management, and trade management.
Good luck!
All Strategies Are Good; If Managed Properly!
~Rich

EURCAD The Target Is DOWN! SELL!
My dear followers,
I analysed this chart on EURCAD and concluded the following:
The market is trading on 1.5780 pivot level.
Bias - Bearish
Technical Indicators: Both Super Trend & Pivot HL indicate a highly probable Bearish continuation.
Target - 1.5647
Safe Stop Loss - 1.5857
About Used Indicators:
A super-trend indicator is plotted on either above or below the closing price to signal a buy or sell. The indicator changes color, based on whether or not you should be buying. If the super-trend indicator moves below the closing price, the indicator turns green, and it signals an entry point or points to buy.
Disclosure: I am part of Trade Nation's Influencer program and receive a monthly fee for using their TradingView charts in my analysis.
———————————
WISH YOU ALL LUCK

GOLD Sellers In Panic! BUY!
My dear friends,
Please, find my technical outlook for GOLD below:
The price is coiling around a solid key level - 3201.5
Bias - Bullish
Technical Indicators: Pivot Points Low anticipates a potential price reversal.
Super trend shows a clear buy, giving a perfect indicators' convergence.
Goal - 3216.0
Safe Stop Loss - 3194.0
About Used Indicators:
The pivot point itself is simply the average of the high, low and closing prices from the previous trading day.
Disclosure: I am part of Trade Nation's Influencer program and receive a monthly fee for using their TradingView charts in my analysis.
———————————
WISH YOU ALL LUCK

USDCHF Trading Opportunity! SELL!
My dear subscribers,
My technical analysis for USDCHF is below:
The price is coiling around a solid key level - 0.8228
Bias - Bearish
Technical Indicators: Pivot Points High anticipates a potential price reversal.
Super trend shows a clear sell, giving a perfect indicators' convergence.
Goal - 0.8190
About Used Indicators:
By the very nature of the supertrend indicator, it offers firm support and resistance levels for traders to enter and exit trades. Additionally, it also provides signals for setting stop losses
Disclosure: I am part of Trade Nation's Influencer program and receive a monthly fee for using their TradingView charts in my analysis.
———————————
WISH YOU ALL LUCK

Secure ptofits of LONG📊 BTC Daily Chart – In-Depth Analysis (as of Apr 15, 2025)
🔍 Overview
You're holding a long position from below $80K, still active but now at a +5-6% gain, while TP is placed around 88.3K, close to a key resistance and trendline confluence. Let's break this all down and answer your core question: Is it wise to secure profits now even if TP hasn't been reached?
⚒️ BitcoinMF PRO & Fisher Confirmation
The BitcoinMF PRO indicator has been delivering precise entries/exits—highlighted with green "Long" and red "Short" tags.
Your current active long was marked by BitcoinMF PRO near the lower end of the descending channel with Fisher Transform at a local bottom, signaling an extremely oversold bounce zone.
The Fisher is curling up from a "super low" region, meaning it is entering mid-zone. This reduces risk-reward from here for new longs—good reason to lock partial profits.
📉 Technical Chart Structure Breakdown
🔺 Linear Regression Channels:
BTC is now trading near the top of the smaller descending red channel, nearing rejection territory.
Also, it’s approaching the bottom half of the broader dark blue ascending channel = resistance cluster zone.
🔁 Elliott Wave Structure (Possibly Ending Wave 4)
This looks like a potential 3 → 4 → 5 wave structure unfolding.
Wave 3 likely bottomed near $71K- FWB:73K , and this long is likely part of Wave 4 retracement. If correct, Wave 5 may resume down again unless invalidated above $88.3K.
🔸 Fibonacci Watch:
0.5 Fib retracement from recent swing high to low is around $84.2K-$85.5K—you’re sitting on it right now.
0.618 Fib confluence is ~$88.5K, right where TP is set. That zone is statistically known for rejections. This is another reason to secure a chunk of profit now.
📉 Volume & Sentiment
Volume is weak on this rally, indicating a lack of conviction.
Fear & Greed Index (live: ⚠️ around 72 – greed zone) is starting to lean hot.
Market sentiment is optimistic, and price is hovering just below known short zones.
🏦 Whale Activity, Exchange Inflows & CME Gap
Whale wallets have shown mild accumulation at lower levels (~ FWB:73K -$75K), but no aggressive buying up here.
Exchange inflows are increasing slightly – suggesting some may be getting ready to sell into this strength.
✅ CME Gap around $66K is still unfilled. Historically 90% of gaps fill. Keep that in your long-term radar.
🔄 Long vs Shorts Ratio (Bybit + Binance)
On both Bybit and Binance, Longs > Shorts by ~58/42 – minor imbalance. Suggests majority is positioned long, slightly raising correction risk.
✅ Final Strategic Take
❗ Why You Should Secure Profits Now:
Price is at a resistance confluence zone (Fib + LR + sentiment).
The move has already run +5-6%, and even if price doesn’t touch TP at 88.3K, greed could erase that unrealized profit quickly.
If this is just Wave 4, the next move could be a final push down to $70K or lower (Wave 5).
Volume divergence + rising inflows = risk is increasing.
Locking at least 50-70% now is smart trader psychology. You can always re-enter.
🔮 Most Probable Next Move: 6.8 / 10 – Mild Up, Then Pullback
BTC has 69% probability of testing $86.5K–$88.5K, but rejection is very likely there.
After that, we could see a pullback to $80K–$82K.
Extreme bullish continuation (above $90K) currently has <20% probability unless macro/Fed/etc. change.
📌 Action Recommendation:
📈 Secure partial profits immediately.
🧠 Move stop-loss to breakeven or slightly in profit to protect the rest.
🛑 Avoid FOMO-ing into new longs now – let the chart confirm breakout first.
🧠 Ancient Wisdom:
In Pirkei Avot (Ethics of the Fathers), Rabbi Tarfon said:
“The day is short, the work is great… and the reward is much, but the Master is insistent.”
In trading terms: The market doesn’t owe you your TP. Secure reward when the work is done. Don’t overstay your welcome.
for more follow links in profile

SILVER My Opinion! SELL!`
My dear subscribers,
This is my opinion on the SILVER next move:
The instrument tests an important psychological level 32.295
Bias - Bearish
Technical Indicators: Supper Trend gives a precise Bearish signal, while Pivot Point HL predicts price changes and potential reversals in the market.
Target - 30.783
About Used Indicators:
On the subsequent day, trading above the pivot point is thought to indicate ongoing bullish sentiment, while trading below the pivot point indicates bearish sentiment.
Disclosure: I am part of Trade Nation's Influencer program and receive a monthly fee for using their TradingView charts in my analysis.
———————————
WISH YOU ALL LUCK

BTCUSD Technical Analysis! BUY!
My dear friends,
BTCUSD looks like it will make a good move, and here are the details:
The market is trading on 83747 pivot level.
Bias - Bullish
Technical Indicators: Supper Trend generates a clear long signal while Pivot Point HL is currently determining the overall Bullish trend of the market.
Goal - 84807
About Used Indicators:
Pivot points are a great way to identify areas of support and resistance, but they work best when combined with other kinds of technical analysis
Disclosure: I am part of Trade Nation's Influencer program and receive a monthly fee for using their TradingView charts in my analysis.
———————————
WISH YOU ALL LUCK

SPY Massive Long! BUY!
My dear subscribers,
SPY looks like it will make a good move, and here are the details:
The market is trading on 534.03 pivot level.
Bias - Bullish
My Stop Loss - 519.46
Technical Indicators: Both Super Trend & Pivot HL indicate a highly probable Bullish continuation.
Target - 560.94
About Used Indicators:
The average true range (ATR) plays an important role in 'Supertrend' as the indicator uses ATR to calculate its value. The ATR indicator signals the degree of price volatility.
Disclosure: I am part of Trade Nation's Influencer program and receive a monthly fee for using their TradingView charts in my analysis.
———————————
WISH YOU ALL LUCK

EURCAD: Short Signal Explained
EURCAD
- Classic bearish formation
- Our team expects fall
SUGGESTED TRADE:
Swing Trade
Sell EURCAD
Entry Level - 1.5767
Sl - 1.5868
Tp - 1.5567
Our Risk - 1%
Start protection of your profits from lower levels
Disclosure: I am part of Trade Nation's Influencer program and receive a monthly fee for using their TradingView charts in my analysis.
❤️ Please, support our work with like & comment! ❤️

GBPUSD: Short Trade with Entry/SL/TP
GBPUSD
- Classic bearish formation
- Our team expects pullback
SUGGESTED TRADE:
Swing Trade
Short GBPUSD
Entry - 1.3177
Sl - 1.3245
Tp - 1.3033
Our Risk - 1%
Start protection of your profits from lower levels
Disclosure: I am part of Trade Nation's Influencer program and receive a monthly fee for using their TradingView charts in my analysis.
❤️ Please, support our work with like & comment! ❤️

GBPNZD The Target Is UP! BUY!
My dear subscribers,
This is my opinion on the GBPNZD next move:
The instrument tests an important psychological level 2.2440
Bias - Bullish
Technical Indicators: Supper Trend gives a precise Bullish signal, while Pivot Point HL predicts price changes and potential reversals in the market.
Target - 2.2636
My Stop Loss - 2.2313
About Used Indicators:
On the subsequent day, trading above the pivot point is thought to indicate ongoing bullish sentiment, while trading below the pivot point indicates bearish sentiment.
Disclosure: I am part of Trade Nation's Influencer program and receive a monthly fee for using their TradingView charts in my analysis.
———————————
WISH YOU ALL LUCK

AUDUSD A Fall Expected! SELL!
My dear friends,
Please, find my technical outlook for AUDUSD below:
The instrument tests an important psychological level 0.6314
Bias - Bearish
Technical Indicators: Supper Trend gives a precise Bearish signal, while Pivot Point HL predicts price changes and potential reversals in the market.
Target - 0.6202
About Used Indicators:
Super-trend indicator is more useful in trending markets where there are clear uptrends and downtrends in price.
Disclosure: I am part of Trade Nation's Influencer program and receive a monthly fee for using their TradingView charts in my analysis.
———————————
WISH YOU ALL LUCK

NZDUSD - Bearish Control Soon!Hello TradingView Family / Fellow Traders. This is Richard, also known as theSignalyst.
📈NZDUSD has been hovering within a big range between $0.55 support and $0.59 resistance.
Currently, NZDUSD is retesting the upper bound of the wedge marked in blue.
Moreover, the $0.59 is a strong daily resistance zone.
🏹 Thus, the highlighted red circle is a strong area to look for sell setups as it is the intersection of the upper blue trendline and green resistance.
📚 As per my trading style:
As #NZDUSD is hovering around the red circle zone, I will be looking for bearish reversal setups (like a double top pattern, trendline break , and so on...)
📚 Always follow your trading plan regarding entry, risk management, and trade management.
Good luck!
All Strategies Are Good; If Managed Properly!
~Rich
Disclosure: I am part of Trade Nation's Influencer program and receive a monthly fee for using their TradingView charts in my analysis.

GBPUSD today should buy or sell?GBP/USD continues to build on its bullish momentum, reclaiming the 1.3100 level on Monday morning. The ongoing weakness of the U.S. dollar suggests that the path of least resistance for this pair remains to the upside.
The key monthly employment report is set to be released on Tuesday, followed by the latest consumer inflation data on Wednesday. In addition, investors this week will also face the release of U.S. monthly Retail Sales figures and pay close attention to a speech by Federal Reserve Chairman Jerome Powell — a speech that could play a crucial role in shaping the USD’s price dynamics. These events are expected to provide meaningful catalysts for the GBP/USD pair in the latter part of the week.

Gold Gathers Strength Amid Global UncertaintyRight now, gold is benefiting from a convergence of highly favorable conditions for a strong bullish trend. Growing concerns about a global trade war have triggered widespread risk-off sentiment, driving capital flows into safe-haven assets like gold. As a result, the precious metal has maintained an impressive upward momentum throughout the past week and is currently stabilizing around $3,235.
From my personal view, the U.S. dollar is showing clear signs of weakness — and that only adds fuel to gold’s rally. The $3,300 mark looks like the next logical milestone, with $3,500 as a longer-term target if the current trend holds. Recent corrections in gold have been shallow and brief, which reflects persistent buying pressure and no signs of a distribution phase at the top.
This week, we should pay close attention to major monetary policy events, including meetings from the Bank of Canada, the ECB, and a speech by Federal Reserve Chairman Jerome Powell. These events could bring increased volatility to the market. However, if central banks hold or cut rates as expected, it will provide even stronger psychological and technical support for gold.
Personally, I remain optimistic about the bullish outlook on XAUUSD — how about you?

BTC - Really interesting SHORT setupIt is so interesting right now.
1) A short is sooooo obvious. So many bearish Divergences in Volume, Delta, OBV, CVD etc...
OI + CVD shows shorts are opening. An at least 2% Short is really obvious.
But OI + Delta shows that Longs are getting absorbed!
2) BUT : Some sixth sense tells me there could be a SFP or Short Stop hunt at that level.
if the Price breaks up and moves further up for days, then it is a news or news manipulation.
a short Term fake break out would be possible too. About 30%.
More possible :https://www.tradingview.com/x/TPvZufPX/
Less possible Or news Or Fake out:
Follow for more ideas/Signals. 💲
Look at my other ideas 😉
Just donate some of your profit to Animal rights and rescue or other charity :)✌️

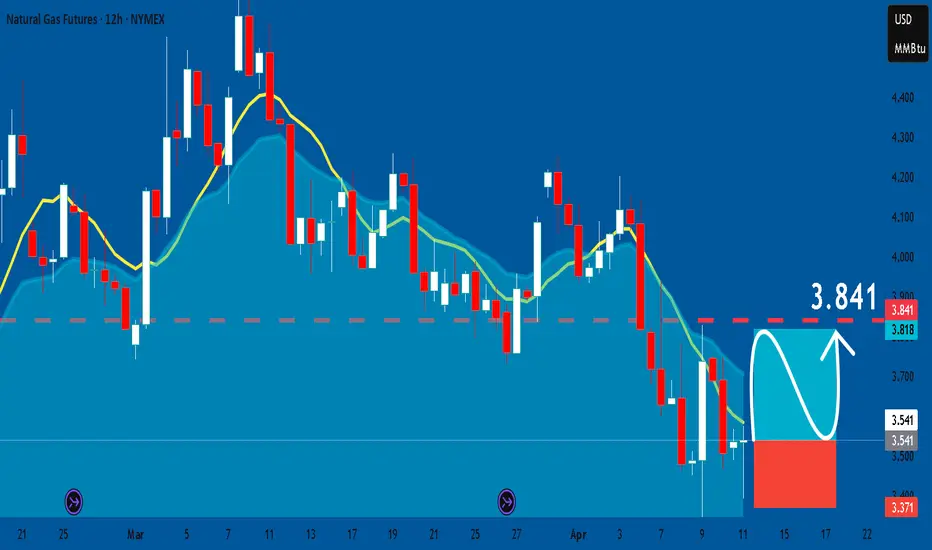
NATGAS: Long Trade Explained
NATGAS
- Classic bullish formation
- Our team expects pullback
SUGGESTED TRADE:
Swing Trade
Long NATGAS
Entry - 3.541
Sl - 3.371
Tp - 3.841
Our Risk - 1%
Start protection of your profits from lower levels
Disclosure: I am part of Trade Nation's Influencer program and receive a monthly fee for using their TradingView charts in my analysis.
❤️ Please, support our work with like & comment! ❤️
Trading opportunity for SUIUSDTBased on technical factors there is a Sell position in :
📊 SUIUSDT
🔴 Sell Now
🪫Stop loss 2.8700
🔋Target 1.1100
📏 R/R 2
💸RISK : 1%
We hope it is profitable for you ❤️
Please support our activity with your likes👍 and comments📝

APPLE: Long Trade with Entry/SL/TP
APPLE
- Classic bullish pattern
- Our team expects retracement
SUGGESTED TRADE:
Swing Trade
Buy APPLE
Entry - 198.05
Stop - 191.79
Take - 216.53
Our Risk - 1%
Start protection of your profits from lower levels
Disclosure: I am part of Trade Nation's Influencer program and receive a monthly fee for using their TradingView charts in my analysis.
❤️ Please, support our work with like & comment! ❤️

CADJPY Sellers In Panic! BUY!
My dear friends,
CADJPY looks like it will make a good move, and here are the details:
The market is trading on 103.54 pivot level.
Bias - Bullish
Technical Indicators: Supper Trend generates a clear long signal while Pivot Point HL is currently determining the overall Bullish trend of the market.
Goal - 104.58
Recommended Stop Loss - 102.96
About Used Indicators:
Pivot points are a great way to identify areas of support and resistance, but they work best when combined with other kinds of technical analysis
Disclosure: I am part of Trade Nation's Influencer program and receive a monthly fee for using their TradingView charts in my analysis.
———————————
WISH YOU ALL LUCK

EURUSD Trading Opportunity! SELL!
My dear followers,
I analysed this chart on EURUSD and concluded the following:
The market is trading on 1.1042 pivot level.
Bias - Bearish
Technical Indicators: Both Super Trend & Pivot HL indicate a highly probable Bearish continuation.
Target - 1.1006
About Used Indicators:
A super-trend indicator is plotted on either above or below the closing price to signal a buy or sell. The indicator changes color, based on whether or not you should be buying. If the super-trend indicator moves below the closing price, the indicator turns green, and it signals an entry point or points to buy.
Disclosure: I am part of Trade Nation's Influencer program and receive a monthly fee for using their TradingView charts in my analysis.
———————————
WISH YOU ALL LUCK

EURUSD Will Collapse! SELL!
My dear friends,
My technical analysis for EURUSD is below:
The market is trading on 1.1358 pivot level.
Bias - Bearish
Technical Indicators: Both Super Trend & Pivot HL indicate a highly probable Bearish continuation.
Target - 1.1204
Recommended Stop Loss - 1.1454
About Used Indicators:
A pivot point is a technical analysis indicator, or calculations, used to determine the overall trend of the market over different time frames.
Disclosure: I am part of Trade Nation's Influencer program and receive a monthly fee for using their TradingView charts in my analysis.
———————————
WISH YOU ALL LUCK
