GOLD - Eyeing Two Levels!Hello TradingView Family / Fellow Traders. This is Richard, also known as theSignalyst.
📈 XAUUSD remains overall bullish in both the short and medium term, trading within the rising channels marked in orange and green.
🔍 Here are two key levels I'm watching for potential trend-following long setups:
1️⃣$3,000 – A psychological round number that aligns with the lower orange trendline.
2️⃣$2,950 – A support level that intersects with the lower blue trendline.
Let’s see if the bulls hold the line! 🐂✨
📚 Always follow your trading plan regarding entry, risk management, and trade management.
Good luck!
All Strategies Are Good; If Managed Properly!
~Rich
Disclosure: I am part of Trade Nation's Influencer program and receive a monthly fee for using their TradingView charts in my analysis.
P-signal

FXAN & Heikin Ashi Trade IdeaOANDA:USDCHF
In this video, I’ll be sharing my analysis of USDCHF, using FXAN's proprietary algo indicators with my unique Heikin Ashi strategy. I’ll walk you through the reasoning behind my trade setup and highlight key areas where I’m anticipating potential opportunities.
I’m always happy to receive any feedback.
Like, share and comment! ❤️
Thank you for watching my videos! 🙏

JPY/USD Technical Analysis – Bullish Breakout from Falling WedgeIntroduction
The JPY/USD chart showcases a classic falling wedge pattern, a strong bullish reversal signal. This pattern is characterized by converging downward-sloping trendlines, indicating a weakening bearish momentum. Eventually, buyers stepped in, leading to a breakout to the upside. This analysis breaks down key elements, including support and resistance zones, trendlines, trading strategy, and risk management.
1. Breakdown of the Chart Pattern
A. The Falling Wedge Formation (Bullish Reversal Pattern)
A falling wedge is a bullish technical pattern that forms when the price consolidates within two downward-sloping trendlines that converge over time. This signals that selling pressure is decreasing and a reversal may be near.
Downtrend Structure: The price was previously in a consistent downtrend, making lower highs and lower lows, which formed the wedge.
Breakout Confirmation: Once the price broke above the upper trendline, the pattern was confirmed, indicating the start of a bullish move.
Retest Possibility: Often, after a breakout, the price retests the upper trendline before continuing higher. If it holds, it strengthens the bullish outlook.
B. Key Levels Identified in the Chart
1. Support Zone (Buying Area)
The price found strong support in the 0.006291 – 0.006500 region.
Buyers stepped in, preventing the price from dropping further.
This support level coincides with the bottom of the wedge, further validating its importance.
2. Resistance Zone (Profit Target)
The 0.007100 – 0.007200 area is a major resistance level where sellers have previously dominated.
If the price reaches this level and consolidates, traders will look for either a breakout or a rejection.
A break above 0.007200 would indicate further bullish continuation.
3. Trendlines & Curve Formation
A curved trendline in the chart suggests a gradual transition from bearish to bullish momentum.
The dotted ascending trendline now acts as dynamic support, helping the price sustain its bullish move.
2. Trading Strategy & Risk Management
A. Entry Strategies
Traders have two primary ways to enter this trade:
Aggressive Entry:
Enter immediately after the breakout of the wedge.
Higher risk but captures early momentum.
Conservative Entry:
Wait for a pullback to the trendline before entering.
Lower risk as it confirms trend continuation.
B. Take Profit Targets
Primary Target: 0.007117 (Resistance level from previous highs).
Extended Target: 0.007200 (Next significant resistance).
C. Stop Loss Placement
Below the recent swing low at 0.006291 to protect against false breakouts.
Ensures a favorable risk-to-reward ratio.
3. Market Sentiment & Confirmation Signals
✅ Bullish Confirmation
Breakout from the falling wedge
Price holding above the trendline
Higher highs and higher lows formation
Increased buying volume
⚠️ Bearish Risks & Invalidations
A break below the trendline would indicate weak momentum.
If the price fails to hold support, it could reverse downward.
Low volume on the breakout could signal a fake breakout.
4. Final Thoughts
This setup provides a high-probability trading opportunity following the breakout from a falling wedge pattern. The risk-to-reward ratio is favorable, making it an ideal setup for trend-following traders. However, patience is key—waiting for a successful retest before entering can minimize risks. If the price maintains momentum, we could see a rally toward the 0.007100 – 0.007200 resistance zone in the coming weeks. 🚀

Trading opportunity for Tensor TNSRUSDTBased on technical factors there is a Buy position in :
📊 TNSRUSDT
🔵 Buy Now
🪫Stop loss 0.1950
🔋Target 0.2500
📏 R/R 2
💸RISK : 1%
We hope it is profitable for you ❤️
Please support our activity with your likes👍 and comments📝

Trading opportunity for Grass GRASSUSDTBased on technical factors there is a Buy position in :
📊 GRASSUSDT
🔵 Buy Now
🪫Stop loss 1.1900
🔋Target 1.6000
📏 R/R 1,8
💸RISK : 1%
We hope it is profitable for you ❤️
Please support our activity with your likes👍 and comments📝

USDCAD What Next? SELL!
My dear subscribers,
This is my opinion on the USDCAD next move:
The instrument tests an important psychological level 1.4356
Bias - Bearish
Technical Indicators: Supper Trend gives a precise Bearish signal, while Pivot Point HL predicts price changes and potential reversals in the market.
Target - 1.4330
About Used Indicators:
On the subsequent day, trading above the pivot point is thought to indicate ongoing bullish sentiment, while trading below the pivot point indicates bearish sentiment.
Disclosure: I am part of Trade Nation's Influencer program and receive a monthly fee for using their TradingView charts in my analysis.
———————————
WISH YOU ALL LUCK

QQQ Will Explode! BUY!
My dear friends,
Please, find my technical outlook for QQQ below:
The price is coiling around a solid key level - 481.04
Bias - Bullish
Technical Indicators: Pivot Points Highanticipates a potential price reversal.
Super trend shows a clear buy, giving a perfect indicators' convergence.
Goal - 498.55
Safe Stop Loss - 471.31
About Used Indicators:
The pivot point itself is simply the average of the high, low and closing prices from the previous trading day.
Disclosure: I am part of Trade Nation's Influencer program and receive a monthly fee for using their TradingView charts in my analysis.
———————————
WISH YOU ALL LUCK

USDJPY Massive Short! SELL!
My dear friends,
USDJPY looks like it will make a good move, and here are the details:
The market is trading on 150.66 pivot level.
Bias - Bearish
Technical Indicators: Supper Trend generates a clear short signal while Pivot Point HL is currently determining the overall Bearish trend of the market.
Goal - 149.11
Recommended Stop Loss - 151.56
About Used Indicators:
Pivot points are a great way to identify areas of support and resistance, but they work best when combined with other kinds of technical analysis
Disclosure: I am part of Trade Nation's Influencer program and receive a monthly fee for using their TradingView charts in my analysis.
———————————
WISH YOU ALL LUCK

NZDCAD: Bullish Continuation & Long Trade
NZDCAD
- Classic bullish formation
- Our team expects growth
SUGGESTED TRADE:
Swing Trade
Buy NZDCAD
Entry Level - 0.8206
Sl - 0.8171
Tp - 0.8262
Our Risk - 1%
Start protection of your profits from lower levels
Disclosure: I am part of Trade Nation's Influencer program and receive a monthly fee for using their TradingView charts in my analysis.
❤️ Please, support our work with like & comment! ❤️

CHFJPY The Target Is DOWN! SELL!
My dear followers,
I analysed this chart on CHFJPY and concluded the following:
The market is trading on 169.95 pivot level.
Bias - Bearish
Technical Indicators: Both Super Trend & Pivot HL indicate a highly probable Bearish continuation.
Target - 168.83
Safe Stop Loss - 170.67
About Used Indicators:
A super-trend indicator is plotted on either above or below the closing price to signal a buy or sell. The indicator changes color, based on whether or not you should be buying. If the super-trend indicator moves below the closing price, the indicator turns green, and it signals an entry point or points to buy.
Disclosure: I am part of Trade Nation's Influencer program and receive a monthly fee for using their TradingView charts in my analysis.
———————————
WISH YOU ALL LUCK

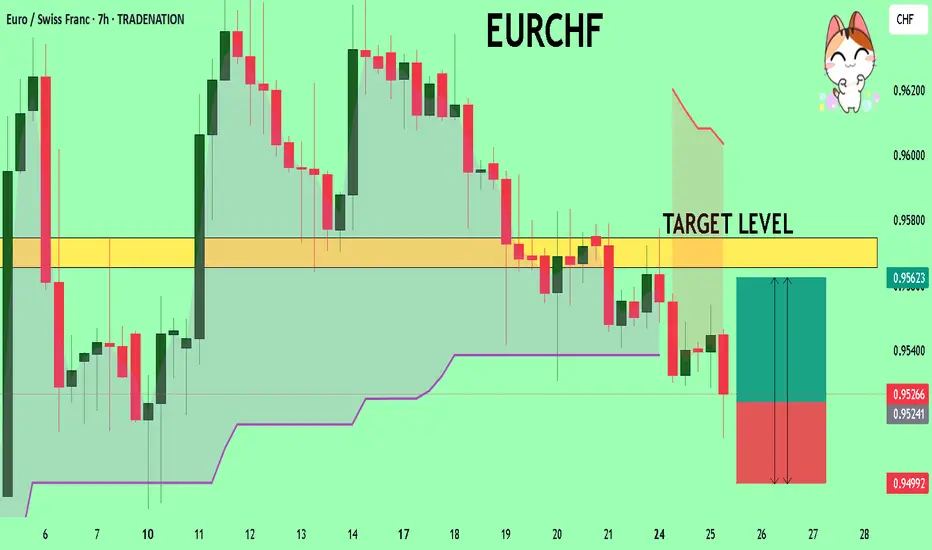
EURCHF My Opinion! BUY!
My dear friends,
EURCHF looks like it will make a good move, and here are the details:
The market is trading on 0.9524 pivot level.
Bias - Bullish
Technical Indicators: Supper Trend generates a clear long signal while Pivot Point HL is currently determining the overall Bullish trend of the market.
Goal -0.9565
Recommended Stop Loss - 0.9499
About Used Indicators:
Pivot points are a great way to identify areas of support and resistance, but they work best when combined with other kinds of technical analysis
Disclosure: I am part of Trade Nation's Influencer program and receive a monthly fee for using their TradingView charts in my analysis.
———————————
WISH YOU ALL LUCK
GOLD: Bearish Continuation & Short Trade
GOLD
- Classic bearish setup
- Our team expects bearish continuation
SUGGESTED TRADE:
Swing Trade
Short GOLD
Entry Point - 3028.77
Stop Loss - 3035.59
Take Profit - 3013.9
Our Risk - 1%
Start protection of your profits from lower levels
Disclosure: I am part of Trade Nation's Influencer program and receive a monthly fee for using their TradingView charts in my analysis.
❤️ Please, support our work with like & comment! ❤️

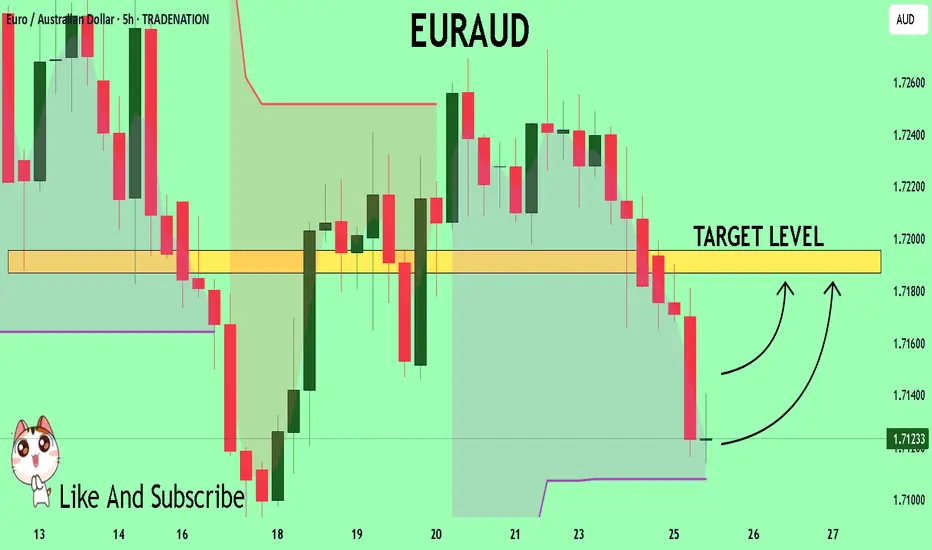
EURAUD Set To Grow! BUY!
My dear subscribers,
This is my opinion on the EURAUD next move:
The instrument tests an important psychological level 1.7135
Bias - Bullish
Technical Indicators: Supper Trend gives a precise Bullish signal, while Pivot Point HL predicts price changes and potential reversals in the market.
Target - 1.7187
About Used Indicators:
On the subsequent day, trading above the pivot point is thought to indicate ongoing bullish sentiment, while trading below the pivot point indicates bearish sentiment.
Disclosure: I am part of Trade Nation's Influencer program and receive a monthly fee for using their TradingView charts in my analysis.
———————————
WISH YOU ALL LUCK
COMP - Shift in Momentum in Action!Hello TradingView Family / Fellow Traders. This is Richard, also known as theSignalyst.
🔹 COMP has been overall bearish trading within the falling channel in red.
However , it is currently rejecting a strong weekly support at $35 - $40.
Moreover, it is clear that the bears are exhausted as the bearish impulse phases are getting more flat.
📈 For the bulls to take over, and shift the momentum in their favor, a break above both trendlines and $50 round number is needed.
📚 Always follow your trading plan regarding entry, risk management, and trade management.
Good luck!
All Strategies Are Good; If Managed Properly!
~Rich

GBPJPY: Short Signal with Entry/SL/TP
GBPJPY
- Classic bearish formation
- Our team expects fall
SUGGESTED TRADE:
Swing Trade
Sell GBPJPY
Entry Level - 194.59
Sl - 195.64
Tp - 192.40
Our Risk - 1%
Start protection of your profits from lower levels
Disclosure: I am part of Trade Nation's Influencer program and receive a monthly fee for using their TradingView charts in my analysis.
❤️ Please, support our work with like & comment! ❤️

CADJPY: Short Signal Explained
CADJPY
- Classic bearish formation
- Our team expects pullback
SUGGESTED TRADE:
Swing Trade
Short CADJPY
Entry - 105.05
Sl - 105.73
Tp - 103.81
Our Risk - 1%
Start protection of your profits from lower levels
Disclosure: I am part of Trade Nation's Influencer program and receive a monthly fee for using their TradingView charts in my analysis.
❤️ Please, support our work with like & comment! ❤️

AUDNZD Under Pressure! SELL!
My dear friends,
My technical analysis for AUDNZD is below:
The market is trading on 1.0985 pivot level.
Bias - Bullish
Technical Indicators: Both Super Trend & Pivot HL indicate a highly probable Bearish continuation.
Target - 1.0951
About Used Indicators:
A pivot point is a technical analysis indicator, or calculations, used to determine the overall trend of the market over different time frames.
Disclosure: I am part of Trade Nation's Influencer program and receive a monthly fee for using their TradingView charts in my analysis.
———————————
WISH YOU ALL LUCK

USDCAD Expected Growth! BUY!
My dear subscribers,
USDCAD looks like it will make a good move, and here are the details:
The market is trading on 1.4316 pivot level.
Bias - Bullish
Technical Indicators: Both Super Trend & Pivot HL indicate a highly probable Bullish continuation.
Target - 1.4336
About Used Indicators:
The average true range (ATR) plays an important role in 'Supertrend' as the indicator uses ATR to calculate its value. The ATR indicator signals the degree of price volatility.
Disclosure: I am part of Trade Nation's Influencer program and receive a monthly fee for using their TradingView charts in my analysis.
———————————
WISH YOU ALL LUCK

Trading opportunity for Ravencoin RVNUSDTBased on technical factors there is a Buy position in :
📊 RVNUSDT
🔵 Buy Now
🪫Stop loss 0.01040
🔋Target 0.01820
📏 R/R 2,2
💸RISK : 1%
We hope it is profitable for you ❤️
Please support our activity with your likes👍 and comments📝

Trading opportunity for STPTUSDTBased on technical factors there is a Buy position in :
📊 STPTUSDT
🔵 Buy Now
🪫Stop loss 0.04200
🔋Target 0.06450
📏 R/R 3
💸RISK : 1%
We hope it is profitable for you ❤️
Please support our activity with your likes👍 and comments📝

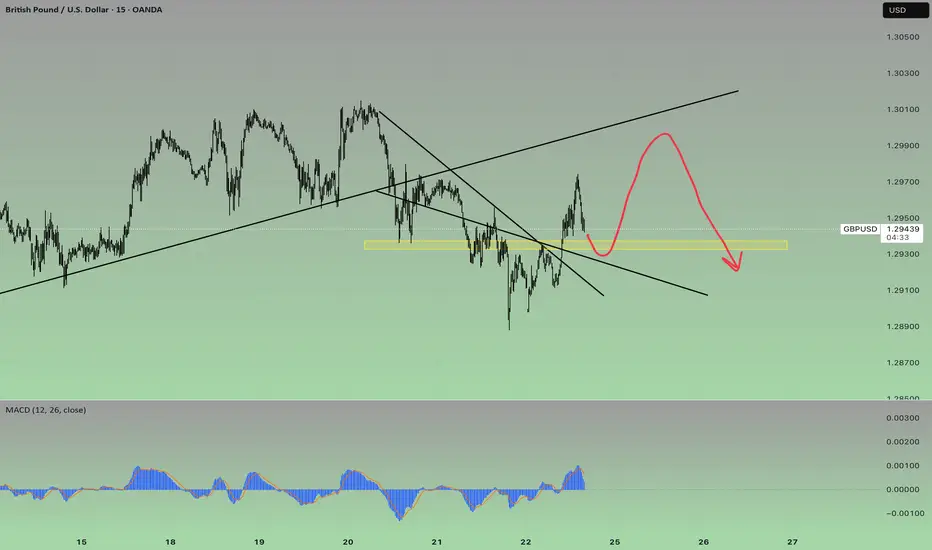
Pedramfxtrader | GBPUSD BUY We have a specific type of divergence on the 1-hour timeframe ⏳, indicating a potential drop 📉 in the higher timeframe. On the other hand, the lower 15-minute timeframe 🕒 gives us a buying perspective 📈. So, the analysis will be as shown in the image.
#GBPUSD #ForexTrading #PriceAction #ForexSignals #TradingAnalysis 💹
GBPUSD - Chasing the Bulls!!Hello TradingView Family / Fellow Traders. This is Richard, also known as theSignalyst.
📈GBPUSD has been overall bullish trading within the rising channel marked in red.
Moreover, the blue zone is a major daily support.
🏹 Thus, the highlighted blue circle is a strong area to look for buy setups as it is the intersection of daily support zone and lower red trendline acting as a non-horizontal support.
📚 As per my trading style:
As #GBPUSD approaches the blue circle zone, I will be looking for bullish reversal setups (like a double bottom pattern, trendline break , and so on...)
📚 Always follow your trading plan regarding entry, risk management, and trade management.
Good luck!
All Strategies Are Good; If Managed Properly!
~Rich
Disclosure: I am part of Trade Nation's Influencer program and receive a monthly fee for using their TradingView charts in my analysis.

Trading opportunity for FLRUSDTBased on technical factors there is a Buy position in :
📊 FLRUSDT
🔵 Buy Now
🪫Stop loss 0.01350
🔋Target 0.01900
📏 R/R 3
💸RISK : 1%
We hope it is profitable for you ❤️
Please support our activity with your likes👍 and comments📝
