EURGBP Will Explode! BUY!
My dear friends,
Please, find my technical outlook for EURGBP below:
The instrument tests an important psychological level 0.8496
Bias - Bullish
Technical Indicators: Supper Trend gives a precise Bullish signal, while Pivot Point HL predicts price changes and potential reversals in the market.
Target - 0.8538
About Used Indicators:
Super-trend indicator is more useful in trending markets where there are clear uptrends and downtrends in price.
Disclosure: I am part of Trade Nation's Influencer program and receive a monthly fee for using their TradingView charts in my analysis.
———————————
WISH YOU ALL LUCK
P-signal

AUDUSD A Fall Expected! SELL!
My dear subscribers,
My technical analysis for AUDUSD is below:
The price is coiling around a solid key level - 0.6418
Bias - Bearish
Technical Indicators: Pivot Points High anticipates a potential price reversal.
Super trend shows a clear sell, giving a perfect indicators' convergence.
Goal - 0.6412
About Used Indicators:
By the very nature of the supertrend indicator, it offers firm support and resistance levels for traders to enter and exit trades. Additionally, it also provides signals for setting stop losses
Disclosure: I am part of Trade Nation's Influencer program and receive a monthly fee for using their TradingView charts in my analysis.
———————————
WISH YOU ALL LUCK

GOLD Trading Opportunity! SELL!
My dear subscribers,
This is my opinion on the GOLD next move:
The instrument tests an important psychological level 3307.1
Bias - Bearish
Technical Indicators: Supper Trend gives a precise Bearish signal, while Pivot Point HL predicts price changes and potential reversals in the market.
Target - 3292.6
My Stop Loss - 3313.6
About Used Indicators:
On the subsequent day, trading above the pivot point is thought to indicate ongoing bullish sentiment, while trading below the pivot point indicates bearish sentiment.
Disclosure: I am part of Trade Nation's Influencer program and receive a monthly fee for using their TradingView charts in my analysis.
———————————
WISH YOU ALL LUCK

GBPUSD - Bearish Pressure Soon!Hello TradingView Family / Fellow Traders. This is Richard, also known as theSignalyst.
📈As per our last GBPUSD analysis, it rejected the $1.27 - $1.28 support zone and has been trading higher.
This week, GBPUSD is approaching the upper bound of its rising wedge pattern marked in red.
Moreover, the blue zone around $1.34 is a strong resistance and previous weekly high.
🏹 Thus, the highlighted red circle is a strong area to look for sell setups as it is the intersection of the upper red trendline and resistance.
📚 As per my trading style:
As #GBPUSD retests the red circle zone, I will be looking for bearish reversal setups (like a double top pattern, trendline break , and so on...)
📚 Always follow your trading plan regarding entry, risk management, and trade management.
Good luck!
All Strategies Are Good; If Managed Properly!
~Rich
Disclosure: I am part of Trade Nation's Influencer program and receive a monthly fee for using their TradingView charts in my analysis.

GBPJPY NEXT WEEK BULLISH OR BEARISH ??GBPJPY is setting up for a major breakout on the weekly timeframe. After weeks of consolidation under a clear descending trendline, price action is now approaching a decisive point where a bullish breakout could trigger a strong rally. With the current price holding firm at 191.00 and clear resistance overhead, a successful breakout could open the doors for a powerful bullish wave targeting 205.000 and beyond.
Fundamentally, the yen remains weak due to continued Bank of Japan dovishness and ongoing yield curve control policies. Meanwhile, the British pound is finding strength as the Bank of England maintains a relatively hawkish stance with the possibility of delaying rate cuts compared to other major central banks. This fundamental divergence between GBP and JPY heavily favors bullish momentum for GBPJPY.
Technically, the pair has formed a solid base of support and is squeezing toward the apex of a descending triangle. If the breakout confirms with strong bullish volume, GBPJPY could enter a fresh bullish cycle, offering a great risk-reward setup for medium to long-term traders aiming for the 205.000 area.
Overall, GBPJPY remains one of the hottest pairs on watch right now with excellent bullish potential. Traders should watch for a clean breakout above the trendline with strong candlestick confirmation to ride the wave higher. Staying patient and disciplined around this breakout zone could deliver highly profitable results.

SILVER: Short Trading Opportunity
SILVER
- Classic bearish formation
- Our team expects fall
SUGGESTED TRADE:
Swing Trade
Sell SILVER
Entry Level - 33.096
Sl - 33.729
Tp - 31.949
Our Risk - 1%
Start protection of your profits from lower levels
Disclosure: I am part of Trade Nation's Influencer program and receive a monthly fee for using their TradingView charts in my analysis.
❤️ Please, support our work with like & comment! ❤️

RENDER/USDT:BUY Hello friends
Given the price growth we had, a range has now been created in the price correction, which indicates the strength of the trend, so we can enter the trade.
The purchase and target points have also been identified...
Follow capital management.
*Trade safely with us*

TESLA: Short Trade Explained
TESLA
- Classic bearish formation
- Our team expects pullback
SUGGESTED TRADE:
Swing Trade
Short TESLA
Entry - 284.90
Sl - 298.09
Tp - 256.85
Our Risk - 1%
Start protection of your profits from lower levels
Disclosure: I am part of Trade Nation's Influencer program and receive a monthly fee for using their TradingView charts in my analysis.
❤️ Please, support our work with like & comment! ❤️

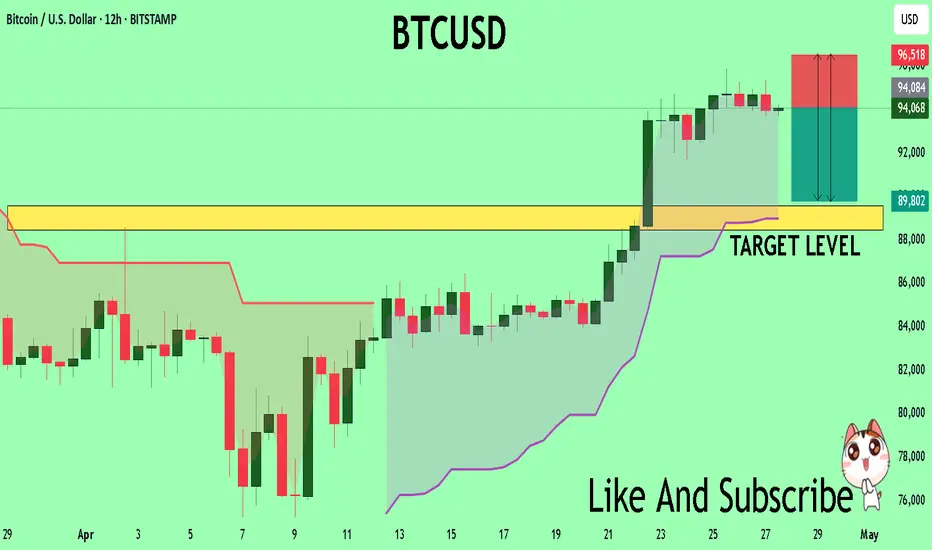
BTCUSD What Next? SELL!
My dear friends,
Please, find my technical outlook for BTCUSD below:
The price is coiling around a solid key level - 94068
Bias - Bearish
Technical Indicators: Pivot Points Low anticipates a potential price reversal.
Super trend shows a clear sell, giving a perfect indicators' convergence.
Goal - 89586
Safe Stop Loss - 96518
About Used Indicators:
The pivot point itself is simply the average of the high, low and closing prices from the previous trading day.
Disclosure: I am part of Trade Nation's Influencer program and receive a monthly fee for using their TradingView charts in my analysis.
———————————
WISH YOU ALL LUCK
NATGAS Set To Fall! SELL!
My dear friends,
NATGAS looks like it will make a good move, and here are the details:
The market is trading on 2.964 pivot level.
Bias - Bearish
Technical Indicators: Supper Trend generates a clear short signal while Pivot Point HL is currently determining the overall Bearish trend of the market.
Goal - 2.929
About Used Indicators:
Pivot points are a great way to identify areas of support and resistance, but they work best when combined with other kinds of technical analysis
Disclosure: I am part of Trade Nation's Influencer program and receive a monthly fee for using their TradingView charts in my analysis.
———————————
WISH YOU ALL LUCK

NVDIA Death Cross Quant Perspectives (Light Case Study)NASDAQ: Nvidia (NVDA ) has recently experienced an uptrend after a death cross formed consisting of the 65 and 200 EMAs on the 1 Day chart.
If we analyze back on Nvidia starting in 1999 , we can count a total of 10 death crosses that have occurred, and 9 have been immediately followed by downtrends. Although a single death cross did not have an immediate downtrend, shortly after this event (approx. 282 days) another death cross formed and price then fell roughly twice as it historically has , almost appearing to make up for the missed signal.
From a quantitative perspective:
If we calculate the raw historical success rate using:
Raw Success Rate = 9/10 = 90
With this calculation the observed success of 65/200 EMA death crosses correlating to an immediate downtrend is 90%
In order to avoid overconfidence we can apply Laplace smoothing using:
Smoothed Probability = 9+1/10+2 = 10/12 or 0.8333
With this calculation the observed success of 65/200 EMA death crosses correlating to an immediate downtrend is 83%
Given the results of the data I personally feel that there is a Very High (83%) chance this death cross that recently formed on the 1 Day chart (around 04/16/2025) will immediately lead to a downtrend. And a Low (17%) chance it does not. Furthermore these results support a technical analysis hypothesis that I formed prior.
Many different systemic factors can contribute to the market movement, but mathematics sometimes leave subtle clues. Will the market become bearish? Or will Nvidia gain renewed bullish interest?
Disclaimer: Not Financial Advice.

BTCUSD: Trading Signal From Our Team
BTCUSD
- Classic bearish pattern
- Our team expects retracement
SUGGESTED TRADE:
Swing Trade
Sell BTCUSD
Entry - 95407
Stop - 99310
Take - 88838
Our Risk - 1%
Start protection of your profits from lower levels
Disclosure: I am part of Trade Nation's Influencer program and receive a monthly fee for using their TradingView charts in my analysis.
❤️ Please, support our work with like & comment! ❤️

CADJPY: Bearish Continuation & Short Trade
CADJPY
- Classic bearish setup
- Our team expects bearish continuation
SUGGESTED TRADE:
Swing Trade
Short CADJPY
Entry Point - 103.70
Stop Loss - 104.30
Take Profit - 102.64
Our Risk - 1%
Start protection of your profits from lower levels
Disclosure: I am part of Trade Nation's Influencer program and receive a monthly fee for using their TradingView charts in my analysis.
❤️ Please, support our work with like & comment! ❤️

EURJPY Massive Long! BUY!
My dear friends,
EURJPY looks like it will make a good move, and here are the details:
The market is trading on 161.30 pivot level.
Bias - Bullish
Technical Indicators: Supper Trend generates a clear long signal while Pivot Point HL is currently determining the overall Bullish trend of the market.
Goal - 161.68
About Used Indicators:
Pivot points are a great way to identify areas of support and resistance, but they work best when combined with other kinds of technical analysis
Disclosure: I am part of Trade Nation's Influencer program and receive a monthly fee for using their TradingView charts in my analysis.
———————————
WISH YOU ALL LUCK

CADJPY Technical Analysis! SELL!
My dear subscribers,
CADJPY looks like it will make a good move, and here are the details:
The market is trading on 103.88 pivot level.
Bias - Bearish
Technical Indicators: Both Super Trend & Pivot HL indicate a highly probable Bearish continuation.
Target - 103.40
About Used Indicators:
The average true range (ATR) plays an important role in 'Supertrend' as the indicator uses ATR to calculate its value. The ATR indicator signals the degree of price volatility.
Disclosure: I am part of Trade Nation's Influencer program and receive a monthly fee for using their TradingView charts in my analysis.
———————————
WISH YOU ALL LUCK

GBPCHF The Target Is DOWN! SELL!
My dear followers,
This is my opinion on the GBPCHF next move:
The asset is approaching an important pivot point 1.1017
Bias - Bearish
Safe Stop Loss - 1.1089
Technical Indicators: Supper Trend generates a clear short signal while Pivot Point HL is currently determining the overall Bearish trend of the market.
Goal - 1.0879
About Used Indicators:
For more efficient signals, super-trend is used in combination with other indicators like Pivot Points.
Disclosure: I am part of Trade Nation's Influencer program and receive a monthly fee for using their TradingView charts in my analysis.
———————————
WISH YOU ALL LUCK

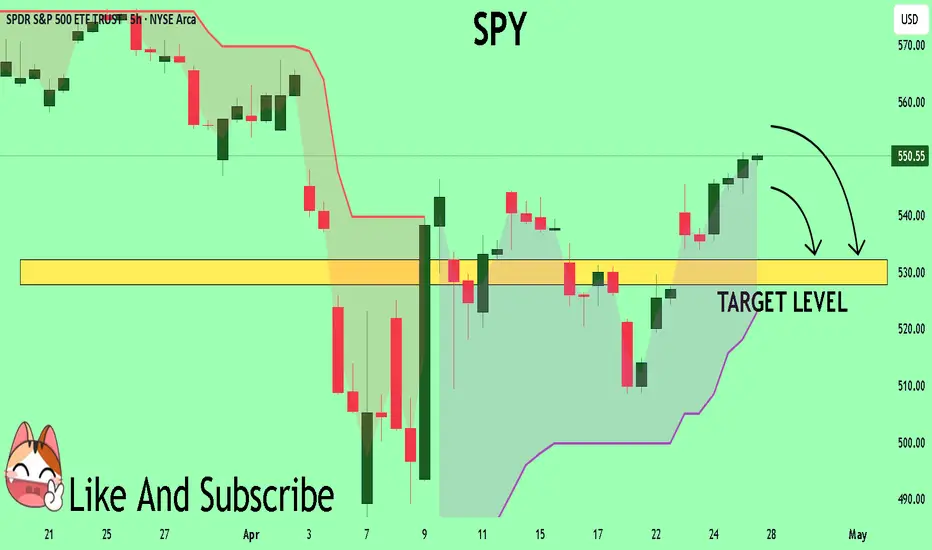
SPY Buyers In Panic! SELL!
My dear subscribers,
This is my opinion on the SPY next move:
The instrument tests an important psychological level 550.55
Bias - Bearish
Technical Indicators: Supper Trend gives a precise Bearish signal, while Pivot Point HL predicts price changes and potential reversals in the market.
Target - 532.22
About Used Indicators:
On the subsequent day, trading above the pivot point is thought to indicate ongoing bullish sentiment, while trading below the pivot point indicates bearish sentiment.
Disclosure: I am part of Trade Nation's Influencer program and receive a monthly fee for using their TradingView charts in my analysis.
———————————
WISH YOU ALL LUCK
SILVER My Opinion! BUY!
My dear friends,
Please, find my technical outlook for NATGAS below:
The price is coiling around a solid key level - 33.100
Bias - Bullish
Technical Indicators: Pivot Points Low anticipates a potential price reversal.
Super trend shows a clear buy, giving a perfect indicators' convergence.
Goal - 33.330
About Used Indicators:
The pivot point itself is simply the average of the high, low and closing prices from the previous trading day.
Disclosure: I am part of Trade Nation's Influencer program and receive a monthly fee for using their TradingView charts in my analysis.
———————————
WISH YOU ALL LUCK

GoldGold daily analysis
Time frame hourly
Risk rewards ratio >2
Analysis after explosion in Bandar Abas IRAN

Cosmos (Atom)Atom usdt Daily analysis
Time frame daily
We have 2 models of analysis
1. The green line. Price can't break the resistance line and fall down to 3.5$
2. Price can break the resistance (gray line) and pump to 9$
Therfore we must watch the reaction of price and resistance

EURUSD Buyers In Panic! SELL!
My dear friends,
Please, find my technical outlook for EURUSD below:
The price is coiling around a solid key level - 1.1506
Bias - Bearish
Technical Indicators: Pivot Points High anticipates a potential price reversal.
Super trend shows a clear sell, giving a perfect indicators' convergence.
Goal - 1.1409
About Used Indicators:
The pivot point itself is simply the average of the high, low and closing prices from the previous trading day.
———————————
WISH YOU ALL LUCK

GOLD My Opinion! SELL!
My dear friends,
GOLD looks like it will make a good move, and here are the details:
The market is trading on 3339.9 pivot level.
Bias - Bearish
Technical Indicators: Supper Trend generates a clear short signal while Pivot Point HL is currently determining the overall Bearish trend of the market.
Goal - 3323.8
Recommended Stop Loss - 3347.3
About Used Indicators:
Pivot points are a great way to identify areas of support and resistance, but they work best when combined with other kinds of technical analysis
Disclosure: I am part of Trade Nation's Influencer program and receive a monthly fee for using their TradingView charts in my analysis.
———————————
WISH YOU ALL LUCK

NZDCAD Trading Opportunity! SELL!
My dear followers,
This is my opinion on the NZDCAD next move:
The asset is approaching an important pivot point 0.8279
Bias - Bearish
Technical Indicators: Supper Trend generates a clear short signal while Pivot Point HL is currently determining the overall Bearish trend of the market.
Goal - 0.8264
About Used Indicators:
For more efficient signals, super-trend is used in combination with other indicators like Pivot Points.
Disclosure: I am part of Trade Nation's Influencer program and receive a monthly fee for using their TradingView charts in my analysis.
———————————
WISH YOU ALL LUCK
