Bitcoin Btc usdt Daily analysis
Time frame daily
As you can see byc is moving up and down in the green tunnel
My last target (yellow rectangle) is touched and byc couldn't break the upper side of tunnel
Now, my target is 120.000 $ ( red rectangle)
If this time , btc can break the green uptrend line as resistance line , my next target is 145.000$,
👉👉Important notice 👈👈
Here is not suitable Time for entry the long or short position because btc is in the middle of the tunnel
P-signal

ToshiToshi usdt Daily analysis
Time frame daily
First target Risk rewards ratio >1.3
First target ~0.0006$
Second target Risk rewards ratio =6 👈👌
Second target =0.0012
Reverse head and shoulders pattern

CHFJPY: Bearish Continuation & Short Signal
CHFJPY
- Classic bearish formation
- Our team expects pullback
SUGGESTED TRADE:
Swing Trade
Short CHFJPY
Entry - 174.92
Sl - 175.54
Tp - 173.81
Our Risk - 1%
Start protection of your profits from lower levels
Disclosure: I am part of Trade Nation's Influencer program and receive a monthly fee for using their TradingView charts in my analysis.
❤️ Please, support our work with like & comment! ❤️

NZDUSD Set To Grow! BUY!
My dear followers,
This is my opinion on the NZDUSD next move:
The asset is approaching an important pivot point 0.5909
Bias - Bullish
Safe Stop Loss - 0.5885
Technical Indicators: Supper Trend generates a clearlong long signal while Pivot Point HL is currently determining the overall Bullish trend of the market.
Goal - 0.5948
About Used Indicators:
For more efficient signals, super-trend is used in combination with other indicators like Pivot Points.
Disclosure: I am part of Trade Nation's Influencer program and receive a monthly fee for using their TradingView charts in my analysis.
———————————
WISH YOU ALL LUCK

EURUSD Will Explode! BUY!
My dear friends,
Please, find my technical outlook for EURUSD below:
The instrument tests an important psychological level 1.1278
Bias - Bullish
Technical Indicators: Supper Trend gives a precise Bullish signal, while Pivot Point HL predicts price changes and potential reversals in the market.
Target - 1.1344
Recommended Stop Loss - 1.1236
About Used Indicators:
Super-trend indicator is more useful in trending markets where there are clear uptrends and downtrends in price.
Disclosure: I am part of Trade Nation's Influencer program and receive a monthly fee for using their TradingView charts in my analysis.
———————————
WISH YOU ALL LUCK

GOLD: Long Trade with Entry/SL/TP
GOLD
- Classic bullish formation
- Our team expects growth
SUGGESTED TRADE:
Swing Trade
Buy GOLD
Entry Level - 3338.10
Sl - 3330.1
Tp - 3353.0
Our Risk - 1%
Start protection of your profits from lower levels
Disclosure: I am part of Trade Nation's Influencer program and receive a monthly fee for using their TradingView charts in my analysis.
❤️ Please, support our work with like & comment! ❤️

USDCAD: Short Trading Opportunity
USDCAD
- Classic bearish pattern
- Our team expects retracement
SUGGESTED TRADE:
Swing Trade
Sell USDCAD
Entry - 1.3880
Stop - 1.3901
Take - 1.3838
Our Risk - 1%
Start protection of your profits from lower levels
Disclosure: I am part of Trade Nation's Influencer program and receive a monthly fee for using their TradingView charts in my analysis.
❤️ Please, support our work with like & comment! ❤️

GBPJPY: Short Trade Explained
GBPJPY
- Classic bearish setup
- Our team expects bearish continuation
SUGGESTED TRADE:
Swing Trade
Short GBPJPY
Entry Point - 192.93
Stop Loss - 193.56
Take Profit - 191.61
Our Risk - 1%
Start protection of your profits from lower levels
Disclosure: I am part of Trade Nation's Influencer program and receive a monthly fee for using their TradingView charts in my analysis.
❤️ Please, support our work with like & comment! ❤️

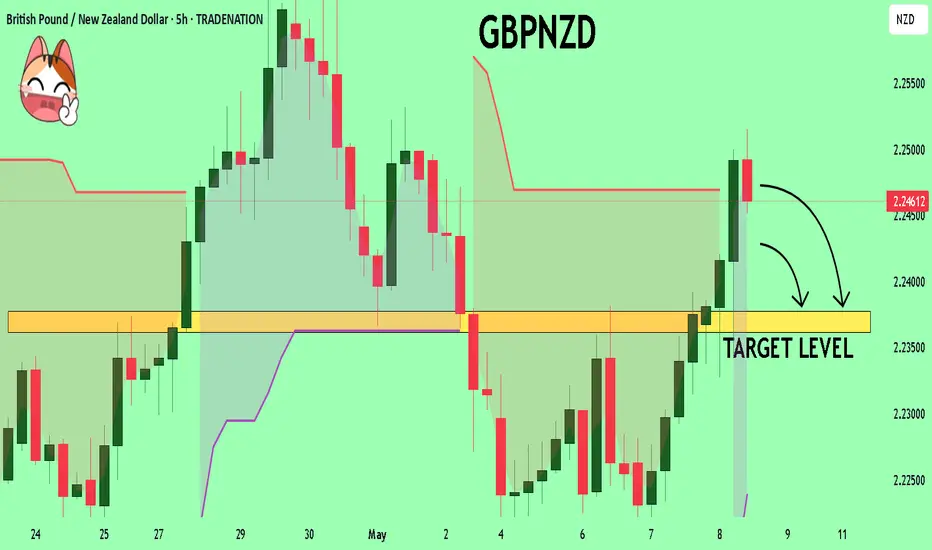
GBPNZD Trading Opportunity! SELL!
My dear followers,
I analysed this chart on GBPNZD and concluded the following:
The market is trading on 2.2456 pivot level.
Bias - Bearish
Technical Indicators: Both Super Trend & Pivot HL indicate a highly probable Bearish continuation.
Target - 2.2377
About Used Indicators:
A super-trend indicator is plotted on either above or below the closing price to signal a buy or sell. The indicator changes color, based on whether or not you should be buying. If the super-trend indicator moves below the closing price, the indicator turns green, and it signals an entry point or points to buy.
Disclosure: I am part of Trade Nation's Influencer program and receive a monthly fee for using their TradingView charts in my analysis.
———————————
WISH YOU ALL LUCK
GBPCHF What Next? SELL!
My dear friends,
GBPCHF looks like it will make a good move, and here are the details:
The market is trading on 1.1010 pivot level.
Bias - Bearish
Technical Indicators: Supper Trend generates a clear short signal while Pivot Point HL is currently determining the overall Bearish trend of the market.
Goal - 1.0983
About Used Indicators:
Pivot points are a great way to identify areas of support and resistance, but they work best when combined with other kinds of technical analysis
Disclosure: I am part of Trade Nation's Influencer program and receive a monthly fee for using their TradingView charts in my analysis.
———————————
WISH YOU ALL LUCK

GOLD The Target Is UP! BUY!
My dear followers,
I analysed this chart on GOLD and concluded the following:
The market is trading on 3358.8 pivot level.
Bias - Bullish
Technical Indicators: Both Super Trend & Pivot HL indicate a highly probable Bullish continuation.
Target - 3377.5
Safe Stop Loss - 3352.1
About Used Indicators:
A super-trend indicator is plotted on either above or below the closing price to signal a buy or sell. The indicator changes color, based on whether or not you should be buying. If the super-trend indicator moves below the closing price, the indicator turns green, and it signals an entry point or points to buy.
Disclosure: I am part of Trade Nation's Influencer program and receive a monthly fee for using their TradingView charts in my analysis.
———————————
WISH YOU ALL LUCK

MARA Holdings Options Ahead of EarningsIf you haven`t bought MARA before the recent rally:
Now analyzing the options chain and the chart patterns of MARA Holdings prior to the earnings report this week,
I would consider purchasing the 13usd strike price Calls with
an expiration date of 2025-5-30,
for a premium of approximately $1.38.
If these options prove to be profitable prior to the earnings release, I would sell at least half of them.

KODK Eastman Kodak Company Options Ahead of EarningsIf you haven`t bought KODK before the previous earnings:
Now analyzing the options chain and the chart patterns of KODK Eastman Kodak prior to the earnings report this week,
I would consider purchasing the 7.5usd strike price Calls with
an expiration date of 2026-1-16,
for a premium of approximately $0.92.
If these options prove to be profitable prior to the earnings release, I would sell at least half of them.

TTD The Trade Desk Options Ahead of EarningsIf you haven`t bought TTD before the recent rally:
Now analyzing the options chain and the chart patterns of TTD The Trade Desk prior to the earnings report this week,
I would consider purchasing the 55usd strike price Calls with
an expiration date of 2025-6-20,
for a premium of approximately $6.70.
If these options prove to be profitable prior to the earnings release, I would sell at least half of them.

NZDJPY Expected Growth! BUY!
My dear friends,
Please, find my technical outlook for NZDJPY below:
The price is coiling around a solid key level - 85.539
Bias - Bullish
Technical Indicators: Pivot Points Low anticipates a potential price reversal.
Super trend shows a clear buy, giving a perfect indicators' convergence.
Goal - 85.760
About Used Indicators:
The pivot point itself is simply the average of the high, low and closing prices from the previous trading day.
Disclosure: I am part of Trade Nation's Influencer program and receive a monthly fee for using their TradingView charts in my analysis.
———————————
WISH YOU ALL LUCK

EURJPY Technical Analysis! BUY!
My dear friends,
Please, find my technical outlook for EURJPY below:
The price is coiling around a solid key level - 162.05
Bias - Bullish
Technical Indicators: Pivot Points High anticipates a potential price reversal.
Super trend shows a clear buy, giving a perfect indicators' convergence.
Goal - 162.84
Safe Stop Loss - 161.61
About Used Indicators:
The pivot point itself is simply the average of the high, low and closing prices from the previous trading day.
Disclosure: I am part of Trade Nation's Influencer program and receive a monthly fee for using their TradingView charts in my analysis.
———————————
WISH YOU ALL LUCK

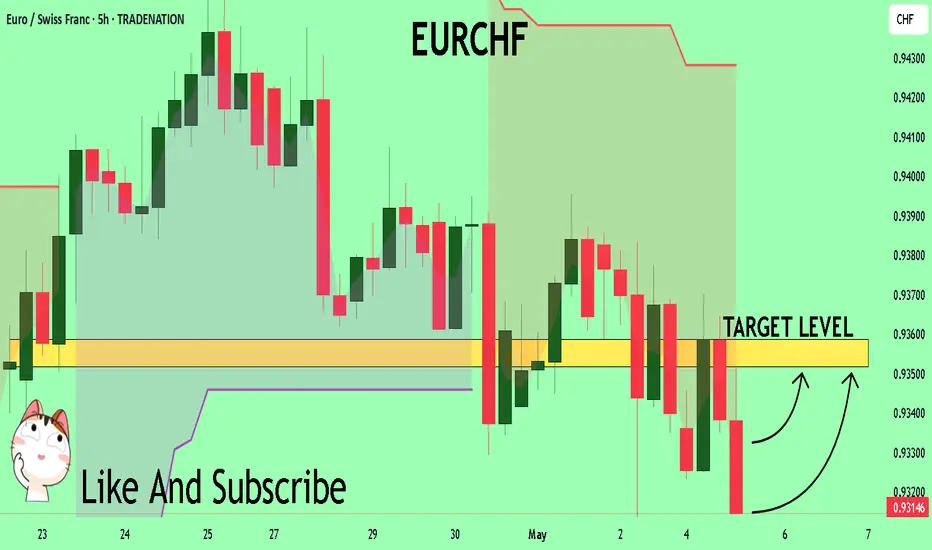
EURCHF Trading Opportunity! BUY!
My dear followers,
I analysed this chart on EURCHF and concluded the following:
The market is trading on 0.9315 pivot level.
Bias - Bullish
Technical Indicators: Both Super Trend & Pivot HL indicate a highly probable Bullish continuation.
Target - 0.9351
About Used Indicators:
A super-trend indicator is plotted on either above or below the closing price to signal a buy or sell. The indicator changes color, based on whether or not you should be buying. If the super-trend indicator moves below the closing price, the indicator turns green, and it signals an entry point or points to buy.
Disclosure: I am part of Trade Nation's Influencer program and receive a monthly fee for using their TradingView charts in my analysis.
———————————
WISH YOU ALL LUCK
EURAUD - Overall Bearish Medium-Term!Hello TradingView Family / Fellow Traders. This is Richard, also known as theSignalyst.
📈EURAUD has been overall bearish trading within the falling wedge pattern marked in red.
Moreover, the green zone is a strong structure and resistance.
🏹 Thus, the highlighted red circle is a strong area to look for sell setups as it is the intersection of the upper red trendline and resistance.
📚 As per my trading style:
As #EURAUD retests the red circle zone, I will be looking for bearish reversal setups (like a double top pattern, trendline break , and so on...)
📚 Always follow your trading plan regarding entry, risk management, and trade management.
Good luck!
All Strategies Are Good; If Managed Properly!
~Rich
Disclosure: I am part of Trade Nation's Influencer program and receive a monthly fee for using their TradingView charts in my analysis.

EURAUD - Long-Term Correction in the Making!Hello TradingView Family / Fellow Traders. This is Richard, also known as theSignalyst.
📈EURAUD has been bullish trading within the rising channel in blue.
Currently, EURAUD is retesting the upper bound of the channel.
Moreover, the $1.84 - $1.87 is a strong weekly resistance zone.
🏹 Thus, the highlighted red circle is a strong area to look for sell setups as it is the intersection of the upper blue trendline and green resistance zone.
📚 As per my trading style:
As #EURAUD is hovering around the red circle zone, I will be looking for bearish reversal setups (like a double top pattern, trendline break , and so on...)
📚 Always follow your trading plan regarding entry, risk management, and trade management.
Good luck!
All Strategies Are Good; If Managed Properly!
~Rich
Disclosure: I am part of Trade Nation's Influencer program and receive a monthly fee for using their TradingView charts in my analysis.

NZDUSD: Bearish Continuation & Short Trade
NZDUSD
- Classic bearish formation
- Our team expects fall
SUGGESTED TRADE:
Swing Trade
Sell NZDUSD
Entry Level - 0.5987
Sl - 0.6008
Tp - 0.5948
Our Risk - 1%
Start protection of your profits from lower levels
Disclosure: I am part of Trade Nation's Influencer program and receive a monthly fee for using their TradingView charts in my analysis.
❤️ Please, support our work with like & comment! ❤️

GOLD: Bullish Continuation & Long Trade
GOLD
- Classic bullish formation
- Our team expects pullback
SUGGESTED TRADE:
Swing Trade
Long GOLD
Entry - 3387.7
Sl - 3380.3
Tp - 3403.8
Our Risk - 1%
Start protection of your profits from lower levels
Disclosure: I am part of Trade Nation's Influencer program and receive a monthly fee for using their TradingView charts in my analysis.
❤️ Please, support our work with like & comment! ❤️

There's still a little more left to sip from gold’s cup
Weekly Outlook on Gold (XAUUSD)
Gold has formed a classic cup pattern on the weekly timeframe, indicating a strong bullish continuation setup. If the pattern completes successfully, we could see a move toward the top of the channel, targeting the 4039 – 4100 zone.
The recent pullback to 3208 was a retest of the previously broken daily structure, acting as a healthy correction before the next potential leg up.
For those looking to enter this move, an ideal strategy would be to place a buy stop order above the last high, as a breakout confirmation.
⚠️ Important note: If the black trendline on the daily chart (which represents the current bullish structure) gets broken to the downside, the trade setup would become invalid and a reassessment would be required.
✅ The best approach is to wait for a clean breakout above the 3495 resistance, then look for a pullback entry on lower timeframes with proper risk management.
📉 In the longer term, we still expect a potential retracement all the way back to the 2199.661 level — so be aware of the bigger picture and adapt as the structure evolves.

GBPJPY - Crazy Bullish!Hello TradingView Family / Fellow Traders. This is Richard, also known as theSignalyst.
📈GBPJPY has been overall bullish trading within the rising channel marked in blue.
Moreover, it is retesting a strong demand zone marked in green.
🏹 Thus, the highlighted blue circle is a strong area to look for buy setups as it is the intersection of demand and lower blue trendline acting as a non-horizontal support.
📚 As per my trading style:
As #GBPJPY approaches the blue circle zone, I will be looking for bullish reversal setups (like a double bottom pattern, trendline break , and so on...)
📚 Always follow your trading plan regarding entry, risk management, and trade management.
Good luck!
All Strategies Are Good; If Managed Properly!
~Rich
Disclosure: I am part of Trade Nation's Influencer program and receive a monthly fee for using their TradingView charts in my analysis.
