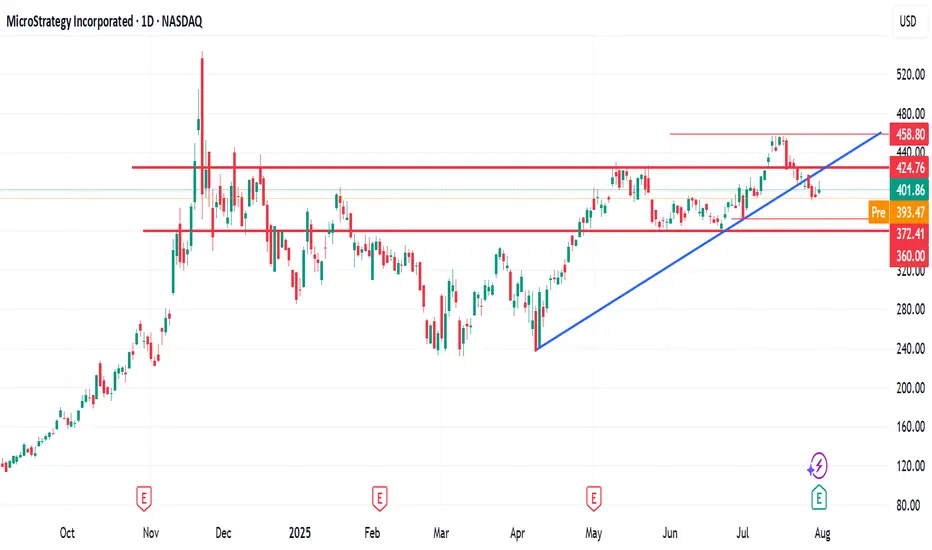
$372 - $360 is imminent$372 - $360 is imminent.
Following a break below the highlighted key support TL, MSTR fall to as low as $370 to $360
Community ideas
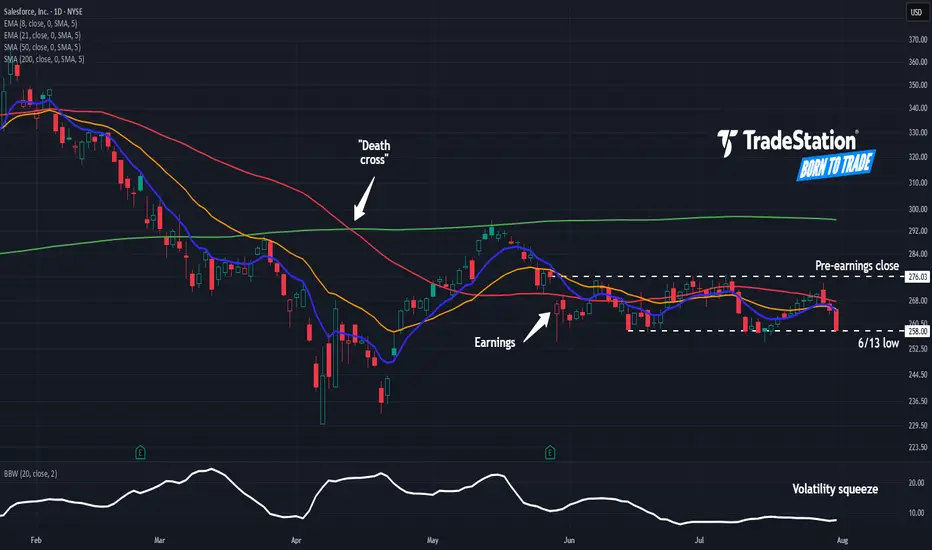
Salesforce May Face DistributionSalesforce has limped as other tech stocks hit new highs, and some traders may think it’s going into distribution.
The first pattern on today’s chart is the bearish price gap on May 29 despite better-than-expected quarterly results. That may reflect waning enthusiasm about the software company’s fundamentals.
Second is the pre-earnings closing price of $276.03. CRM has remained trapped below that level, which may suggest it’s become resistance.
Third is the June 13 low of $258. The stock bounced there in mid-July but may now be at risk of breaking it.
Next, Bollinger Bandwidth has narrowed as the stock formed a tight range between the two levels. Could price movement expand following that period of compression?
Last, the 50-day simple moving average (SMA) had a “death cross” below the 200-day SMA in April. The 8-day exponential moving average (EMA) is also below the 21-day EMA. Those patterns may be consistent with bearishness in the long and short terms.
TradeStation has, for decades, advanced the trading industry, providing access to stocks, options and futures. If you're born to trade, we could be for you. See our Overview for more.
Past performance, whether actual or indicated by historical tests of strategies, is no guarantee of future performance or success. There is a possibility that you may sustain a loss equal to or greater than your entire investment regardless of which asset class you trade (equities, options or futures); therefore, you should not invest or risk money that you cannot afford to lose. Online trading is not suitable for all investors. View the document titled Characteristics and Risks of Standardized Options at www.TradeStation.com . Before trading any asset class, customers must read the relevant risk disclosure statements on www.TradeStation.com . System access and trade placement and execution may be delayed or fail due to market volatility and volume, quote delays, system and software errors, Internet traffic, outages and other factors.
Securities and futures trading is offered to self-directed customers by TradeStation Securities, Inc., a broker-dealer registered with the Securities and Exchange Commission and a futures commission merchant licensed with the Commodity Futures Trading Commission). TradeStation Securities is a member of the Financial Industry Regulatory Authority, the National Futures Association, and a number of exchanges.
TradeStation Securities, Inc. and TradeStation Technologies, Inc. are each wholly owned subsidiaries of TradeStation Group, Inc., both operating, and providing products and services, under the TradeStation brand and trademark. When applying for, or purchasing, accounts, subscriptions, products and services, it is important that you know which company you will be dealing with. Visit www.TradeStation.com for further important information explaining what this means.
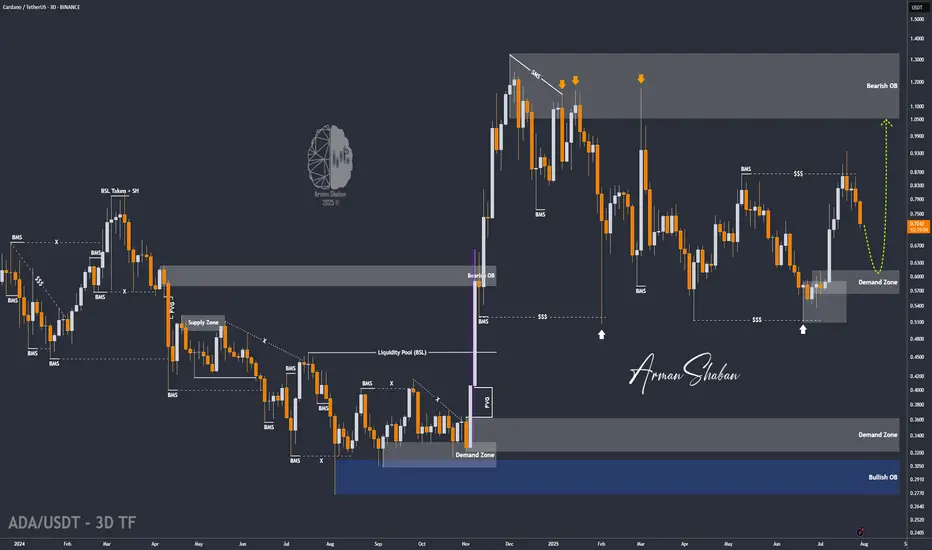
ADA/USDT | ADA Slips Below Support – Watching $0.61 for Support!By analyzing the Cardano chart on the 3-day timeframe, we can see that the price failed to hold above the $0.75 support and is currently trading around $0.72. Given the current momentum, a deeper correction for ADA seems likely. If the price fails to stabilize above $0.69, we could see a sharp drop toward the $0.61 zone. If ADA reaches this key support area, keep a close eye on it — a strong bullish reaction could lead to the next big upside move!
Please support me with your likes and comments to motivate me to share more analysis with you and share your opinion about the possible trend of this chart with me !
Best Regards , Arman Shaban
$PEPE: the big picture, 1W analysis.August 1st, 2025 – A tough day for altcoins, hit once again by tariff concerns.
But let’s talk about CRYPTOCAP:PEPE , one of my favorite altcoins to track. Why? No VC backing, the entire supply is community-held, and volume is consistently strong—making it a reliable market sentiment indicator.
Weekly Outlook:
CRYPTOCAP:PEPE remains in a macro uptrend, riding above the 100 EMA.
- My Momentum indicator has triggered two buy signals: at 0.00000634 and 0.00001040
- RSI is rising but still mid-range—there’s plenty of room to move higher.
- MACD is gradually ramping up.
- Stochastic RSI is cooling off, but given the strength of the other signals, further downside looks limited.
Technically, we’re seeing a bullish flag pattern. Price is currently testing support at the lower range—likely setting the stage for a decisive move in the coming weeks.
Conclusion:
Based on the current indicators and structure, the odds favor a bullish breakout and continuation of the uptrend—though, as always, DYOR.

USOIL Is Bearish! Short!
Please, check our technical outlook for USOIL.
Time Frame: 9h
Current Trend: Bearish
Sentiment: Overbought (based on 7-period RSI)
Forecast: Bearish
The market is approaching a significant resistance area 69.178.
Due to the fact that we see a positive bearish reaction from the underlined area, I strongly believe that sellers will manage to push the price all the way down to 66.684 level.
P.S
The term oversold refers to a condition where an asset has traded lower in price and has the potential for a price bounce.
Overbought refers to market scenarios where the instrument is traded considerably higher than its fair value. Overvaluation is caused by market sentiments when there is positive news.
Disclosure: I am part of Trade Nation's Influencer program and receive a monthly fee for using their TradingView charts in my analysis.
Like and subscribe and comment my ideas if you enjoy them!

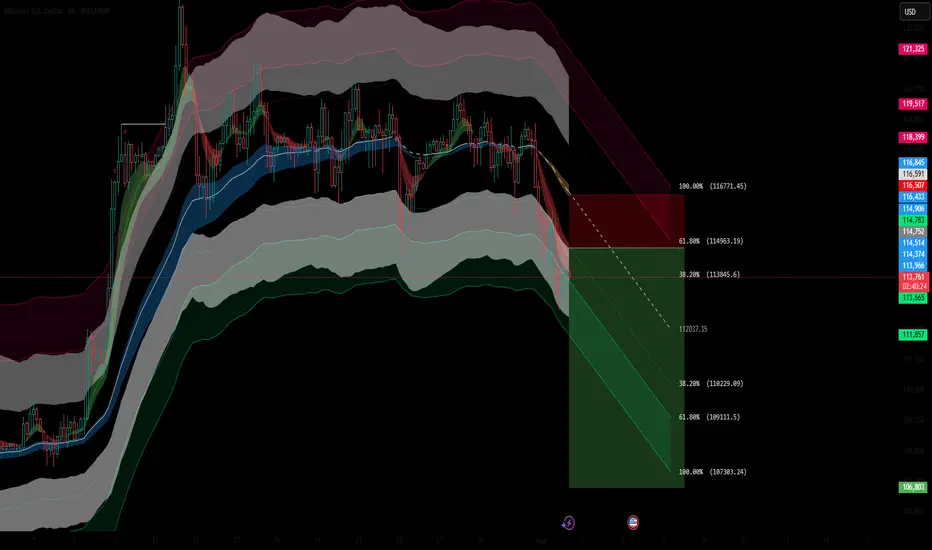
BTCUSD Short Setup – 4H Bitcoin has broken below a key dynamic support zone, and current price action signals a potential continuation to the downside. This short entry is supported by multiple technical confluences:
🔻 Bearish Confluences:
Fibonacci Retracement Rejection: Price rejected the 61.8% Fib retracement zone near $114,978, confirming a potential local top.
Trend Structure: Clear lower high, lower low structure forming on 4H – momentum favors sellers.
EMA Cloud Pressure: Price is decisively below the multi-band EMA cloud, showing sustained bearish pressure and trend bias.
Volume Profile Gap: Price is entering a low-volume node between $113.8k and $112k, increasing likelihood of a sharp move down.
Bearish Candlestick Pattern: A strong bearish engulfing candle formed after the retracement – a classic reversal confirmation.
🎯 Fibonacci-Based Targets:
TP1 – $11205 (38.2%): Initial demand zone and minor support.
TP2 – $11024 (61.8%): Mid-extension level, aligns with prior consolidation.
TP3 – $10731 (100%): Full measured move target if the downtrend accelerates.
SL: Placed just above the recent swing high at $11678, protecting against false breakouts.

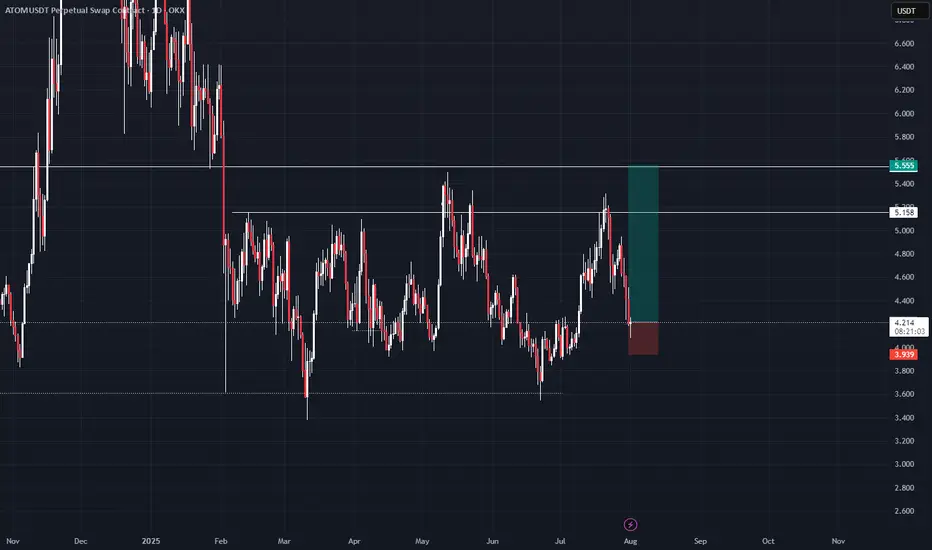
ATOMim thinking about that as a diviation from global diapozone so we have to at least test its lower boarder 5.555 that is my first target if we will return higher than 5.555 ill be looking for 11.4 as a swing target
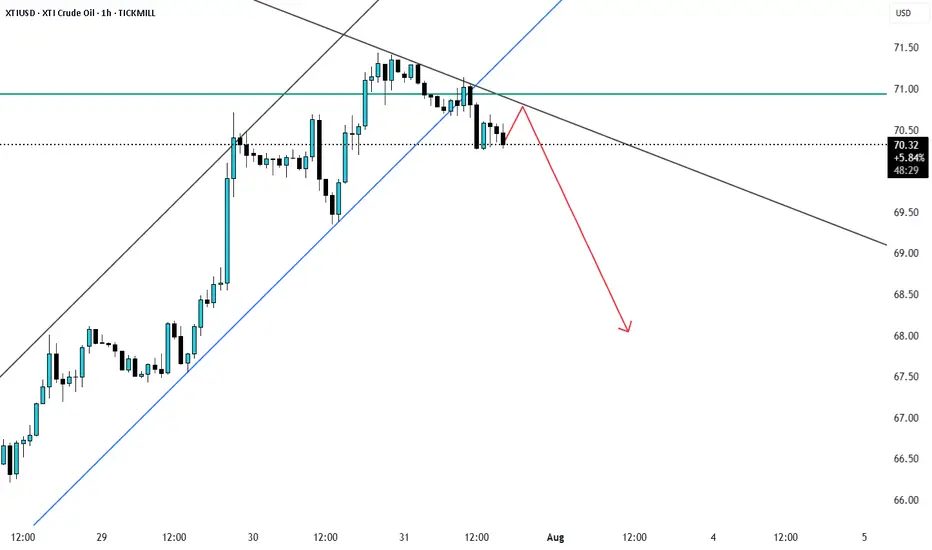
XTIUSD rejection from fib 0.5 XTIUSd recently pulled back to fib0.5 level and is currently looks to be reversering as support trendline broke and price may reject from here.
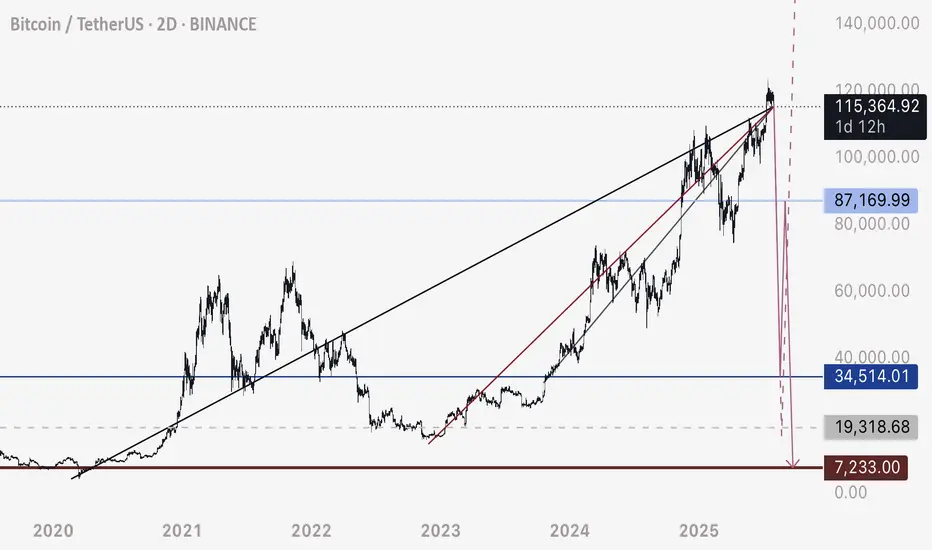
BTC - Not the End of the DropRather the beginning. Bitcoin has fallen below this bearish intersection. Anticipating price to fall rapidly on one of these two pathways to the Uber low liquidity levels.
DXY is retesting a major bearish breakdown - this is the conduit that will justify a flash crash of this magnitude prior to a 3-5 year bull run.
Happy trading.
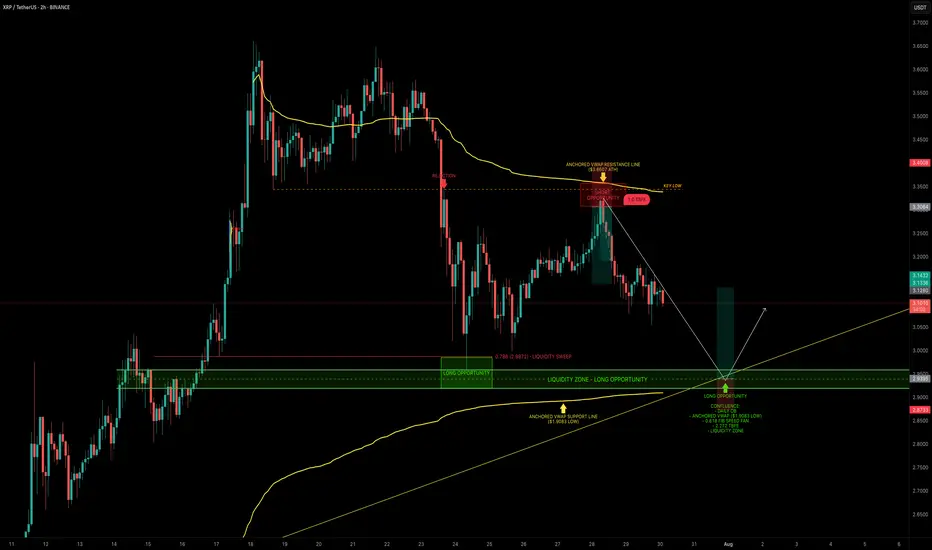
XRP — Mapping Out the Next High-Probability Long SetupXRP continues to respect key levels, delivering clean setups and strong technical reactions.
📉 Recent Price Action Recap
After the flush from $3.65 into the $3.00 support zone, XRP printed a solid bounce back toward the $3.30 resistance area, forming a clean short setup between $3.30–$3.35.
Price is now trading mid-range within the 6-day consolidation.
🟢 Next High-Probability Long Setup
A prime long opportunity lies between $2.96 and $2.9175 sitting within a key daily order block.
Confluence at this zone includes:
Liquidity pool just below the $2.9555 swing low
Anchored VWAP from the $1.9083 swing low resting just under the block
0.618 Fib Speed Fan lining up as dynamic support (July 30 – Aug 2)
2.272 Trend-Based Fib Extension at $2.9297
📈 Long Trade Setup
Entry Zone: $2.96 – $2.9175
Stop Loss: Below anchored VWAP (clear invalidation)
Target: $3.1/$3.13+
R:R: ~1:3+
💡 Educational Insight
This setup is a great example of how multiple tools layered together (like Fibonacci levels, VWAPs, order blocks and liquidity zones) can significantly increase the probability of a trade playing out.
When structure, volume-based tools and time alignment all point to the same area, it creates a high-confluence trade zone. These are the areas where risk is most defined and reward is most favourable, a principle every technical trader should anchor their strategy around.
_________________________________
💬 If you found this helpful, drop a like and comment!
Want breakdowns of other charts? Leave your requests below.
Gold non-farm payrolls are bullish, long and short positions ana
Rather than envying the fish by the river, it's better to retreat and weave your net. We often envy the wealth others can earn by investing in the gold market. We often watch them enthusiastically investing, but we ourselves are afraid to enter the market. The two major factors that drive the market, technology and news, are a topic of constant debate among investors. To navigate the market, one must master the art of attack and defense to remain rock-solid while remaining at the forefront. As the saying goes, trust me, and I will reward you with profits!
Gold Data is Bullish!
The positive non-farm payroll data sent gold soaring, with gains completely erasing all of the week's losses. Currently, gold's trend has reversed the stagnant bullish and bearish trend. After breaking through the 3300 mark and rising all the way to 3348, it shows no signs of stopping. A further test of the 3370 level is not out of the question!
Due to the strong bullish data, if you don't immediately chase longs or place a breakout long order during the first wave, you'll likely have little chance of a pullback. Therefore, you should remain aggressive in your trading strategies. We recommend a pullback to the 3332-30 level to continue the bullish trend. Upward pressure is expected at 3372-75! The market fluctuates violently, and more real-time entry and exit points are mainly based on Yulia's real-time guidance!

OM (SPOT)BINANCE:OMUSDT
#OM/ USDT
Entry range (0.2360- 0.2460)
SL 4H close below 0.02287
T1 0.32
_______________________________________________________
Golden Advices.
********************
* collect the coin slowly in the entry range.
* Please calculate your losses before the entry.
* Do not enter any trade you find it not suitable for you.
* No FOMO - No Rush , it is a long journey.

Pudgy Penguins (PENGU): Huge Volatile Movement IncomingPengu coin seems to be in a pretty dangerous zone; while we are hovering near the ATH and seeing some smaller pullback prices, we are yet to see the potential huge breakout take place or breakdown happen.
We have marked 2 zones to keep an eye on; if either of those zones is broken, a huge volatile movement will happen so be careful!
As long as we are above the Sell Zone, we are going to look for more MSB areas for smaller long scalps!
Swallow Academy

Ethereum: Smart Money Reversal After Stop Hunt?In the previous update, we warned that Ethereum might drop lower before any meaningful bounce — especially if it failed to hold the midline of the ascending channel. That scenario played out exactly as anticipated.
🟡 Price action summary:
ETH broke below the midline of the weak ascending channel, hunted the liquidity below recent lows, and tapped into the key bullish order block near $3,490 – $3,520. Price is now reacting to this zone with early signs of a reversal.
📌 Key observation:
Midlines of weak or low-momentum channels often act as liquidity traps in smart money models. Buying at these levels can be extremely risky — especially during corrective or distribution phases.
⸻
📚 Educational Note:
Never enter long positions solely at the midline of a weak ascending channel, especially when there’s a high probability of liquidity sweep below. Smart entries usually occur at order blocks formed after stop hunts.
⸻
🎯 Next steps:
Wait for confirmation (such as internal BOS or FVG closure) before entering longs. The structure suggests a potential move back toward the upper boundary of the channel if this OB holds.
⸻
🔗 Save this analysis and share it with fellow traders.
💬 Thoughts? Drop your view in the comments.

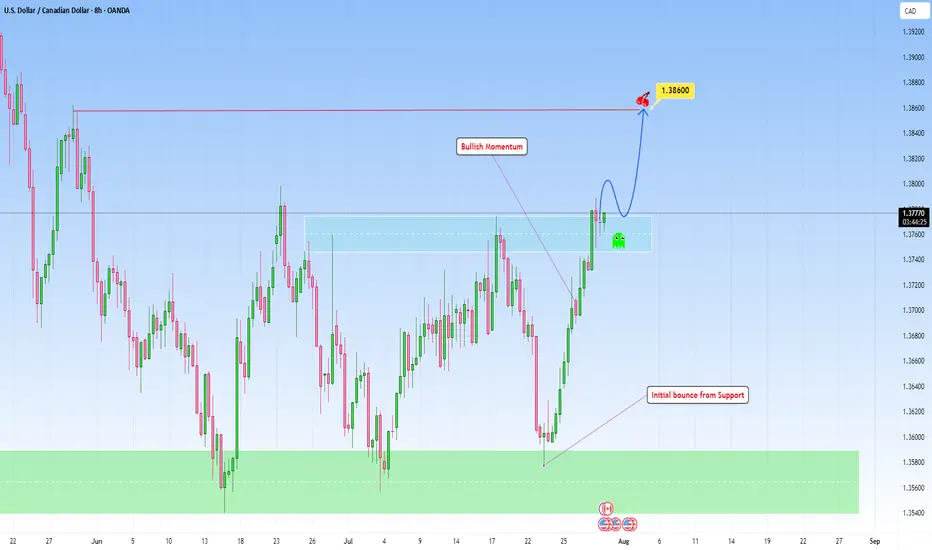
USDCAD bounced from Support and can continue higherLooking at the chart and the overall structure, I think we can favor the continuation setup with a emphasis on price action at key zones, particularly when price breaks out then can revisit this structure for a retest.
This bounce off support has been accomplished in my previous analysis:
Here, if price breaks with strength and dips back into the area and holds with bullish confirmation (likely a wick rejection or bullish engulfing on lower timeframes), that would be the cue to get in.
I am projecting the next target to 1.38600 that makes sense as a logical level for trend continuation and that I find achievable.
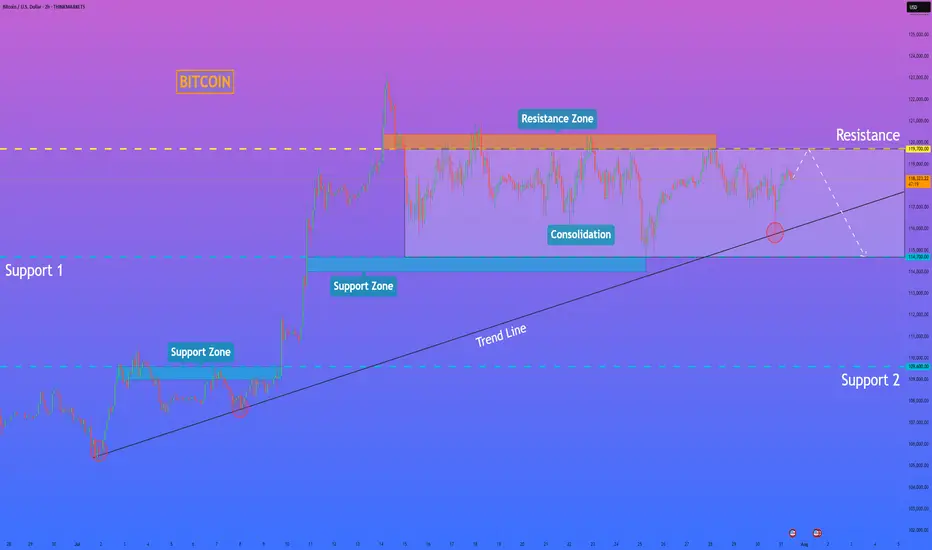
HelenP. I Bitcoin will rebound down from resistance levelHi folks today I'm prepared for you Bitcoin analytics. A technical review of the chart reveals a prolonged period of horizontal consolidation, during which the price has been trading within a well-defined range between support at 114700 and resistance near 119700. This phase of balance follows a significant prior uptrend, and a major ascending trend line is currently intersecting this range. My analysis for a short position is based on the expectation of a final 'test and fail' at the top of this consolidation. I believe the price will make one more attempt to rally towards the resistance zone around 119700. A strong rejection from this area, demonstrating sellers' control, would serve as the main confirmation for a bearish bias. Such a rejection would likely initiate a powerful downward move across the range, with sufficient momentum to break the critical ascending trend line. This would be a significant structural event, signaling a potential reversal of the larger trend. Therefore, the primary goal for this scenario is logically set at the 114700 support level, the bottom of the consolidation range. If you like my analytics you may support me with your like/comment ❤️
Disclaimer: As part of ThinkMarkets’ Influencer Program, I am sponsored to share and publish their charts in my analysis.
Is the #BTC pullback over?📊 Is the #BTC pullback over?
🧠From a structural perspective, a bearish structure has formed on both the 1-hour and 4-hour charts, so we should be wary of the risk of a further pullback.
➡️Resistance is the area formed by the two necklines (114675-115729).
Support is primarily the overlap between the yellow and green areas (110000-111688). If we can establish a bullish structure on the 1-hour chart here, we still have a chance of continuing the bullish trend.
🤜If you like my analysis, please like 💖 and share 💬 BITGET:BTCUSDT.P

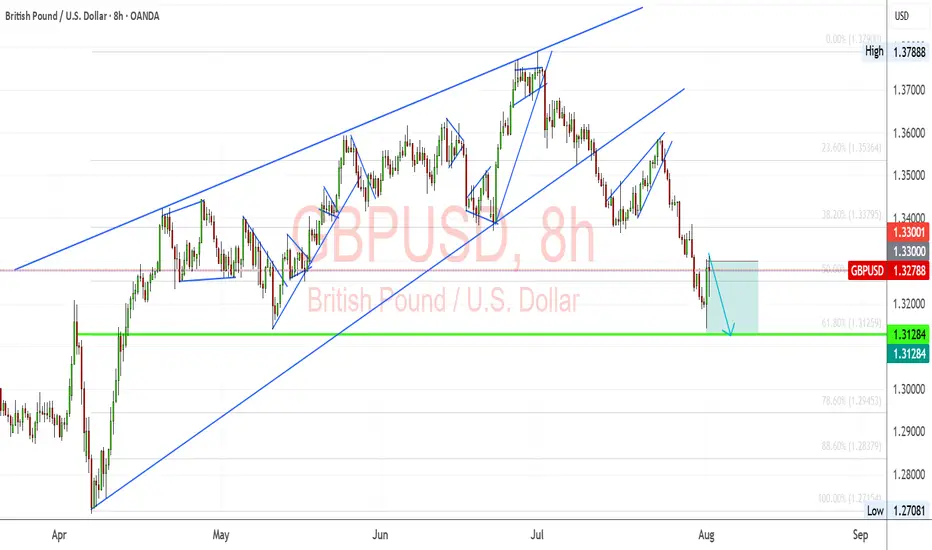
GBPUSD: Bearish Momentum vs. Fundamental Repricing – Key LevelsGBPUSD is at a critical juncture, balancing a clear technical breakdown with a fundamental backdrop favoring near-term volatility. The pair has slipped from its rising wedge structure and is now testing key retracement zones while markets reprice expectations for Fed rate cuts after weak US jobs data. Traders are closely watching whether this bearish momentum will extend toward the 1.3128 support or if a rebound from oversold conditions could trigger a corrective bounce.
Technical Analysis (8H Chart)
Pattern: Clear breakdown from a rising wedge, confirming bearish bias.
Current Level: Price sits near 1.3278, struggling to reclaim the 1.3300 resistance zone.
Key Support Zones:
1.3128 (61.8% Fibonacci retracement) – main bearish target.
1.2945 (78.6% retracement) – extended downside target if selling pressure deepens.
Resistance Levels:
1.3300 (immediate resistance, prior support now flipped).
1.3380 (secondary resistance if a retracement rally occurs).
Projection: Likely bearish continuation toward 1.3128, with a potential retest of 1.3300 before continuation.
Fundamental Analysis
Bias: Bearish in the short term, but Fed policy and risk sentiment remain key drivers.
Key Fundamentals:
USD: Weak NFP (73K), higher unemployment (4.2%), and downward revisions boost Fed cut bets (~75% for September), typically a USD-negative factor.
GBP: BOE maintains a cautious stance due to sticky inflation but lacks clear hawkish conviction as growth slows.
Tariffs: US tariffs add a mild negative weight on GBP trade sentiment.
Risks:
Hot US CPI could slow Fed cut bets, supporting USD.
Hawkish BOE comments could limit GBP downside.
Global risk sentiment shifts could either favor USD (risk-off) or weaken it further (risk-on).
Key Events:
US CPI and PPI for USD direction.
BOE policy updates and UK CPI.
US jobless claims and Fed commentary.
Leader/Lagger Dynamics
GBP/USD is a lagger, mainly reacting to USD shifts. However, its moves directly influence GBP crosses such as GBP/JPY and GBP/CHF.
Summary: Bias and Watchpoints
GBP/USD remains in a bearish phase, targeting 1.3128 with a potential corrective bounce toward 1.3300 first. The primary driver is the technical breakdown, while fundamentals add volatility around US CPI and BOE policy. If CPI surprises lower, the bearish outlook could reverse into a short-term rebound; if CPI is hot, downside momentum could extend. You should monitor USD-driven events closely as GBP/USD sets the tone for broader GBP movements.
Let's buy BTCUSD on correction!I found interesting opportunity in BTCUSD right now.
It has been moving in consolidation channel after recorded its all time high.
Based on Elliot Wave count, the price right now is making it's wave 4.
The next possible target is 120-125k.
CHEEEERRRSSS..!!!

GBPCHF RETAINS BEARISH MOMENTUMInstitutional (COT) data shows a net reduction in GBP exposure, suggesting big money is pulling out of the pound. Retail sentiment also leans heavily against the trend, with traders buying the dip — another contrarian bearish signal. Seasonality does not favor the pair in August either, with historic trends leaning against GBP performance this time of year.
On the macro side, UK economic data continues to weaken. Both manufacturing and services PMI are deteriorating, indicating contraction across sectors.
Retail sales and GDP growth are negative, while inflationary pressure is easing — all of which reduces the urgency for further BOE tightening. Employment metrics are also weak, with poor job creation and falling labor market momentum.
Meanwhile, Switzerland is showing relative macro strength. The SNB is benefiting from stable inflation and its traditional safe-haven appeal, which is further boosted by rising global risk-off sentiment. Interest rate expectations are neutral for CHF but increasingly dovish for the UK, creating clear policy divergence in CHF’s favor.

Gold Surges on Non-Farm Data; 3330 Key Next WeekGold was strongly boosted by the significantly bullish non-farm payroll data, surging sharply like a rocket 🚀, with gains that completely "wiped out" all the weekly losses. The current gold trend, as if injected with super momentum, has completely broken the previous long-short stalemate. Starting from the 3300 level, it has been breaking through obstacles all the way up to 3350. At present, 3330 is like a critical "battleground" ⚔️ fiercely contested by both long and short sides.
This week, when gold was still "lingering" below 3300, I emphasized repeatedly that a rebound was inevitable – we just needed to stay calm and wait for the opportunity. As it turns out, our judgment was spot on, and we successfully took profits around 3340, reaping good gains 💴. Now, gold prices are oscillating back and forth in the 3340-3350 range. Based on a comprehensive analysis of the current trend, I boldly predict that gold is likely to pull back to around 3330 next week, so everyone can prepare in advance 🤗
⚡️⚡️⚡️ XAUUSD ⚡️⚡️⚡️
🚀 Sell@ 3350
🚀 TP 3330 - 3320 - 3310
🚀 Buy@ 3300 -3310
🚀 TP 3320 - 3330 - 3340
Daily updates bring you precise trading signals 📊 When you hit a snag in trading, these signals stand as your trustworthy compass 🧭 Don’t hesitate to take a look—sincerely hoping they’ll be a huge help to you 🌟 👇

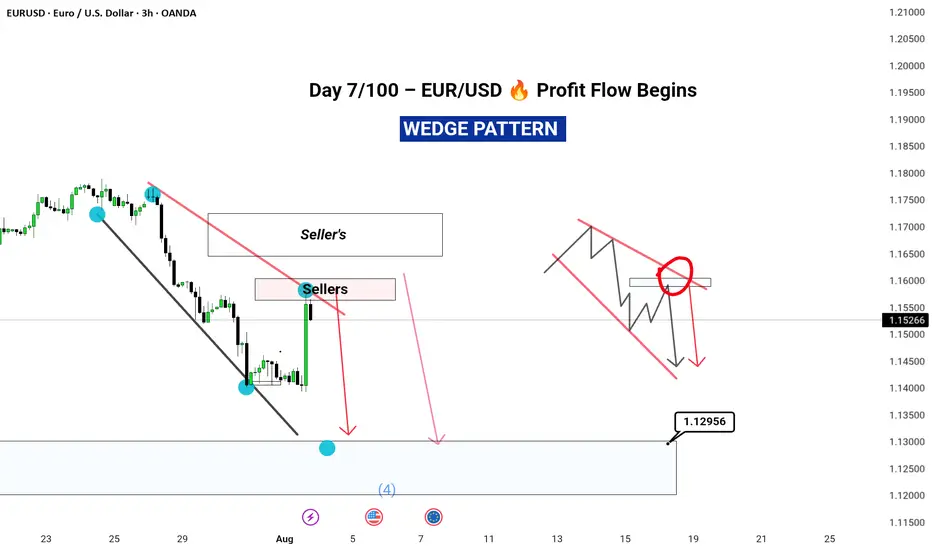
“Exactly What I Saw” promises value and transparency.
In today's analysis, I’ve identified a clear completion of Wave D, securing a 3% ROI across just two trades – all before the move unfolded.
🔍 What’s inside this breakdown?
• Multi-timeframe analysis: Weekly ➝ Daily ➝ 4H ➝ 1H
• Elliott Wave structure with confluence zones
• Trade psychology at key turning points
• Exact entry & exit insights explained
• Risk management for consistent returns
---
⚡ Highlights:
Precise reversal spotted before it was obvious
No indicator clutter – just clean, confident price action
Part of my 100-day breakdown series: real, raw, and repeatable setups
---
👣 Day 7 of 100 is just the beginning.
Tap Follow to stay ahead of the market – one wave at a time.
#EURUSD #ForexAnalysis #ElliottWave #Forex #TradingViewUK #SwingTrading #PriceAction #RiskReward #FXMindset #ForexTradersIndia #ForexEducation