Gold non-farm payrolls are bullish, long and short positions ana
Rather than envying the fish by the river, it's better to retreat and weave your net. We often envy the wealth others can earn by investing in the gold market. We often watch them enthusiastically investing, but we ourselves are afraid to enter the market. The two major factors that drive the market, technology and news, are a topic of constant debate among investors. To navigate the market, one must master the art of attack and defense to remain rock-solid while remaining at the forefront. As the saying goes, trust me, and I will reward you with profits!
Gold Data is Bullish!
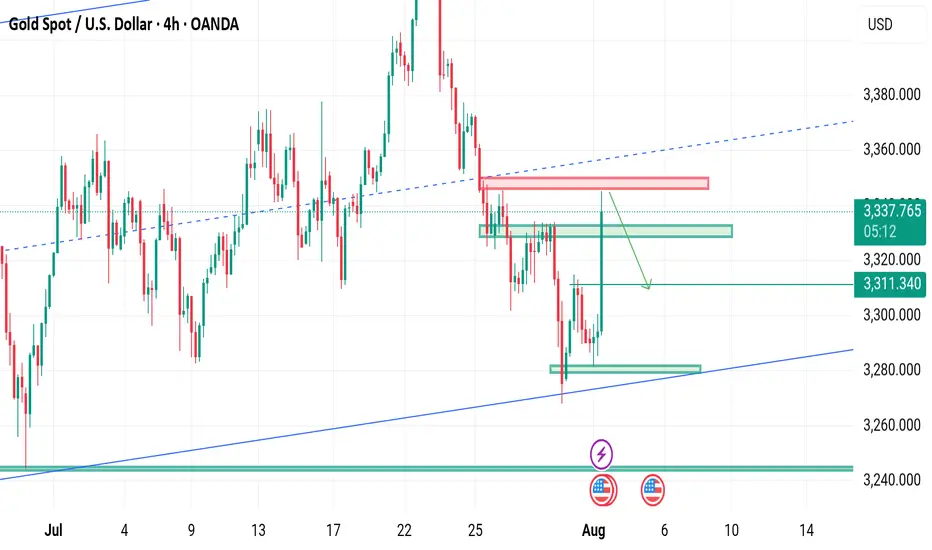
The positive non-farm payroll data sent gold soaring, with gains completely erasing all of the week's losses. Currently, gold's trend has reversed the stagnant bullish and bearish trend. After breaking through the 3300 mark and rising all the way to 3348, it shows no signs of stopping. A further test of the 3370 level is not out of the question!
Due to the strong bullish data, if you don't immediately chase longs or place a breakout long order during the first wave, you'll likely have little chance of a pullback. Therefore, you should remain aggressive in your trading strategies. We recommend a pullback to the 3332-30 level to continue the bullish trend. Upward pressure is expected at 3372-75! The market fluctuates violently, and more real-time entry and exit points are mainly based on Yulia's real-time guidance!
Community ideas

GOLD OUTLOOKMy view on Gold ..
More likely to retrace to the bearish PRZ from where i'll be looking for Sell setup on the lower time frames

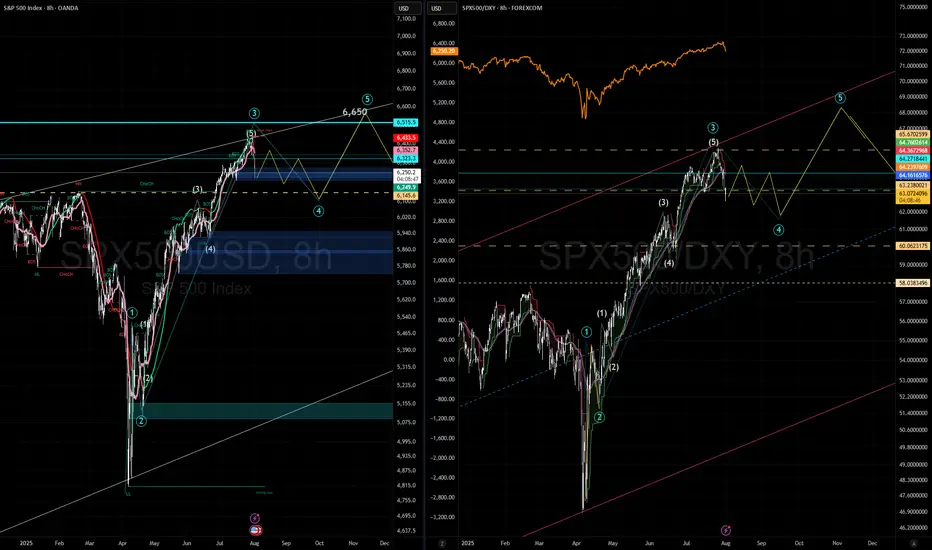
SPX range bound unit September expirationExpect sideways wave 4 to last 4 weeks, volatility, (small positions: sell up, buy dips or do NPOTHING and hold. Basically these types of Wave-4 are where traders loose money from Wave-3.
NATF – SECOND STRIKE | 01 AUGUST 2025 NATF – SECOND STRIKE | 01 AUGUST 2025
The stock is standing in an upward channel (marked light blue) and recently hit a high of Rs. 383. A healthy pullback followed, consolidating near the axis line, and briefly dipped below it as a spring. Today’s strong rebound confirms the pullback is likely over, signaling a second strike opportunity for continuation towards higher quantified targets.

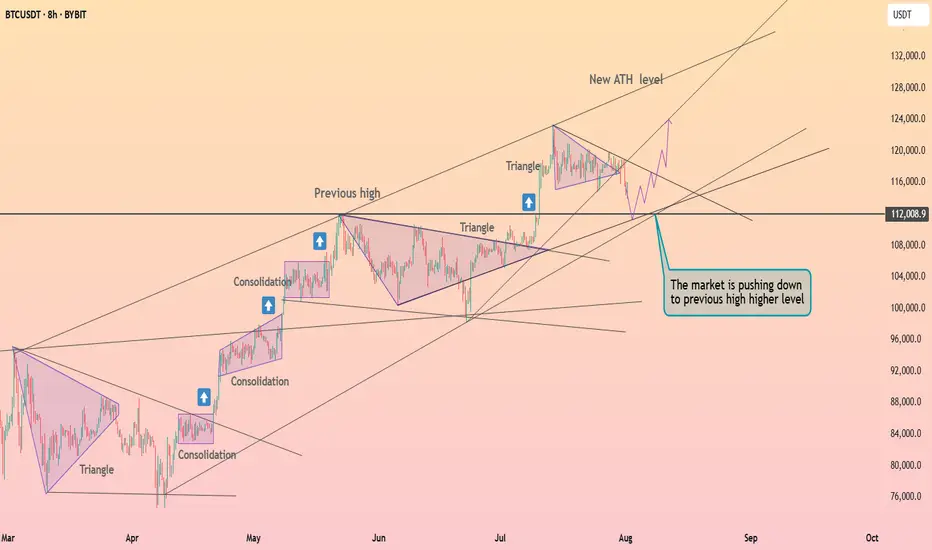
Bitcoin exited from the triangle ┆ HolderStatBINANCE:BTCUSDT is dipping to retest $112,000, the last breakout level. The price remains inside a large ascending triangle and may soon resume its uptrend. If this support holds, targets above $125,000 come back into play.
More slowly.Another chart about how it's pointless to look at a situation using 4 H, 1 D, or even 1 W.
What are you guys talking about?
When will this monthly divergence finally materialize?
Wait, wait and wait.

10 POWERFUL INVESTING & TRADING QUOTES OF ALL TIME
Here are powerful quotes of professional traders, investors and experts in financial markets.
Let their words inspire you and help you in your trading journey.
"To succeed in the market, you must learn to think like everyone else and do the opposite." - Sir John Templeton 📈💭💡
"The four most dangerous words in investing are: 'This time it's different.'" - Sir John Templeton ⏳📉🛑
"The more you learn, the more you earn." - Warren Buffett 📚💰📈
"The key to trading success is emotional discipline. If intelligence were the key, there would be a lot more people making money." - Victor Sperandeo. 💪💰🚫🧠
"Investing is not about making predictions, it's about having a plan and sticking to it." - Tony Robbins 📊🔄📌
"The best time to buy a stock is when the blood is running in the streets." - Baron Rothschild 💀🔪💰
"The best investment you can make is in yourself." - Warren Buffett 💼💡💰
"The stock market is not a casino; it's a crooked casino." - Charlie Munger 🎰🎲🏛️
"Losses are part of the game. You can't win every trade." - Martin Schwartz. 📉😔💔
"The fundamental law of investing is the uncertainty of the future." - Peter Bernstein. ⚖️❓🔮
The More I trade, the more I realize how precise and meaningful are these phrases. Take them seriously, and they will help you achieve the financial success.
❤️Please, support my work with like, thank you!❤️
I am part of Trade Nation's Influencer program and receive a monthly fee for using their TradingView charts in my analysis.
SOL 1H – Bounce From Demand, Can It Reclaim the Breakdown Zone?SOL tapped into the key demand zone near $157 and is now showing signs of a reaction bounce. Price is approaching the former support-turned-resistance zone around $184 — a critical level that marked the start of the previous breakdown.
A reclaim of that zone would suggest bulls are regaining control, opening up room toward the $190–$200 region. Until then, it remains a lower high attempt inside a bearish structure.
📌 Demand bounce
📌 Bearish market structure
📌 Key resistance at ~$184
No confirmed reversal yet — just a bounce until proven otherwise. Keep watching the structure evolve.

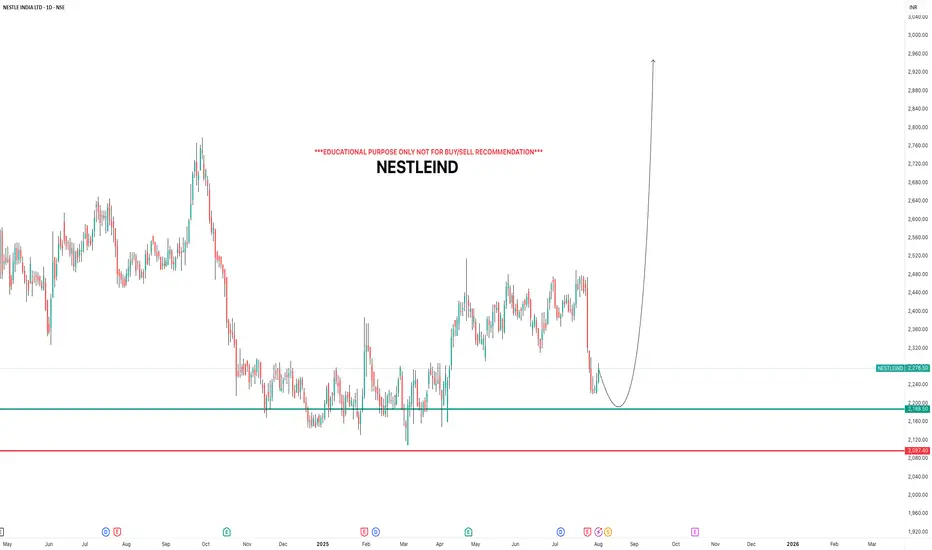
NESTLEINDIAi Observed these Levels based on Price Action and Demand & Supply which is my own Concept "PENDAM CONCEPTS"... Please don't take any trades based on this chart/post... Because this chart is for educational purpose only not for Buy or Sell Recommendation... Thank Q
DXYBack to the initial direction which is bullish momentum acoording to cot report. And I'm expectiong more continuation till maket close of before

SUPER BUY GOLD XAUUSD Gold has ripped all levels of take profit and has gone up and gave us a small amount of drawdown with huge gains in return, simple trading price action and (M&Ws)

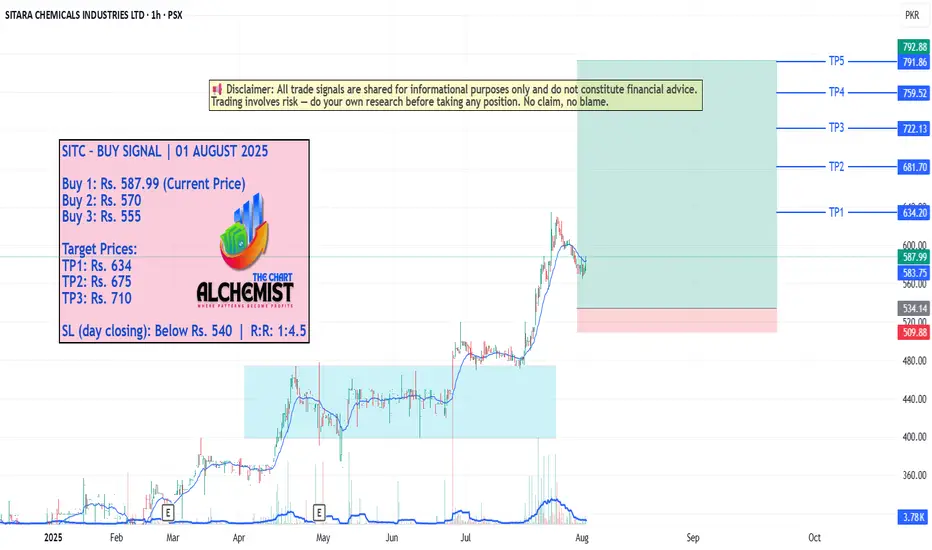
SITC – BUY SIGNAL | 01 AUGUST 2025 SITC – BUY SIGNAL | 01 AUGUST 2025
The stock previously broke out of a trading range (marked light blue channel) and marked a high of Rs. 634. After a shallow pullback to Rs. 478, it spiked upwards again, creating multiple bullish structures. Recently, it rebounded from a key bullish structure and is now entering a new upward leg with good momentum. Quantified displacement targets lie ahead.
HTL – BUY SIGNAL (3rd strike) | 01 AUGUST 2025 HTL – BUY SIGNAL (3rd strike)) | 01 AUGUST 2025
The stock previously made a high of Rs. 63.20 and entered a pullback (marked light pink), which ended at a major support level (marked dark blue). After breaking out of this pullback, HTL began a new uptrend leg. Although it recently dipped below the light blue uptrend channel, the move appears to be a spring before an excess line (marked black), indicating potential for a strong upward reversal.

GBPUSD BUYBUY @1.31532
SL @1.31427
TP @1.32057
If SL hits by a candle sweep and closed above the entry level again buy....
And always risk 1%

EURUSD - correction ahead of timeWell, well - EUR used the NFP data to start the correction ahead of time. It used the FR 161.8 of the recent correction as support. And it did it in a impressive time...
Now we are heading into Resistance cluster created by the April High and July Low (as wee and FR 38.8 of the whole movement form the July High. Yet the upper level of the cluster is created by the FR 61.8 of the recent impulse, and 1:1 with the recent correction and June High. The second one seems to me as stronger and more probably. However, price may be in hurry again and complete the correction ahead of time... Again.
Just my humble opinion...

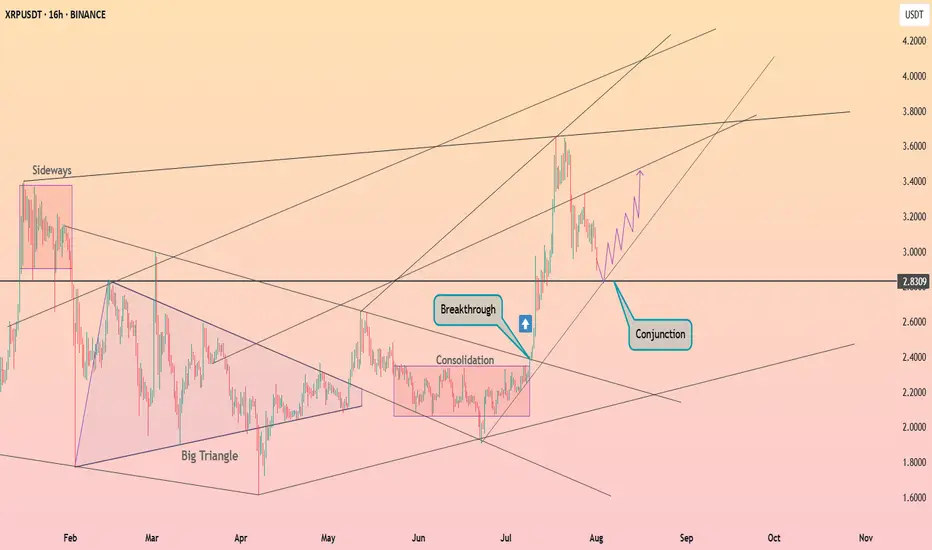
XRP continues to pullback ┆ HolderStatBINANCE:XRPUSDT surged above $2.83 after consolidating in a tight range. Price is now retesting the breakout zone at a key structural conjunction. If the level holds, a renewed move toward $3.40 may follow as bulls reclaim control.
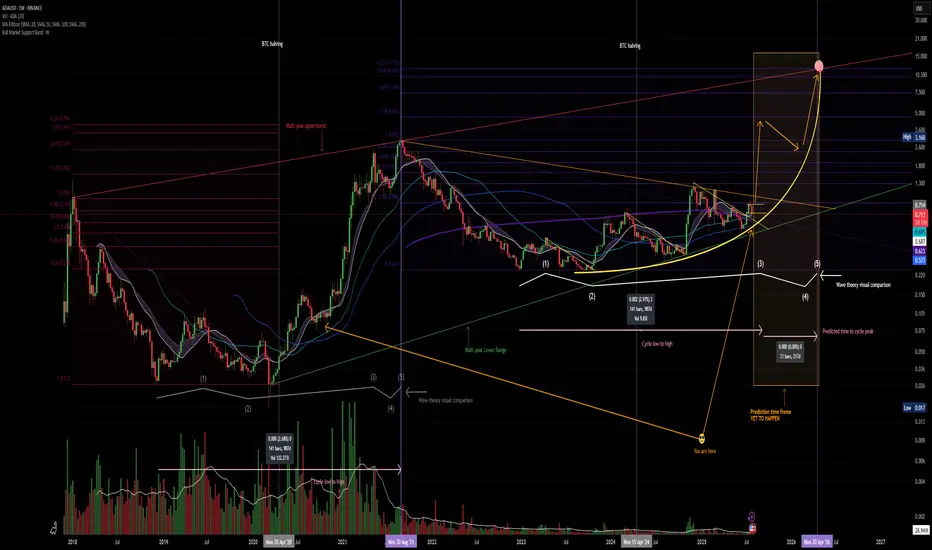
Panic sets in. but its all goodThe crypto market has experienced a strong panic driven correction as the FED refuses to cut rates and inflation is on the rise while wages are slowly in decline.
CRYPTOCAP:ADA continues to provide thrills and chills
Is it time to dump? and cry into your empty wallet?
IMO NO, CRYPTOCAP:BTC has recently taken out liquidity below the $117,000.00 price point which is a normal move, if you are over leveraged it can feel horrible but I assess as a normal correction.
CRYPTOCAP:ADA price remains in the range in which it has formed .93 - .71 the possibility that CRYPTOCAP:ADA can dip deeper to .65 is possible but unlikely. This correction provides a cooling off of MACD and RSI on higher timeframes and the chart still remains BULLISH.
Remember be greedy when others are fearful.
A man who says he never had a chance never took a chance!
Novo Nordisk, generational buying opportunity? Novo Nordisk is currently experiencing one of the largest drawdowns in its history, primarily triggered by a downward revision of guidance for FY25 and FY26.
Focusing strictly on technical analysis:
For the first time, the monthly 200 EMA is serving as a key support level for Novo Nordisk - an area the stock has never approached in its previous history.
The long-term trendline, originating in 1989 and successfully tested three times since 1995, remains intact and is being approached once again.
Both support levels - the monthly 200 EMA and the long-term trendline from 1989 - are now converging in the same price area.
In addition, the latest twelve months (LTM) P/E has compressed to 13.8x, representing its lowest multiple in over two decades.
In the context of a highly valued broader market, Novo Nordisk is now trading at what can be considered a fair level from a purely technical perspective.

Short!Hello all. after reversing from an LOZ it is time to a Node. be happy and have a wealthy day.(wink)

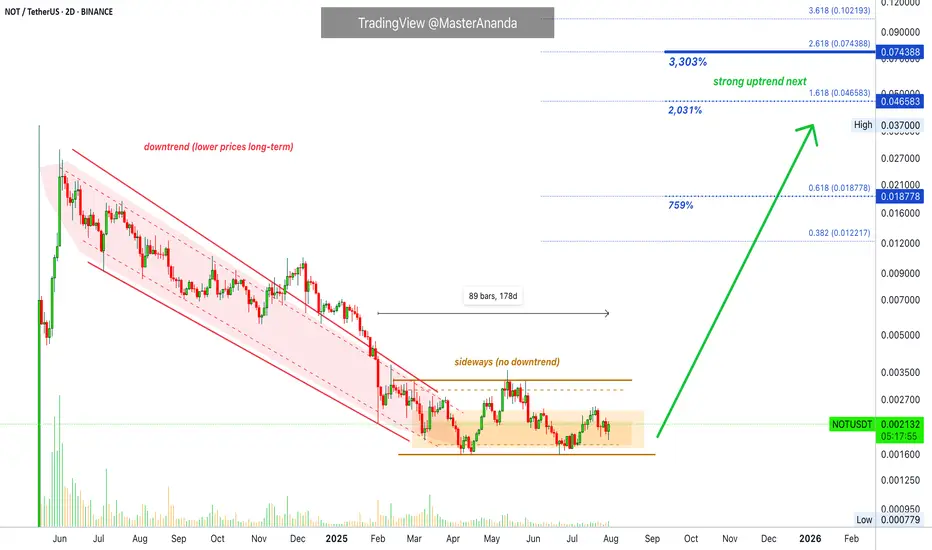
Notcoin · Last Call, Last Chance · Friendly ReminderWe looked at Notcoin recently and this is the last time you will see a publication at these low prices. In the next Notcoin update the price will be at least 100% higher and growing, we will be in the middle of a full blown bullish wave.
Right now Notcoin is still trading at the lower end of a downtrend. The downtrend ended and the market went sideways. Sideways is what we have now. The accumulation phase and zone where whales, smart trader and experts buy the most. The obvious reason being because it is always better to buy when prices are low.
4-8X. We are going with 6X for this one but the choice is yours.
Notcoin can grow anywhere between 1,000% and 3,000% in the coming months. I will aim for the higher targets just because I know this bull market will be very strong based on the charts and the early action we are getting. We are still at bottom prices marketwide and yet some pairs are already trading at new all-time highs. It means that this bull market will be big, bigger than usual and bigger than anything you can expect or imagine.
The strategy is to buy and hold. Spot. If you are leverage, then you need to decide on your risk, at this point, 2-3X is safe. Anything higher and you are opening yourself to a risky situation. Higher would imply higher profits potential, but would you risk everything for just a potential? Better play it safe while aiming big. If the pair can grow 30X in the coming months, leverage might not be the best choice.
Some people do both. What is your trading style? What are your trading goals?
Spot or leverage, low or high risk, we are going up. We had plenty of time to buy, plenty of warnings and plenty of opportunities. The market will wait no more. Prepare for the start of a mega bull run.
Thanks a lot for your continued support.
Namaste.
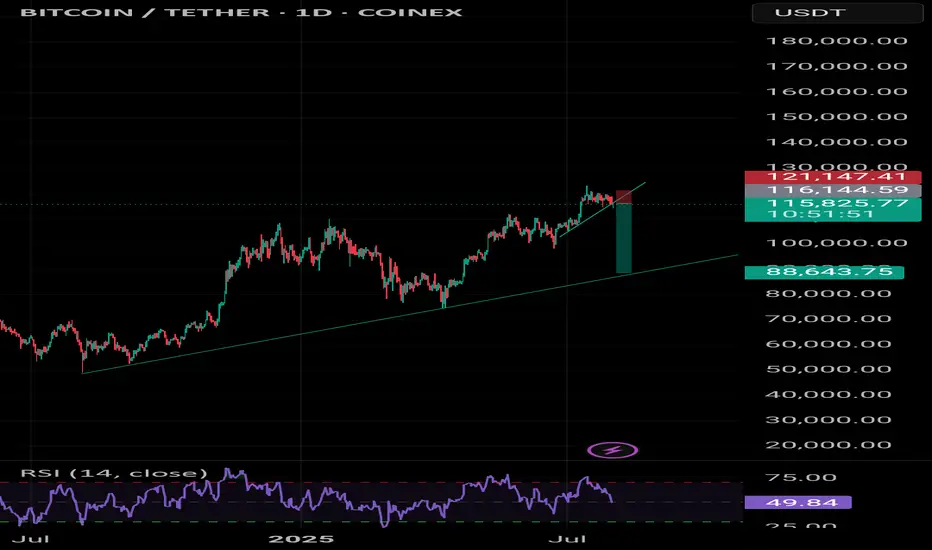
Bitcoin Go 89kBe prepared for a market correction. BIT has a negative divergence on the weekly timeframe.
LULU into supportLulu is on sale as its just come into an area it has only sold at, 3 other times out of the past 5 years. As you can see by the Orange line, LULU has been holding this area of support for the past 5 years. This is a great buying opportunity. A close below the line on a weekly basis would stop out of the trade

Selling activated ▪️I'm expecting selling at 3345-3348 from my zones although I took a small risk of sell at 3342
And my Targets will be 3333-3324
▪️Secondly if H4 candle closing below 3250 I will not sell till next stability
This trade is based on liquidity sweeps
#XAUUSD