Silver Remains a Buy on DipsIt seems the precious metals market didn’t mourn the Fed’s decision and subsequent press release for long.
The uptrend remains intact, and the previously supportive factors are still in play.
Even amid the negative news, there was no sharp sell-off — everything stayed within the trend. This clearly signals that rate cuts are on the horizon, and metals are likely to continue their upward move.
We only trade from the long side — nothing has changed.
At the moment, we've seen a pullback, and it feels strange not to take advantage of it and add more silver to the portfolio.
Stop-loss is set below yesterday’s candle low at 36.15.
We’ll see how the position develops. For now, the idea is to hold as long as the stop-loss holds. The long-term target is 48. Obviously, we won't reach it quickly, so I’ll trail the stop as the trade progresses — first to breakeven, and eventually into profit.
Community ideas

DAILY SCALPING PLAN | CLINTON SMC STYLE✅ XAU/USD - DAILY SCALPING PLAN | CLINTON SMC STYLE
📆 Date: August 1st, 2025
📍 Strategy: Smart Money Concepts (SMC)
🔑 Focus: Liquidity Sweep | Order Block | BOS | Premium/Discount Model
🔍 Market Overview
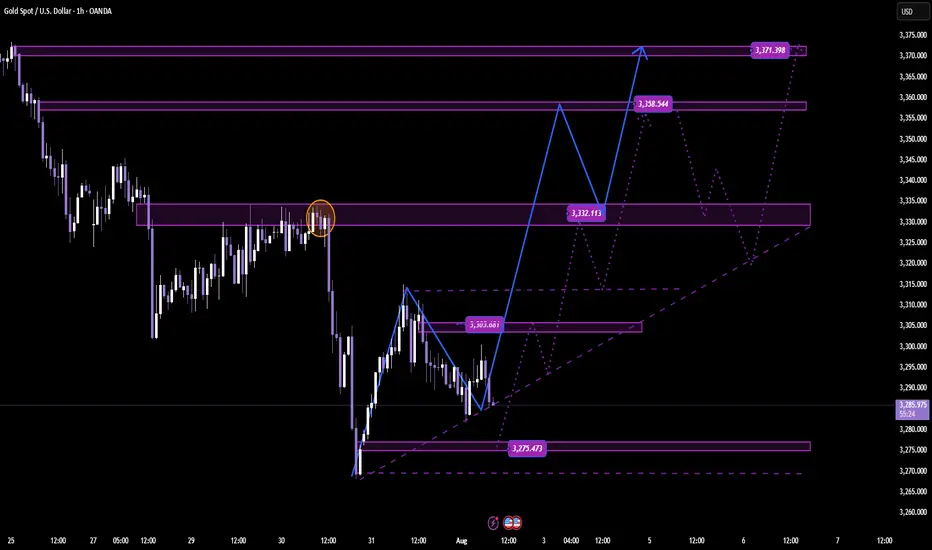
Gold (XAU/USD) is currently in a manipulation phase after a strong move down from a premium supply zone. The market has swept key liquidity and is preparing for a high-probability move in both directions based on Smart Money footprints.
Current structure suggests:
Bullish intent forming from a discount demand zone.
Liquidity resting above recent highs – perfect for short-term scalps and intraday swings.
🟢 BUY SETUP – DISCOUNT DEMAND REACTION
🎯 Entry: 3275
🛡️ Stop Loss: 3268
🎯 Take Profits:
TP1: 3285
TP2: 3295
TP3: 3305
TP4: 3315
TP5: 3325
TP6: 3335
Reasoning:
This is a clean bullish OB resting beneath a CHoCH and BOS zone. Price may wick into this area as Smart Money reloads after sweeping early long positions. If held, expect sharp upside expansion toward previous liquidity highs.
🔴 SELL SETUP – PREMIUM SUPPLY REJECTION
🎯 Entry: 3356
🛡️ Stop Loss: 3362
🎯 Take Profits:
TP1: 3350
TP2: 3345
TP3: 3340
TP4: 3330
TP5: 3320
Reasoning:
This level is a key supply block where price previously distributed. If price expands into this zone, it’s likely to act as a liquidity magnet for Smart Money to offload longs and enter short-term shorts. Expect reaction.
🧠 SMC Insights
Internal BOS & CHoCH signal early signs of accumulation.
Price respects the premium vs. discount framework with clear liquidity targets.
SMC traders understand that price doesn’t move randomly – it targets liquidity, mitigates OBs, and respects structure.
🔔 Note:
Always wait for clear confirmation (rejection wick, engulfing pattern, or M15 structure shift) before execution. Entries without confirmation are riskier in current volatility.
📌 Follow @ClintonScalper for daily SMC scalping plans & deep institutional insight.
🔁 Like, comment & share if you find this helpful!
GOLD Bullish Today , Long Scalping Entry Valid To Get 150 Pips !Here is My 15 Mins Gold Chart , and here is my opinion , we finally above 3296.00 and we have a 30 Mins Candle closure above it , so i`m waiting the price to go back and retest this res and new support and give me a good bullish price action to can enter a buy trade and we can targeting 100 to 150 pips .
Reasons To Enter :
1- New Support Created
2- Bullish Price Action
3- Bigger T.F Giving Good Bullish P.A .

XAUUSD Possibility of a small correction towards 3330, re-entering the bearish phase and moving towards the specified targets

XAUUSD Analysis todayHello traders, this is a complete multiple timeframe analysis of this pair. We see could find significant trading opportunities as per analysis upon price action confirmation we may take this trade. Smash the like button if you find value in this analysis and drop a comment if you have any questions or let me know which pair to cover in my next analysis.

BTC | Short Bias — Targeting $113kPrice rejected perfectly off the 0.5 retracement and is now filling the previous imbalance.
Yesterday's daily close was decisively bearish, confirming downside momentum.
There’s a lack of convincing reversal signals at current levels.
Plan:
Main expectation is continued downside toward the $113k support.
Not interested in longs until price stabilizes at or below that level.

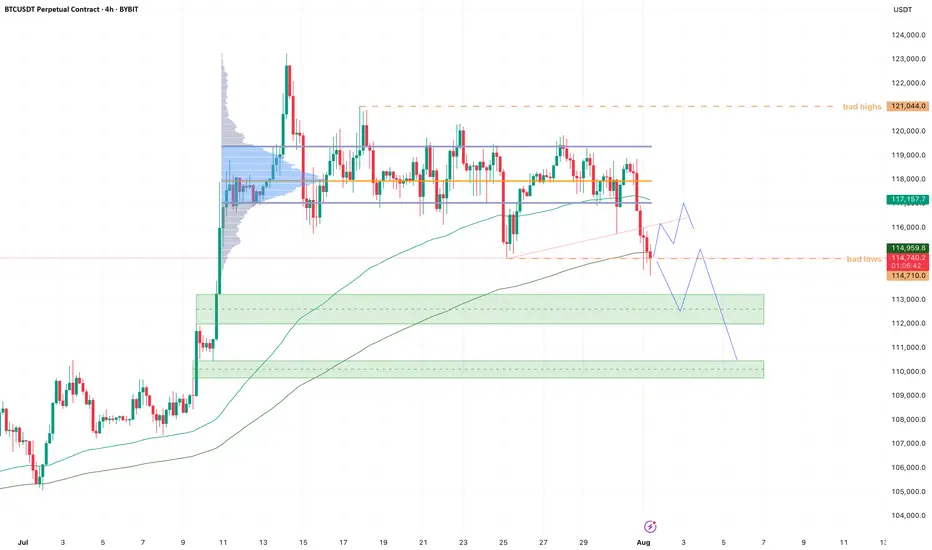
BTC - Cleaned up the lows!Bearish momentum is starting to stall here at the lows.
New month, and we started it by cleaning up the previous month's bad lows.
If we can hold here I'm looking for a trendline retest and VAL retest soon. Maybe we get one more sweep of the low, giving us a three drive pattern.
Reclaim VAL then it's back to VAH, maybe take out all the bad highs.
If we start bleeding into the lower demand zone (green box), I will start paying attention for a potential bearish retest into 110k, which we be our last area of imbalance to fill.
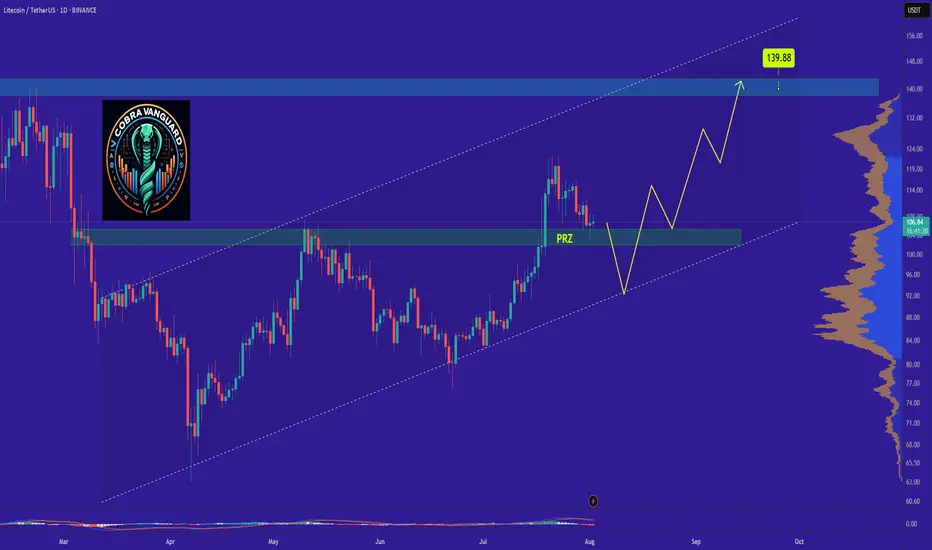
LTCs Situation (Daily) !!!If the price loses the PRZ range, it will drop to the bottom of the channel and then rise to the top of the ascending channel, which will take some time.
Best regards CobraVanguard.💚
Btcusd techinical analysis.Btcusd techinical analysis next move posibale at h1 time frame not finchinal advice.

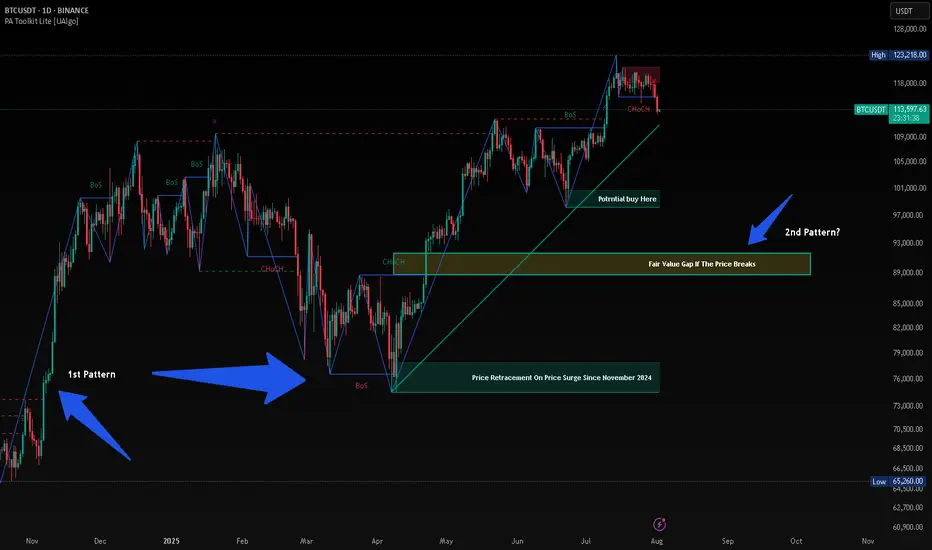
BTC HUNTS LIQUIDITYThis is just my opinion, BTC will hunt liquidity before taking new High. Since November 2024 after President Trump was elected, the price of BTC surge from $74,000 and retrace almost the same price on April 2025 after taking its new High. History will repeat itself and when history failed, there will be a long Bearish at least 90%.
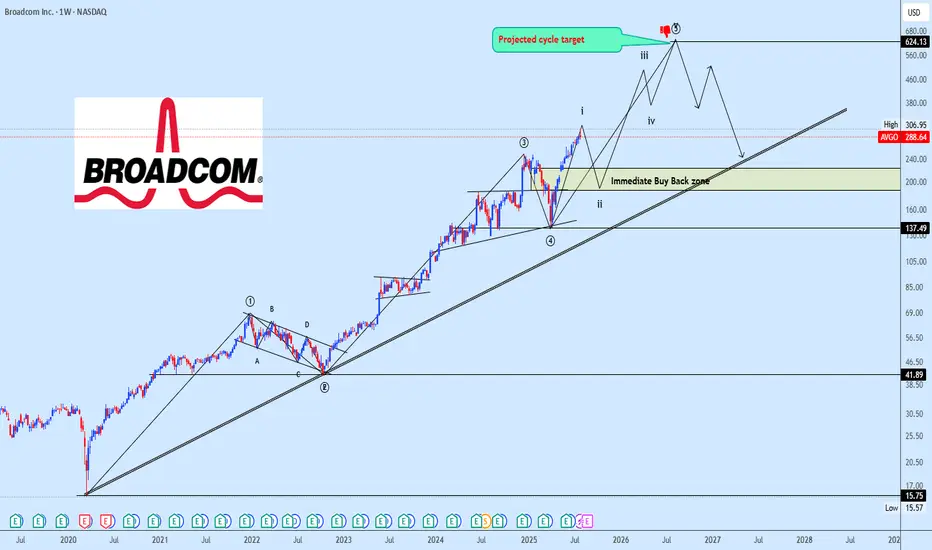
AVGO Bullish Impulse Wave Structure in ProgressAVGO continues its macro advance with a clear 5-wave impulse structure unfolding. The current price action marks the completion of subwave (i) of wave ⑤, setting the stage for a corrective pullback into subwave (ii).
We expect this corrective leg to reach into the 38.2%–50% Fibonacci retracement zone of subwave (i), which will serve as a potential re-accumulation area before the next bullish expansion.
The strategy remains to monitor the development of wave (ii) closely, waiting for key price reaction around the identified retracement zone to build positions in anticipation of subwave (iii) of ⑤ typically the strongest and most impulsive move in Elliott Wave structure.
Targets are shared on the chart for clarity. Patience here is key as we await the right entry zone aligned with technical confluence.
📌 Drop your stock requests in the comment section for quick chart updates — only equity-based assets will be accepted under this post.
Bitcoin Could Accept bearish TrendBitcoin is currently testing a key resistance zone between 120,000 and 121,000. While price action is attempting to break higher, market conditions suggest the possibility of a false breakout rather than a sustained bullish continuation.
BTC has approached a significant resistance band, and early signs of exhaustion are visible. Unless the price decisively holds above 121,000, any breakout may lack conviction. Given the broader unresolved downtrend, a corrective move remains likely.
If the breakout fails to sustain, we anticipate a pullback toward the 117,000 to 115,000 range. This would align with a retest of previous support zones and continuation of the short-term bearish structure.
Ps: Support with like and comments for better analysis Thanks.

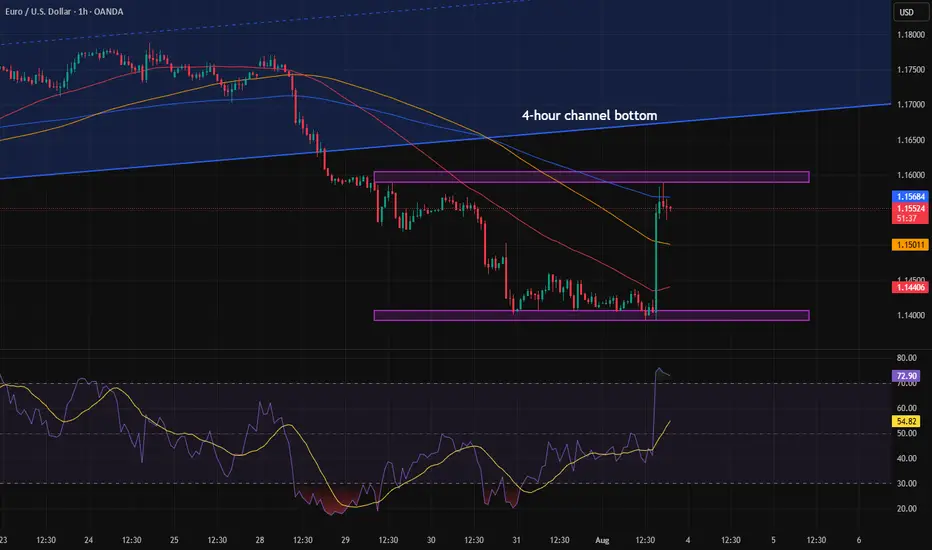
Head & Shoulders on EUR/USD daily!We're currently observing a significant Head & Shoulders pattern forming on the EUR/USD daily chart, with the price just breaking below the neckline on the right shoulder.
Applying standard Head & Shoulders trading principles, we measure the distance from the head's peak to the neckline and project that same range downward from the breakdown point. Based on this, the estimated target price (TP) for the trade lands around $1.135. The stop-loss will be positioned just above the right shoulder to manage risk effectively.
We'll be watching closely to see how this setup unfolds. 🍻

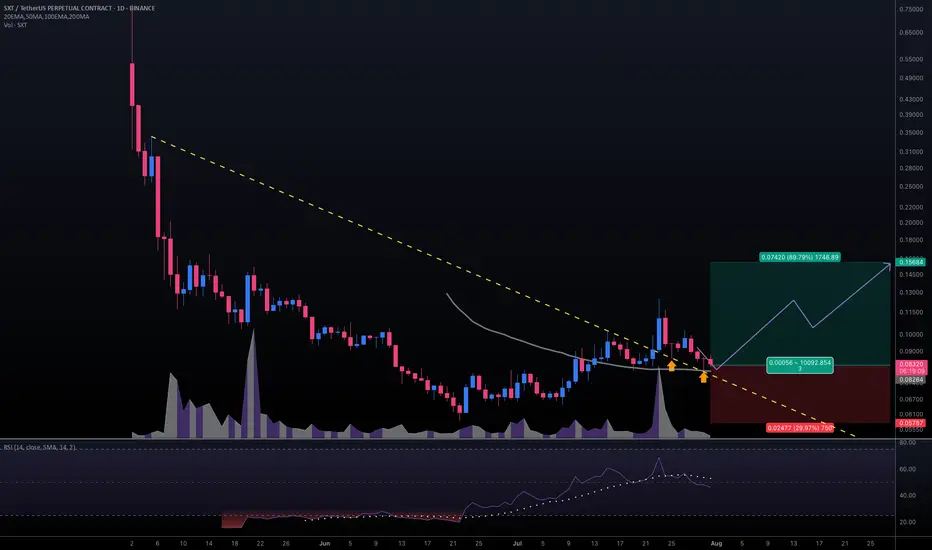
#SXTUSDT #1D (Binance Futures) Descending trendline break retestSpace and Time (SXT) pulled back to 50MA daily support, looks ready for mid-term recovery after those two dragonfly dojis in a row.
⚡️⚡️ #SXT/USDT ⚡️⚡️
Exchanges: Binance Futures
Signal Type: Regular (Long)
Leverage: Isolated (2.0X)
Amount: 5.0%
Entry Targets:
1) 0.08264
Take-Profit Targets:
1) 0.15684
Stop Targets:
1) 0.05787
Published By: @Zblaba
NYSE:SXT BINANCE:SXTUSDT.P #1D #SpaceAndTime #ZK #AI #DPoS spaceandtime.io
Risk/Reward= 1:3.0
Expected Profit= +179.6%
Possible Loss= -59.9%
Estimated Gaintime= 1 month
SPY: I think dollar milkshake is brewing, buying for long term📉 SPY Daily Breakdown – Aug 1, 2025 | VolanX Observations
🧠 Bot failed today, but the market taught more than any trade could have. Sitting out gave me the clarity to reassess structure and edge.
🔍 Market Structure Update:
Gap Down from Premium Zone: Today’s price action rejected the weak high and created a clean daily gap — signaling potential distribution at the top.
ORB (15-min) marked and ready: Likely to be retested on Monday. If price rallies into this zone and rejects, that’s where I’ll look for short entries.
Friday Bearish Close Rule: Statistically, when Friday closes red with strong momentum, Monday tends to follow — especially after a gap-down open.
🧭 Big Picture Outlook:
Liquidity Zones Below:
600 → First institutional reaction zone.
580 → Deeper demand and equilibrium area from previous consolidation.
Dollar Milkshake Brewing: Strong USD thesis could pressure equities short-term. This aligns with potential flow into defensives and out of high beta.
Long-Term Bias: Watching for deep discounts. If price moves into high-value demand zones, I’ll accumulate for the long haul — buying fear when it's priced in.
📌 What I’m Watching Next Week:
Monday open – will we see Gap & Go or a Gap Fill + Fade?
Reaction to ORB zone.
Volatility behavior and volume footprint in the first 90 minutes.
🔻 No trades today due to a bot error, but ironically, that gave me better vision. Sometimes, the best trades are the ones you don’t take.
VolanX Protocol engaged. Standing by.

Trend decision after the newsAfter the news, the price nearly reached the bottom of the higher time frame channel and paused. We need to see whether the price can break into the channel or not. Personally, I don’t think that will happen. I believe a range will form within the marked zone, and then the price will drop further.
Daily Bitcoin AnalysisBitcoin is at support at $115,000. Personally, I think this support will not hold and it will reach the next level of 112,000. Why? Because the downward momentum of the price is high.
This is not financial advice

EURUSD short to 1.121Hello Traders,
Factoring in the fundamentals such as US EUR trade deal, $600 billion of investment into US, $350 billion investment from South Korea.
4hr chart, trading under 1 day up trendline.
Was strong sell signal from 1.177 last Thursday.
200ema starting to turn downwards
Still close to upper regression channel that began July 1st, believe it is still in play.
6 hr and 12 hr block still support, strong rejection at 4h bearish block. not expecting much else today since it's Friday. Still targeting 1.121 in August
Originally entered trade at 1.172 area, added 3 times on the way down, originally targeting 1.143 but with the ever evolving trade deal news that I believe to be bullish for the USD I moved target to 1.121.
Goodluck to you all.

Solana Bullish Wave 5 coming?solana has completed the 3rd impulsive wave and now the recent decline was not impulsive but corrective meaning wave 4 has almost completed now we can look for wave 5 tp and sl are on the chart

US30 Faces Pressure Below 44610US30 Overview
Technical Outlook:
US30 is showing bearish momentum while trading below the pivot zone at 44610. As long as the price remains under this level, downside pressure may continue toward 44360, with further support at 44180.
However, a confirmed breakout above 44720 would shift the bias to bullish, opening the path toward 44910 and potentially 45100.
Support Levels: 44480 • 44360 • 44180
Resistance Levels: 44720 • 44910 • 45100
Bias: Bearish below 44610, Bullish above 44720

Gold Analysis and Trading Strategy | August 1✅ Fundamental Analysis
🔹 Trump Signs New Tariff Executive Order
On July 31, President Trump signed an executive order imposing a new round of tariffs on countries including Canada and India, while Mexico was granted a 90-day grace period. This move has once again heightened global trade uncertainty, fueling risk-off sentiment and providing support to gold.
🔹 Dollar Strength Limits Gold's Upside
Despite the increase in risk aversion, the U.S. Dollar Index has risen sharply, exerting downside pressure on gold. As a result, the price of gold remains capped, with a tug-of-war between bulls and bears dominating market dynamics.
🔹 Key U.S. Economic Data in Focus
The U.S. Non-Farm Payrolls (NFP) report is the major event on the calendar today. It is expected to be a decisive driver for short-term gold direction:
If the data is bullish for gold (e.g., weak job growth or slower wage increases), gold may retest the 3340 level.
If the data is bearish for gold (e.g., strong job gains or higher wages), gold may break below 3260, continuing its downward trend.
Ahead of the data release, gold is likely to remain in a consolidation range, with market participants generally adopting a cautious stance.
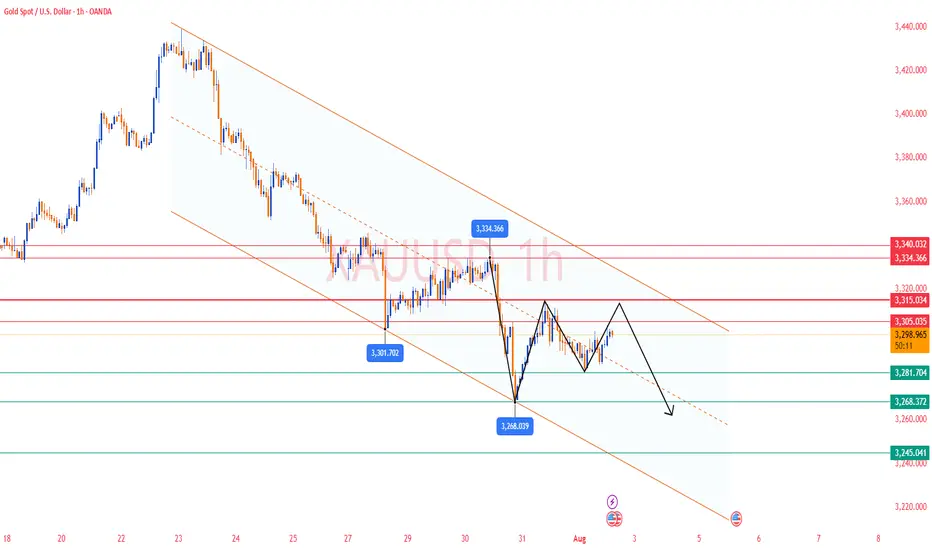
✅ Technical Analysis
🔸 Daily Chart Structure:
Gold printed a gravestone doji yesterday, characterized by a long upper shadow, indicating strong selling pressure at higher levels. The overall trend remains weak. After four consecutive daily declines followed by a minor rebound, another strong bearish candle has emerged, signaling a continuation of the downtrend.
🔸 Hourly Chart Structure:
On the 1-hour timeframe, gold remains below all major moving averages, which are aligned in a bearish formation. Despite multiple rebound attempts, each high has been lower than the last, reflecting diminishing bullish strength. The second U.S. session high was capped around 3310. If today's rebound fails to break above that level, the bearish trend remains dominant.
🔴 Resistance Levels: 3305 / 3315 / 3340
🟢 Support Levels: 3275 / 3260 / 3245
✅ Trading Strategy Reference:
🔻 Short Position Strategy:
🔰Consider entering short positions in batches if gold rebounds to the 3305-3310 area. Target: 3285-3270;If support breaks, the move may extend to 3250.
🔺 Long Position Strategy:
🔰Consider entering long positions in batches if gold pulls back to the 3245-3250 area. Target: 3265-3275;If resistance breaks, the move may extend to 3285.
🔥Trading Reminder: Trading strategies are time-sensitive, and market conditions can change rapidly. Please adjust your trading plan based on real-time market conditions. If you have any questions or need one-on-one guidance, feel free to contact me🤝
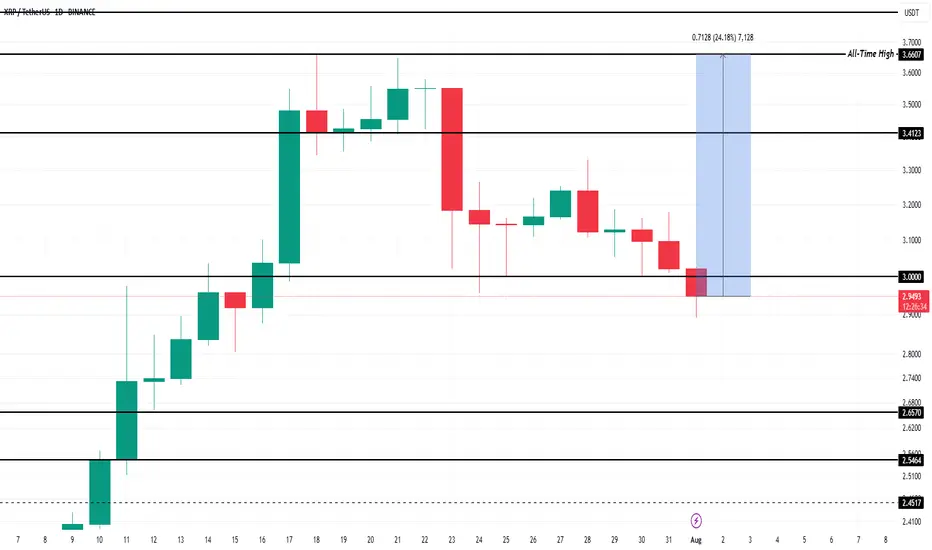
What To Expect From XRP In August 2025?Currently, BINANCE:XRPUSDT is trading at $2.99, slipping through the key support level of $3.00. While the altcoin is still over 22% away from its ATH of $3.66 , the foundation for potential growth remains strong. Historical data has shown that August typically brings bearish momentum for BINANCE:XRPUSDT , with median monthly returns of -6% .
However, given the strong buying activity observed recently and the positive technical indicators, this August might defy the usual trend. If BINANCE:XRPUSDT manages to secure support above $3.41, the altcoin could push towards its ATH once again . Alexis Sirkia, Captain at Yellow Network, discussed with BeInCrypto how XRP’s future could be looking like.
“Institutions that have been in the market for a while are gaining momentum. We're also, in the meanwhile, in a macro environment where funds are doing risk rotation… BINANCE:XRPUSDT is taking its stand with regulation and infrastructure, not hype. That's what will endure in the long run. Short-term flows are fleeting, but the groundwork laid today will define the cycle to follow.”
However, there’s a downside risk. If BINANCE:XRPUSDT fails to reclaim the $3.00 support, the price could fall to $2.65, invalidating the bullish thesis. A drop to this level would mark a four-week low and would likely lead to further selling pressure.
Bitcoin Has Bearish DivergenceOverbought bearish divergence.
I pointed this out last week. In my mind, this is the most reliable signal for tops (bullish divergence for bottoms) that exists in technical analysis. We can see that this continues to play out, and know that it usually leads to RSI making the trip to oversold.
It looks like more correction is likely, standard fare in a bull market.
