White House Crypto Report Incoming: Will BTC Pump from Support? One of the important news for Bitcoin ( BINANCE:BTCUSDT ) that was released today was that " White House confirms first Bitcoin and crypto report will be released TOMORROW ". Bitcoin is likely to rise with the release of the White House report .
What do you think? At least a temporary pump may be in store for Bitcoin.
Bitcoin fell to the Support zone($116,900-$115,730) and filled the New CME Gap( $119,500-$118,295) as I expected in the previous idea .
Bitcoin is currently moving near the Support zone($116,900-$115,730) , Cumulative Long Liquidation Leverage($116,828-$115,710) and Potential Reversal Zone(PRZ) .
I expect Bitcoin to rise from the Support zone($116,900-$115,730) to at least $118,680(First Taregt) .
Second target: Upper line of the descending channel
Note: Stop Loss: $114,680 = Worst Stop Loss(SL)
CME Gap: $115,060-$114,947
Cumulative Short Liquidation Leverage: $118,827-$118,298
Cumulative Short Liquidation Leverage: $120,144-$119,200
Please respect each other's ideas and express them politely if you agree or disagree.
Bitcoin Analyze (BTCUSDT), 1-hour time frame.
Be sure to follow the updated ideas.
Do not forget to put a Stop loss for your positions (For every position you want to open).
Please follow your strategy and updates; this is just my Idea, and I will gladly see your ideas in this post.
Please do not forget the ✅' like '✅ button 🙏😊 & Share it with your friends; thanks, and Trade safe.
Community ideas

Lingrid | HYPEUSDT Potential Continuation After PullbackKUCOIN:HYPEUSDT is bouncing from a higher low near the 42.070 zone after breaking a descending flag pattern. Price action remains above the ascending support trendline while pressing into a key structure retest. As long as GETTEX:HYPE stays above 42, a bullish leg toward the 49.700 resistance remains likely. Structure suggests a resumption of the impulse phase within the broader uptrend.
📉 Key Levels
Buy trigger: Clean breakout above 45.00
Buy zone: 41.5 – 43.0 (support + flag bottom)
Target: 49.700
Invalidation: Close below 40.00
💡 Risks
Breakdown below the ascending support would weaken the bullish setup
Failure to reclaim mid-flag resistance may lead to deeper consolidation
Broader market weakness in altcoins could delay breakout momentum
If this idea resonates with you or you have your own opinion, traders, hit the comments. I’m excited to read your thoughts!

SOL Both scenarios are valid! SOL is still bullishSOL Both scenarios are valid! SOL is still bullish
SOL is in a critical zone. The price is still inside a large bullish pattern and as long as it stays inside the pattern, the trend remains bullish and SOL should follow the bullish scenario.
The bullish targets are at 205, 214 and 224
It may happen that the FOMC will bring surprises, so if SOL manages to break below the pattern, it will activate the bearish scenario after that and the chances of falling will increase further as shown in the red scenario.
The bearish targets are at 160 and 139
You may find more details in the chart!
Thank you and Good Luck!
PS: Please support with a like or comment if you find this analysis useful for your trading day

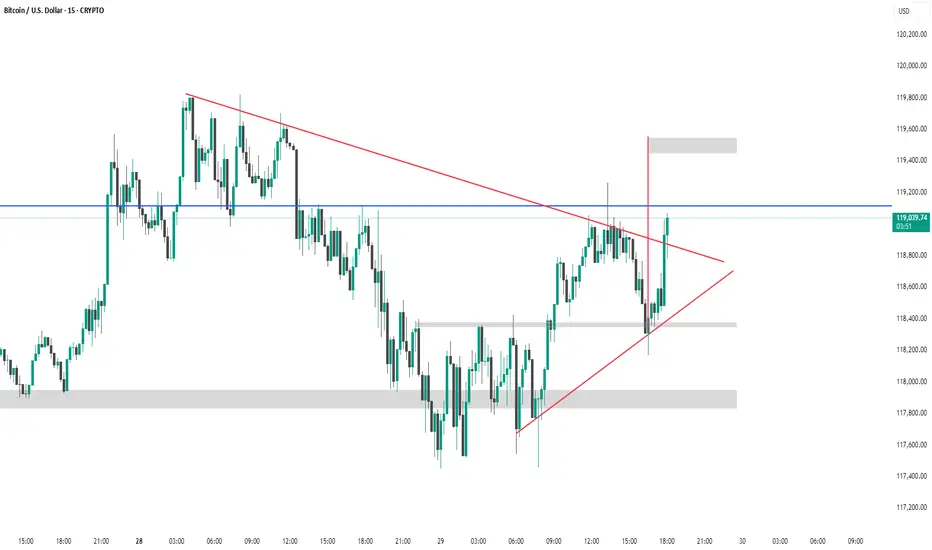
BTC #This 15-minute chart of Bitcoin/USD shows a symmetrical triThis 15-minute chart of Bitcoin/USD shows a symmetrical triangle breakout pattern. Price recently broke above the upper red trendline resistance, suggesting bullish momentum.
Key highlights:
Breakout candle is strong and closes above the resistance zone (~$119,000).
Next potential target is near the upper grey supply zone (~$119,500), based on the triangle’s height.
Support zones below are marked around $118,400 and $118,000.
This breakout indicates a possible continuation to the upside, provided the breakout holds. Watch for retests and volume confirmation.
GBPAUD I Weekly CLS I Model 2 I Target 0B and full CLSYo Market Warriors ⚔️
Fresh outlook drop — if you’ve been riding with me, you already know:
🎯My system is 100% mechanical. No emotions. No trend lines. No subjective guessing. Just precision, structure, and sniper entries.
🧠 What’s CLS?
It’s the real smart money. The invisible hand behind $7T/day — banks, algos, central players.
📍Model 1:
HTF bias based on the daily and weekly candles closes,
Wait for CLS candle to be created and manipulated. Switch to correct LTF and spot CIOD. Enter and target 50% of the CLS candle.
Model 1 Done
Analysis done on the Tradenation Charts
Disclosure: I am part of Trade Nation's Influencer program and receive a monthly fee for using their TradingView charts in my analysis.
Trading is like a sport. If you consistently practice you can learn it.
“Adapt what is useful. Reject whats useless and add whats is specifically yours.”
David Perk aka Dave FX Hunter
💬 Don't hesitate to ask any questions or share your opinions

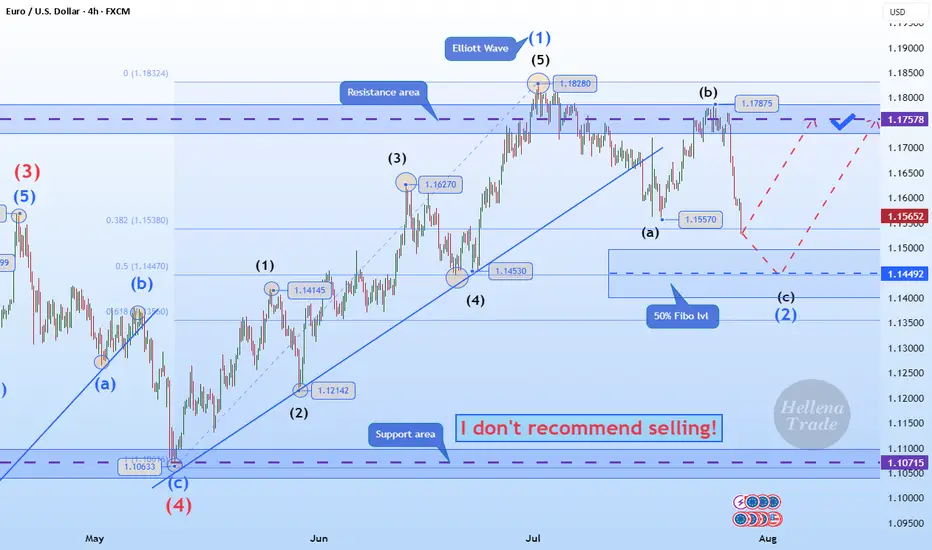
Hellena | EUR/USD (4H): LONG to the resistance area 1.17578.Colleagues, the price has made a strong downward movement, which can only mean one thing: the correction is not complete.
This means that the latest upward movement is wave “1” of medium order.
Therefore, I now expect the correction to end in wave “2” at the 50% Fibonacci level and thean upward movement to continue to at least the resistance level of 1.17578.
It is quite possible that after updating the level of 1.15570, the price will immediately begin an upward movement — this is a more risky option for entering a position.
Manage your capital correctly and competently! Only enter trades based on reliable patterns!
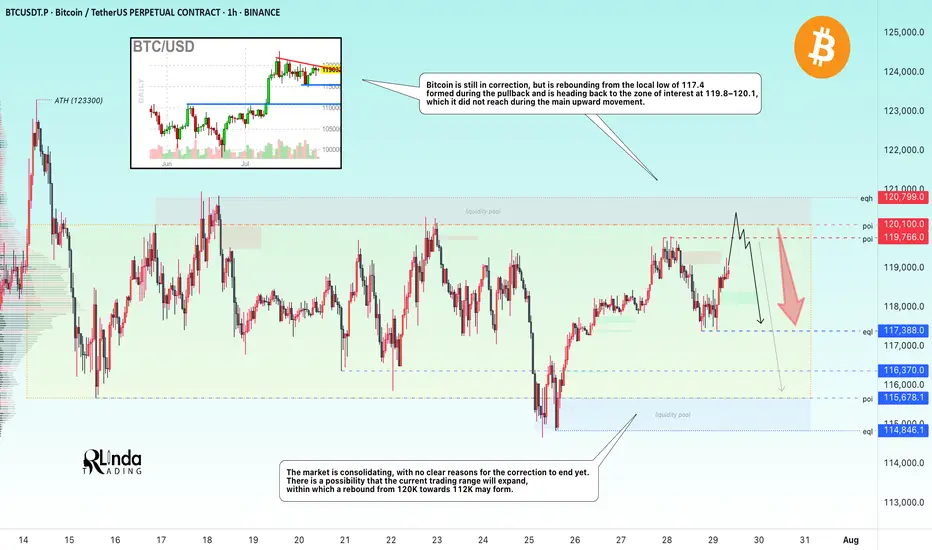
BITCOIN → Hunting for liquidity. Retest resistance before a fallBINANCE:BTCUSDT.P continues to consolidate after a strong rally. There is no strong driver yet, and Bitcoin is reacting weakly to economic data. There is a possibility of a continued correction...
Bitcoin is still in correction, but is rebounding from the local low of 117.4, formed during the pullback, and is heading back up towards the zone of interest at 119.8-120.1, which it did not reach during the main upward movement. I see no fundamental or technical reasons for the correction to end and for growth beyond 121K. I expect a rebound from the resistance zone towards 115-114K. However, in the medium term, I expect the market to attempt to close half or all of the gap between 112K and 114.8K, thereby expanding the key trading range.
Resistance levels: 119.77, 120.1K, 120.8K
Support levels: 117.4, 116.37, 115.68
Technically, a false breakout (liquidity capture) of key resistance and price consolidation in the selling zone could trigger bearish pressure on the market, which in turn would lead to a correction.
Best regards, R. Linda!
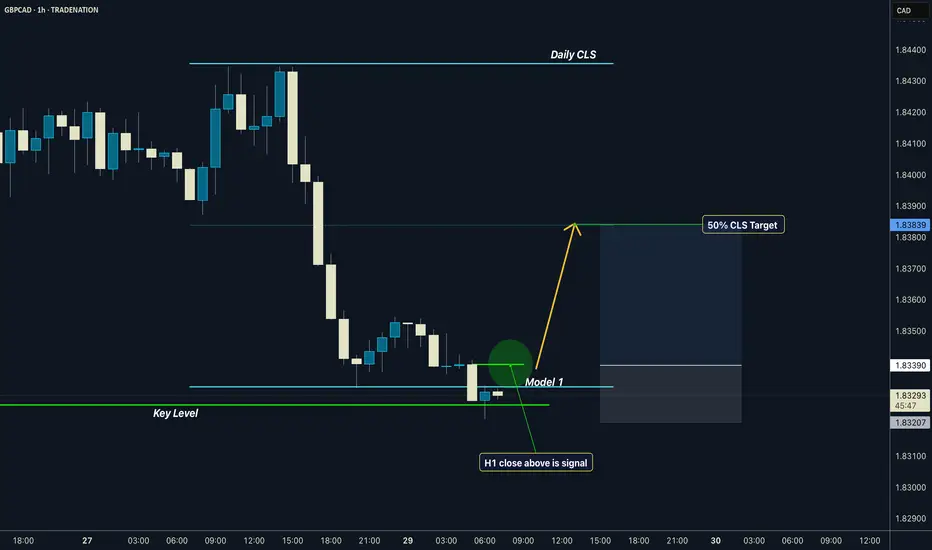
GBPCAD I Daily CLS I Model 1 I 50% CLS TargetYo Market Warriors ⚔️
Fresh outlook drop — if you’ve been riding with me, you already know:
🎯My system is 100% mechanical. No emotions. No trend lines. No subjective guessing. Just precision, structure, and sniper entries.
🧠 What’s CLS?
It’s the real smart money. The invisible hand behind $7T/day — banks, algos, central players.
📍Model 1:
HTF bias based on the daily and weekly candles closes,
Wait for CLS candle to be created and manipulated. Switch to correct LTF and spot CIOD. Enter and target 50% of the CLS candle.
For high probability include Dealing Ranges, Weekly Profiles and CLS Timing.
Analysis done on the Tradenation Charts
Disclosure: I am part of Trade Nation's Influencer program and receive a monthly fee for using their TradingView charts in my analysis.
Trading is like a sport. If you consistently practice you can learn it.
“Adapt what is useful. Reject whats useless and add whats is specifically yours.”
David Perk aka Dave FX Hunter
💬 Don't hesitate to ask any questions or share your opinions
USDCAD: a long positionHello guys.
Divergence:
A bullish RSI divergence is noted, price made lower lows while RSI formed higher lows, signaling a potential bullish reversal.
Price Action:
Price has bounced strongly from around the 1.3570–1.3580 zone and is now approaching a descending trendline resistance.
Trade Setup:
Entry: 1.3718
Stop Loss: Below the breakout candle, near 1.3686
Take Profit: Around 1.3782
Risk-to-Reward: 1:3

GBPAUD Reverses from Key Zone – Long Setup in Play!Today I want to share with you a Long position on GBPAUD ( OANDA:GBPAUD ).
GBPAUD started to rise well from the Important Support line , Support zone(2.032 AUD-1.987 AUD) , and Potential Reversal Zone(PRZ) and managed to close the 4-hour candle above 2.053 AUD (important) .
In terms of Elliott wave theory , GBPAUD seems to have completed the main wave 4 . The main wave 4 structure was a Double Three Correction(WXY) .
Also, along the way, we can see a Bullish Marubozu candle , which could indicate a continuation of the uptrend .
I expect GBPAUD to break the Resistance lines soon and attack the Resistance zone(2.078 AUD-2.066 AUD) .
First Target: 2.065 AUD
Second Target: 2.076 AUD
Note: Stop Loss(SL): 2.040 =Worst SL
Please respect each other's ideas and express them politely if you agree or disagree.
British Pound/ Australian Dollar Analyze (GBPAUD), 4-hour time frame.
Be sure to follow the updated ideas.
Do not forget to put a Stop loss for your positions (For every position you want to open).
Please follow your strategy and updates; this is just my Idea, and I will gladly see your ideas in this post.
Please do not forget the ✅' like '✅ button 🙏😊 & Share it with your friends; thanks, and Trade safe.

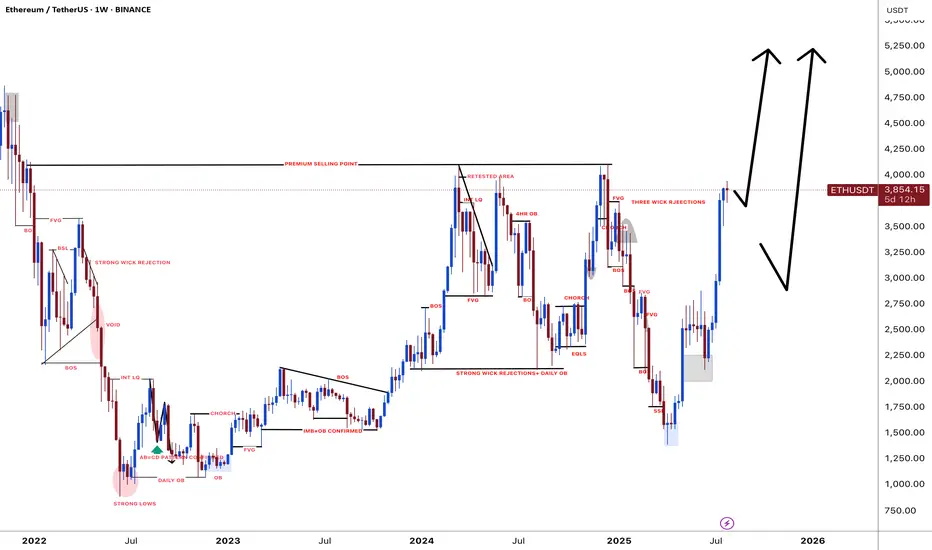
Ethereum at a Critical Crossroad: Will $4,000 Finally Break ?Ethereum is once again approaching the psychologically significant $4,000 resistance level, a high-timeframe barrier that has rejected price on multiple occasions. As the second-largest cryptocurrency by market cap pushes higher, traders are closely watching for signs of a breakout—or another range-bound rejection.
Ethereum has entered a decisive phase, with price action now testing the upper boundary of a long-standing trading range. After multiple failed attempts to breach the $4,000 mark, ETH is consolidating just below this level, creating an environment filled with both opportunity and risk. Whether Ethereum can break through or gets rejected again will shape its mid- to long-term outlook.
Key Technical Points:
- Major Resistance at $4,000: A psychologically important level and long-time price cap on high timeframes
- Defined Trading Range: ETH has remained range-bound between $1,300 and $4,000 for an extended period
- Critical Candle Closes Needed: Breakout requires strong daily or weekly closes above $4,000 to confirm
Ethereum’s price is hovering just under the $4,000 resistance zone, which has acted as a ceiling for price action since early 2022. From a high time frame perspective, ETH has been range-bound, trading between $1,300 as the range low and $4,000 as the range high. Each visit to this upper boundary has led to a rejection and a subsequent rotation back toward mid-range or lower levels.
Now, with momentum building and bullish sentiment returning across the crypto market, Ethereum finds itself at another pivotal moment. The key technical requirement for a confirmed breakout will be a decisive daily or weekly close above the $4,000 level. Without this confirmation, any temporary push above the resistance could result in a fakeout and trap late long entries.
Volume behavior around this zone remains mixed. While there is some bullish buildup in recent sessions, there has not yet been a significant influx in volume to confirm conviction from buyers. This aligns with the historical pattern of Ethereum trading at resistance before eventually pulling back, suggesting caution is still warranted.
However, should ETH close decisively above $4,000 and turn this level into support, it would mark the first major break of this range since its inception. This would likely trigger a wave of bullish momentum, possibly sending Ethereum to new yearly highs, with $4,500–$5,000 being the next logical resistance zones based on historical price pivots and Fibonacci extensions.
What to Expect in the Coming Price Action
Ethereum’s price action is currently neutral-bullish but hinges entirely on its interaction with the $4,000 resistance. A confirmed breakout could usher in a powerful rally toward new highs, while another rejection would likely continue the long-standing range between $1,300 and $4,000. Until a decisive move occurs, traders should remain cautious and reactive rather than overly anticipatory.

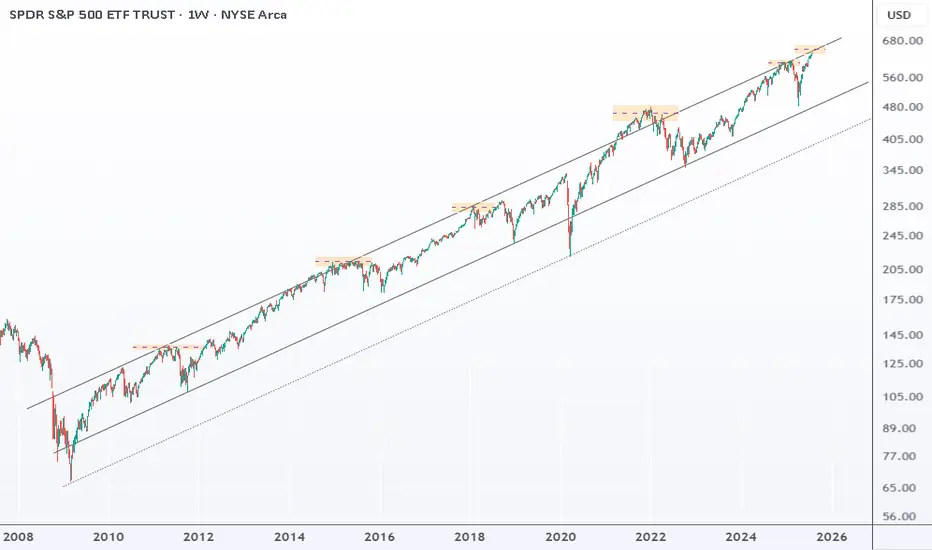
SPY : back near the top of its upward channelSPY is back near the top of its upward channel, a strong resistance.
Every time this happened since 2011, markets dropped 10–27%.
Still trending up, but this setup doesn’t look great.
Since the April low, SPY is up 30%, short-term trend is stretched and vulnerable.
#ETHUSDT: Price is going as expected in previous ideas on eth!!ETHUSDT is performing well as expected in our previous analysis, as the price has reached the $4000 area. There are two potential areas where the price could reverse. The first is a small correction, which could cause a sharp price reversal without a significant price correction. The second area is a void price, which may be filled before any further strong bullish movement.
Please use strict risk management while trading.
Team Setupsfx_
XAUUSD under pressure – Is the downtrend just beginning?Hello everyone! What do you think about XAUUSD right now?
Yesterday, XAUUSD extended its decline and is currently trading around 3,315 USD.
The recent drop in gold prices was mainly triggered by a stronger US dollar, following a trade agreement between the US and the European Union (EU).
From a technical perspective, the short-term outlook shows the beginning of a new downtrend. Notably, we see a bearish crossover in the EMA 34 and 89, along with a break of the previous upward trendline—both reinforcing the current bearish momentum.
If there’s a pullback before the next leg down, the 0.5–0.618 Fibonacci retracement zone (which also aligns with resistance and the EMAs) will be a key area to watch. This could be an ideal level for potential trade setups.
Looking ahead, the next support target is around 3,300 USD. If that level breaks, gold might aim for the 32XX region.
Do you think XAUUSD will continue to fall? Drop your thoughts in the comments!
Wishing you successful and profitable trades!

### *EUR/USD 4H – Bearish Breakdown Scenario* *Analysis:*- Price is respecting a *descending structure* with repeated lower highs.
- Strong support is highlighted around *1.15375* — if this breaks, it confirms a bearish continuation.
- The Ichimoku Cloud remains bearish; price is below the cloud, and the cloud ahead is thick and red.
- The blue arrow on your chart suggests *further downside movement* after support breaks.
### *Trade Setup:*
- *Sell Entry:* Below *1.15375* (on strong 4H candle close)
- *Take Profit 1 (TP1):* *1.14700* (previous demand zone)
- *Take Profit 2 (TP2):* *1.14000*

DeGRAM | GOLD broke the rising channel📊 Technical Analysis
● XAU printed a false break above the 3 400 wedge roof, then sliced back through the rising mid-channel, closing under the wedge base at 3 309 - a classic bull-trap that flips that band into resistance.
● Momentum has rolled over, and the break of July’s micro up-trend opens room to the broad triangle floor/May trend-pivot near 3 246; successive lower-highs since 24 Jul confirm bearish control.
💡 Fundamental Analysis
● Hot US Q2-GDP and sticky core-PCE lifted 2-yr yields to one-month highs, reviving the dollar bid, while cautious ECB guidance tempers euro gold demand.
✨ Summary
Sell 3 309-3 335; hold below 3 309 targets 3 246 ▶ 3 200. Invalidate on an H4 close above 3 366.
-------------------
Share your opinion in the comments and support the idea with a like. Thanks for your support!

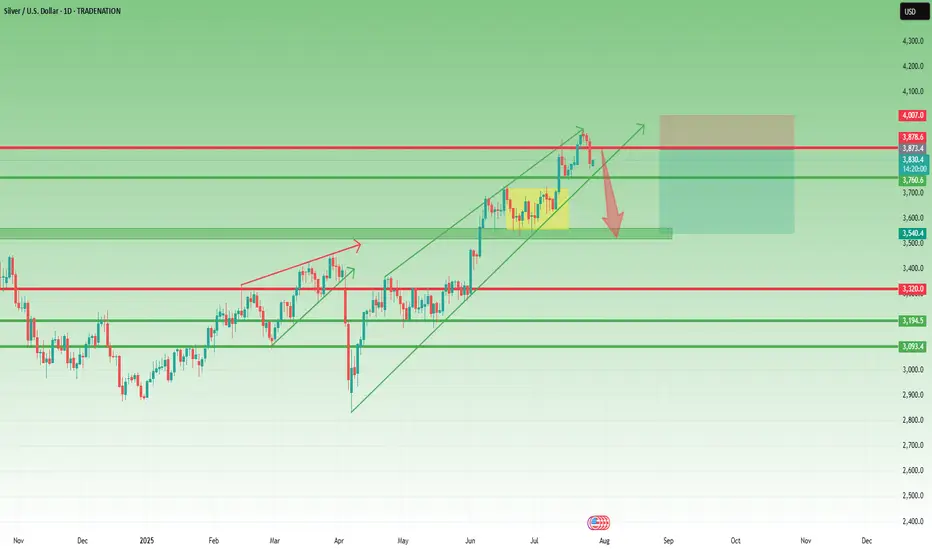
XAGUSD – Reversal Signs After the Run Toward $40Lately, I’ve been a strong advocate for a Silver rally toward $40, and indeed, we got a solid move, with price reaching as high as $39.50, not touching 40 though...
Just like with Gold, the last 3 days of last week turned bearish, and now it looks like we may be entering the early stage of a correction.
📉 Current Setup:
- The rejection from $39.50, right below the psychological $40 level, is significant
- I’ll be monitoring for a possible short entry if we get a rebound into the $38.80–$39.00 zone
- A new high above $39.50 would invalidate this setup
📌 On the downside, if price breaks below the confluence support at $37.70–$38.00, that would confirm the reversal and could lead to an acceleration toward $35.50 support
Conclusion:
The bullish narrative on Silver is pausing here. Until a new high is made, I’m looking to sell the bounce and follow the momentum if the breakdown under support is confirmed.
Let’s see how this plays out this week. 🧭
Disclosure: I am part of TradeNation's Influencer program and receive a monthly fee for using their TradingView charts in my analyses and educational articles.
USDJPY 30Min Engaged ( BULLISH & Bearish Break Entry Detected )Time Frame: 30-Minute Warfare
Entry Protocol: Only after volume-verified breakout
🩸Bullish Break- 148.750
🩸Bearish Break- 148.370
➗ Hanzo Protocol: Volume-Tiered Entry Authority
➕ Zone Activated: Dynamic market pressure detected.
The level isn’t just price — it’s a memory of where they moved size.
Volume is rising beneath the surface — not noise, but preparation.
🔥 Tactical Note:
We wait for the energy signature — when volume betrays intention.
The trap gets set. The weak follow. We execute.

ARKK: The Calm Before the Innovation Storm -ALTSEASON Is COMING🚀 ARKK: The Calm Before the Innovation Storm 🌪️
The markets are shifting, and disruption is about to go vertical. ARK Innovation ETF (ARKK) is quietly positioning itself for what could be the most explosive move of this decade. With high-conviction bets in AI, Bitcoin, genomics, and next-gen tech, this isn’t just a fund—it’s a launchpad for exponential growth.
This post breaks down exactly why ARKK could go parabolic—and why the smart money is already moving in. 👇
Explosive upside in 2026
ARKK is already up over 24% YTD , showing strong momentum compared to broader markets and signaling early stages of a potential parabolic move .
High-conviction concentration in game-changers
Top 10 holdings include Tesla, Roku, Zoom, Coinbase, UiPath, Block, Crispr Therapeutics, DraftKings, Shopify, and Exact Sciences. These are leaders in innovation sectors with massive upside potential .
Deep exposure to Bitcoin and digital assets
Heavy allocation to Coinbase and Block gives indirect exposure to Bitcoin . If BTC breaks into a new cycle high , ARKK stands to benefit significantly.
Positioned in exponential growth sectors
Focus on AI, genomics, EVs, fintech, robotics, and blockchain , all of which are entering accelerating adoption phases globally.
Aggressive smart-money accumulation
Cathie Wood’s team continues buying aggressively during dips, reinforcing institutional confidence in the fund’s long-term trajectory.
Technical breakout structures forming
Ascending triangle and multi-month consolidation breakouts suggest a technical setup primed for explosive upside .
Innovation supercycle aligning
ARKK's themes are aligned with major global shifts like de-dollarization, decentralized finance, and AI convergence .
High beta = massive upside leverage
With a beta above 2 , ARKK tends to outperform in bull runs , offering leveraged exposure to innovation without the need for margin.
Resurgence of top holdings
Names like Coinbase, Tesla, Shopify, and Roku are up 50%–100% YTD , driving ARKK’s NAV growth and fueling bullish sentiment .
Long-term vision with short-term catalysts
The fund projects 5x returns over the next five years , while Bitcoin halving cycles, tech innovation, and regulatory clarity serve as short-term ignition points .
Marty Boots | 17-Year Trader — smash that 👍👍, hit LIKE & SUBSCRIBE, and share your views in the comments below so we can make better trades & grow together!

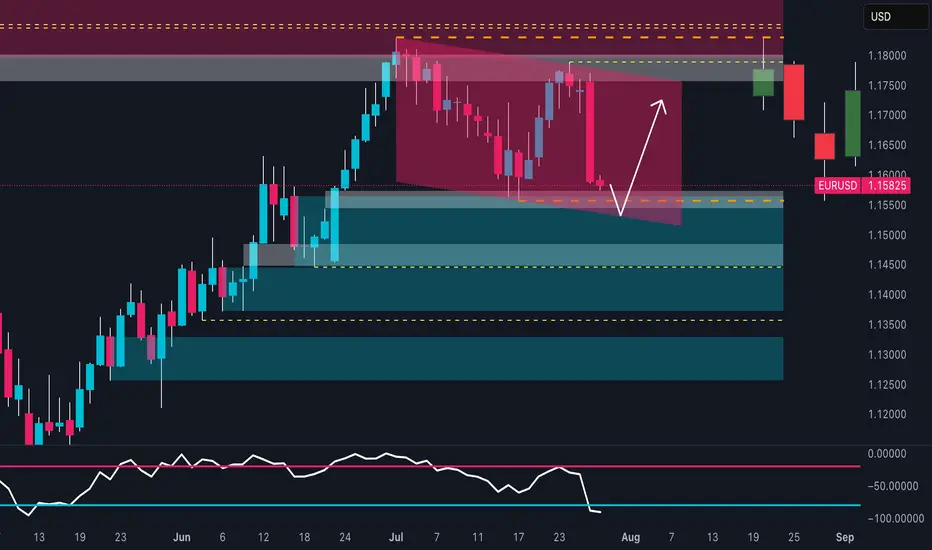
EUR/USD at a Turning Point:Rally or Trap for the Bulls?📉 Technical Analysis
Price has decisively broken out of the descending channel highlighted in recent weeks. The weekly support zone between 1.1540 – 1.1580 is holding, triggering a significant technical reaction. The weekly RSI has entered oversold territory, suggesting a potential short-term reversal.
Key Support: 1.1530–1.1580 (currently reacting)
Key Resistance: 1.1720–1.1780 (inefficiency & supply zone)
Base Case: Potential rebound toward 1.1720–1.1750 before next structural decision
🧠 Sentiment Analysis
82% of retail traders are long, with an average entry at 1.1635
Only 18% are short, a clear minority
This extreme imbalance suggests downside pressure may persist to flush out weak long hands before a genuine reversal takes place.
📊 COT (Commitment of Traders)
USD Index:
Non-Commercials increased both long (+663) and short (+449) positions → uncertain stance but slight USD strengthening
EUR Futures:
Non-Commercials increased long (+6,284) and short (+8,990) positions, but net increase favors the bears
This shift signals a bearish turn in sentiment among large speculators, indicating short-term downward pressure.
📈 Seasonality
In July, EUR/USD historically tends to rise, but:
This year’s price action is underperforming the seasonal pattern, showing relative weakness
August is historically flat to slightly bearish
Seasonality does not currently support a strong bullish continuation
✅ Strategic Conclusion
Current Bias: Bearish-neutral (with short-term bullish bounce expected)
A technical rebound toward 1.1720–1.1750 is likely (liquidity void + RSI bounce + retail imbalance)
However, 1.1720–1.1750 is a key supply zone to monitor for fresh shorts, in line with:
Dollar-supportive COT data
Overcrowded long retail positioning
Weak seasonal context
🧭 Operational Plan:
Avoid holding longs above 1.1750 without macro confirmation
Monitor price action between 1.1720–1.1750 for potential short re-entry
Clean breakout above 1.1780 → shift bias to neutral/bullish
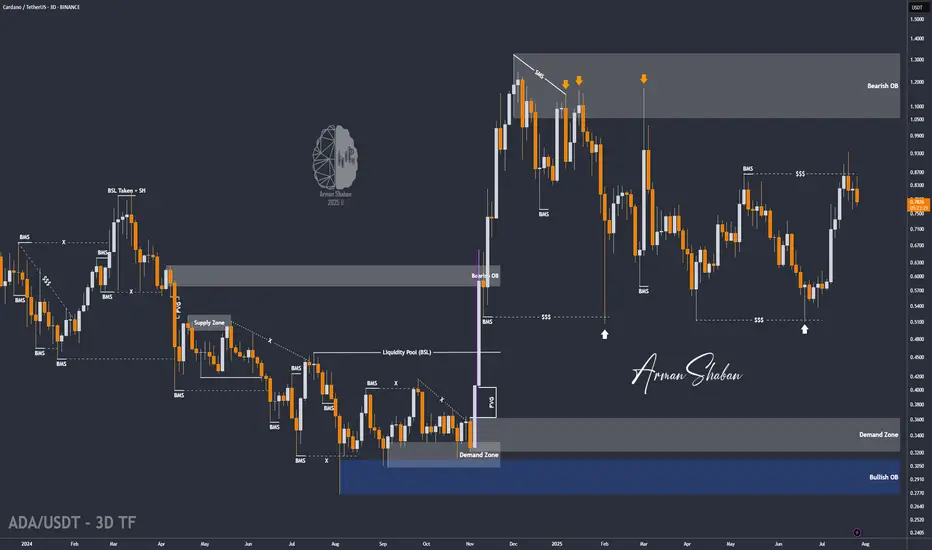
ADA/USDT | Pullback to Key Support – Can It Rebound Toward $1.32By analyzing the Cardano chart on the 3-day timeframe, we can see that after reaching $0.935, the price faced selling pressure and dropped by 18% to the $0.76 area. Now, the key is whether ADA can hold above the $0.75 level by the end of the week. If it succeeds, we could expect further bullish continuation. The next potential targets are $0.86, $0.93, $1.02, and $1.32.
Please support me with your likes and comments to motivate me to share more analysis with you and share your opinion about the possible trend of this chart with me !
Best Regards , Arman Shaban
ACTB I Weekly CLS High In play I Clean Break OutFresh Crypto Analysis— if you’ve been riding with me, you already know:
🎯My system is 100% mechanical. No emotions. No trend lines. No subjective guessing. Working all timeframes. Just precision, structure, and sniper entries.
🧠 What’s CLS?
It’s the real smart money. The invisible hand behind $7T/day — banks, algos, central players.
📍Model 1:
HTF bias based on the daily and weekly candles closes,
Wait for CLS candle to be created and manipulated. Switch to correct LTF and spot CIOD. Enter and target 50% of the CLS candle.
For high probability include Dealing Ranges, Weekly Profiles and CLS Timing.
Analysis done on the
“Adapt what is useful. Reject whats useless and add whats is specifically yours.”
David Perk aka Dave FX Hunter
💬 Comment any Coin I ll give you my quick view

Litecoin (LTC): Bearish until Fill of CME | After That We Buy Litecoin is under pressure by sellers, and we might be heading toward that bearish CME gap. Multiple trades that can be taken so keep your eyes wide open!
More in-depth info is in the video—enjoy!
Swallow Academy
