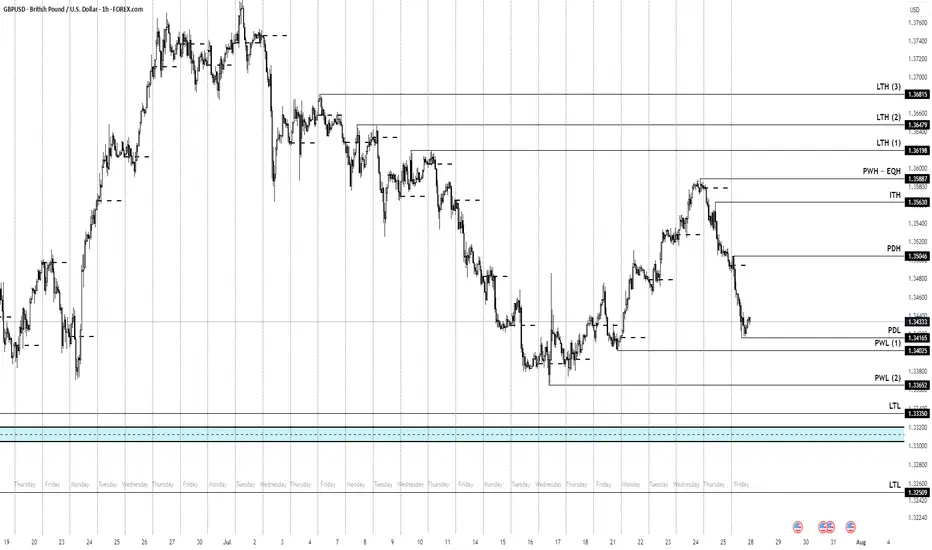
GBP-USD Support Ahead! Buy!
Hello,Traders!
GBP-USD went down but
The pair will soon hit a
Horizontal support level
Of 1.3400 from where we
Will be expecting a local
Rebound and a move up
Buy!
Comment and subscribe to help us grow!
Check out other forecasts below too!
Disclosure: I am part of Trade Nation's Influencer program and receive a monthly fee for using their TradingView charts in my analysis.
Community ideas

$INTC Got Smacked. Relief Bounce or Trap?Yikes. NASDAQ:INTC just faceplanted from $23.50 straight down to $20.50. It’s peeking its head up now. If you’re playing the bounce, be nimble — this thing’s still bleeding on the higher timeframes. Don't get in unless you see more pickup and buy signal.
UltraAlgo caught the drop early. If it crosses $20 could go down deeper.

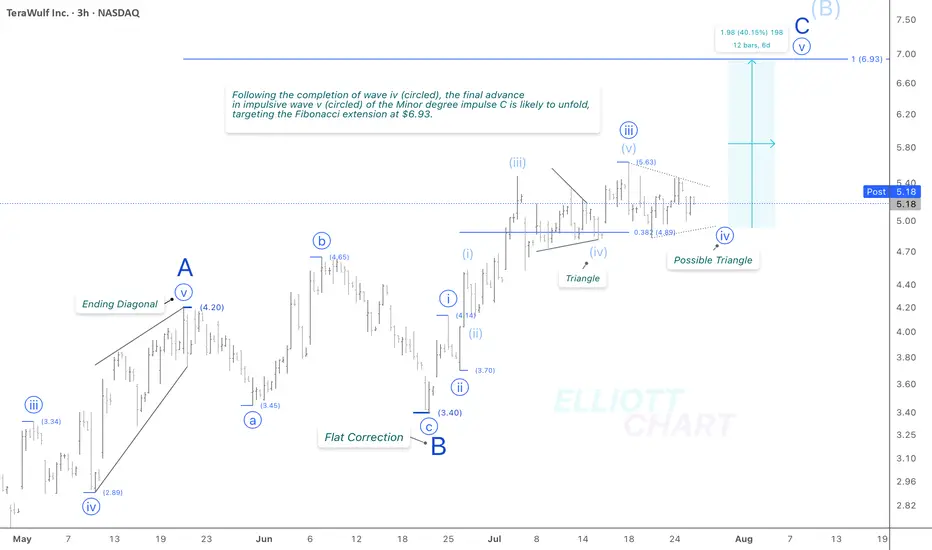
WULF / 3hWave Analysis >> While the overall outlook on NASDAQ:WULF remains consistent with the previous analysis, the ongoing sideways volatility suggests a need to reassess the wave count on the final stages of Minor degree impulsive advance in wave C.
The Fib extension target remains intact >> 6.93
Trend Analysis >> Upon completion of Minor degree wave C, the countertrend advance of Intermediate degree wave (B), which has been unfolding since April 9, is likely to give way to a decline in wave (C) of the same degree. This downtrend might begin in the coming days and potentially extend through the end of the year!!
NASDAQ:WULF CRYPTOCAP:BTC BITSTAMP:BTCUSD MARKETSCOM:BITCOIN
#CryptoStocks #WULF #BTCMining #Bitcoin #BTC
BTC Retrace RoadMap and 3 nearby supports worth watching NOWThis is a near-term followup to my big picture linked below.
Dip is underway after orbiting our Genesis Fib at 117.9k.
Quickly approaching the next three supports worth watching.
Supports get stronger below but each one needs to slow the dip.
$ 115,140 is a minor fib but possible end of dip wave.
$ 113,9xx is a double fib that should be pretty strong
$ 111,661 is the sister Genesis fib, and a MUST HOLD
.
Big Picture chart and why 117.9k was KEY
=======================================================
.

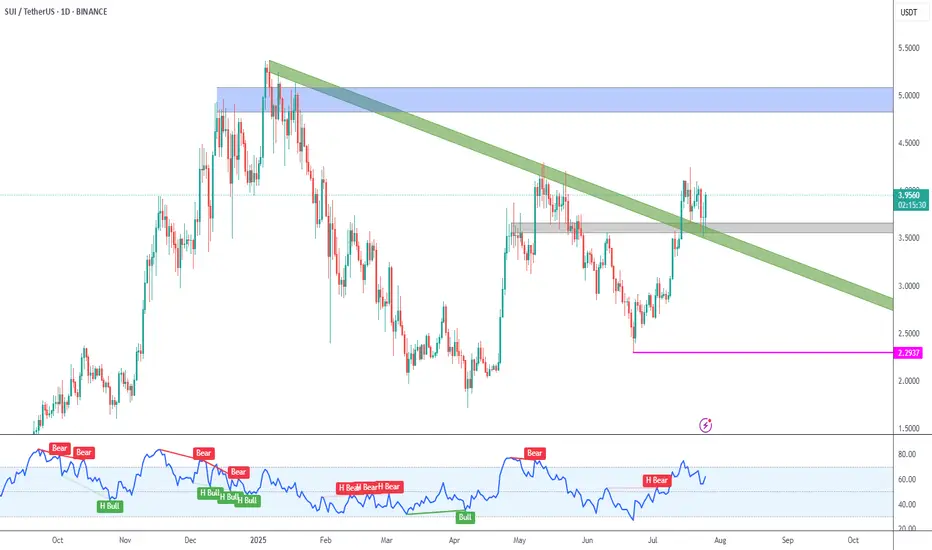
SUI Trendline Broken
➡️ SUI has broken the green descending trendline originated on the early 2025 high.
➡️ Price is also being held by the gray support zone around 3.60.
➡️ Next target is the blue supply zone at 5.00 round number.
➡️ Invalidation is at 2.2937 (pink line), so be wary of liquidity hunts below gray support.
Long $BABA - NYSE:BABA is testing 200 SMA
- NYSE:BABA moves are explodes higher then cools then retest support then explodes higher than the last high. It's called trading with higher wavelength
-> Move 1: Started April 2024 when the trend reversal started. $68 -> $89 with around +30% then retraced $90 -> $72 ( -20% )
-> Move 2: July 2024, $72 -> $116 (+61%) then retraced $116 -> $80 ( -31% )
-> Move 3: Jan 2025, $80 -> $146 (+ 82.5%) then retraced $146 -> $108?? ( correction underway ) ~ -26% so far
-> Move 4: Likely from $100-105 to $180-200

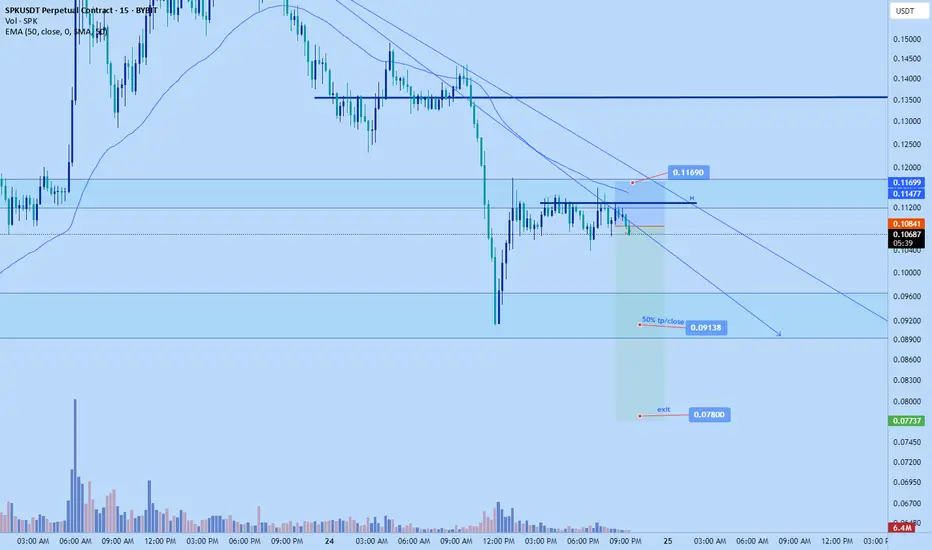
Spk short to $0.078Just recently opened up a short position on SPK. Targeting $0.078
|Scaling out at least 50% at 0.09138-*might full close depending on market reaction
Time sensitive
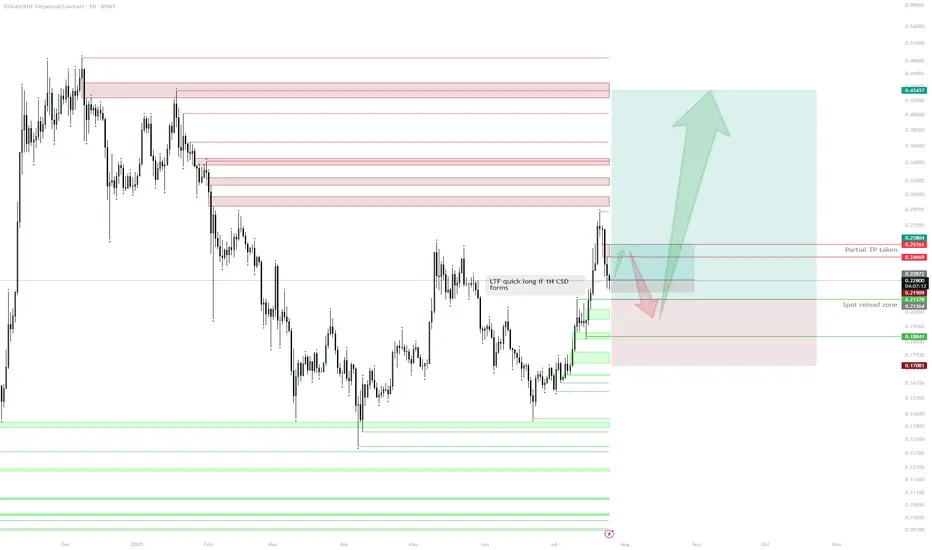
DOGE – HTF Plan & Spot Reload ZoneSpot Position & Realized Profit:
Spot position held from the $0.19 sweep.
Previous long from demand taken and partially realized at $0.26, de-risking the core position.
Current Structure:
After reaching resistance ($0.26–$0.27 zone), price is retracing.
Daily demand/support sits around $0.20–$0.21, with multiple confluences for spot re-accumulation.
Immediate Plan:
Waiting for price to revisit daily demand ($0.20–$0.21) to reload spot and/or open fresh longs.
Watching for a possible lower timeframe (1H) bullish confirmation (e.g., 1H change of structure/1H CSD) as a trigger for a tactical long before daily demand is tagged.
LTF Play:
If price prints a 1H CSD, a quick long up to daily imbalance ($0.24–$0.25) can be considered.
Invalidation:
Loss of daily demand ($0.188) would invalidate the bullish scenario and require re-evaluation.
Upside Target:
If demand holds, looking for moves back into daily supply/imbalance, with ultimate HTF targets at $0.26, $0.32, and higher.
Reasoning:
The core plan is to build spot exposure at strong demand after de-risking on the first move up. The context is that DOGE has shown willingness to bounce at major demand, and with realized profits in the pocket, risk can be managed comfortably on new entries. Short-term, LTF confirmation (such as a 1H CSD) can offer a tactical long back into daily imbalance before the main reloading zone is tagged. Patience and precise triggers are key—no need to rush until price action confirms.
EURAUD SELL!!!targeting a supply zone on the 4hr time frame
Entry : 1.79248
TP : 1.77204
SL : 1.79788

#VET/USDT – Falling Wedge Breakout?#VET
The price is moving within a descending channel on the 1-hour frame and is expected to break and continue upward.
We have a trend to stabilize above the 100 moving average once again.
We have a downtrend on the RSI indicator that supports the upward break.
We have a support area at the lower boundary of the channel at 0.02310, acting as strong support from which the price can rebound.
We have a major support area in green that pushed the price upward at 0.02360.
Entry price: 0.02545
First target: 0.02613
Second target: 0.02739
Third target: 0.02889
To manage risk, don't forget stop loss and capital management.
When you reach the first target, save some profits and then change the stop order to an entry order.
For inquiries, please comment.
Thank you.

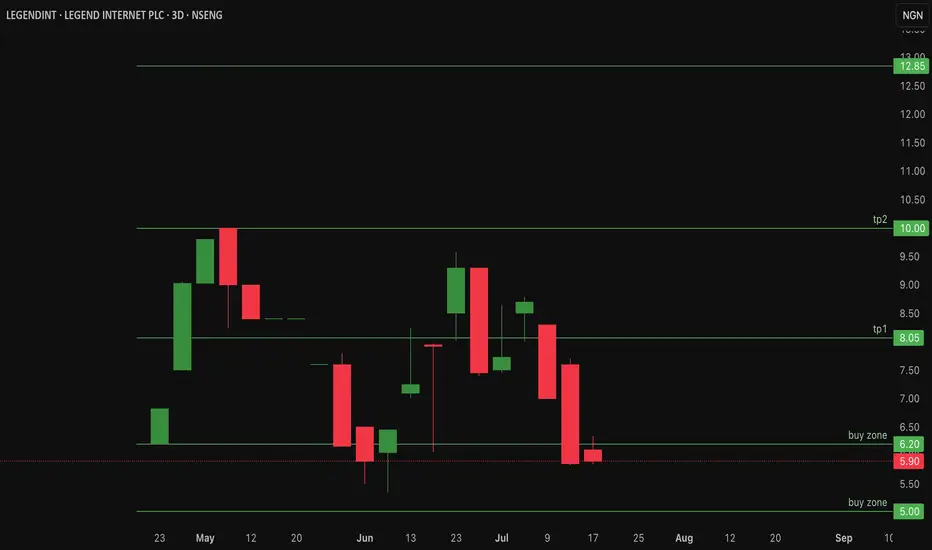
$legendint Could LegendInt be undervalued? - 40% RetracementLegend Internet Plc on the Nigerian Stock Exchange (NGX) was listed on April 24, 2025, under ticker LEGENDINT. The company offers fiber-to-the-home (FTTH) services in Abuja and digital products like LegendMail and MailPay.
IPO price: ₦5.64 per share, closed first trading day at ₦6.20. Previously NSENG:LEGENDINT has reached an all time high of 10naira/share and has currently retraced over 40%
Current price: 5.90
As a newly listed small-cap, it faces low visibility and high volatility, contributing to weak investor demand and price devaluation. It would be interesting to see what the future holds for #legendint.
Upside resistance at 8naira and 10naira per share
Buy zone range is between 5 -6.2naira/share
Price action looks like an inverse cup and handle pattern - Not a bullish pattern!
Invalidation for this Legend Idea is under 5naira per share!
Cable Price Points to keep track off going into NFP/FOMC weekHeading into NFP week we have mixed bias.
Daily sais : BEARISH
Weekly is BULLISH (specially that we closed respecting a +FVG)
Ofc, being an NFP week we trade with care.
Nevertheless i highlighted some key Highs and Lows to keep track of.
Reversal from Daily Trendline50, 52, 54 sees major resistance. As of today, rejection seen in the daily trend line.
Support 1: 48.90
Support 2: 46.30
Support 3: 35
"XAU/USD Hits Major Demand – Is a Relief Rally Brewing?"🟡 XAU/USD (Gold) – Demand Zone Rejection in Play | Bullish Correction Ahead?
Timeframe: 30-Minute | Date: July 25, 2025
Created by: AllyPipsExpert
Indicators: Ichimoku Cloud, BOS (Break of Structure), Dynamic S/R, Trendlines
---
🔍 Technical Analysis & Key Insights:
🔸 1. Market Recap – Distribution & Downtrend Confirmation:
After the Break of Structure (BOS) near 3385, gold confirmed a bearish reversal following the distribution phase at the top resistance zone around 3445–3460.
Bearish momentum was sustained by a descending trendline, paired with a bearish Kumo (Ichimoku cloud) crossover.
🔸 2. Major Zone Tagged – Key Demand Area Tested:
Price has now reached the critical demand block at 3320–3340, a zone that previously initiated bullish impulse on July 18–19.
The current bullish projection (in blue) reflects potential short-term recovery or correction phase, following oversold conditions and historical support strength.
🔸 3. Bullish Reversal Potential – Short-Term Retracement?
The blue arrow reflects a likely bullish retracement toward 3360–3380, aligning with trendline retest and potential Kumo rejection.
Expect sellers to re-enter if price retests former BOS/imbalance zone, creating scalp or swing sell setups on confirmation.
---
🔧 Confluences & Technical Highlights:
Confluence Point Description
Demand Zone Strong previous accumulation at 3320–3340
BOS Retest Area Key liquidity level now acting as resistance
Ichimoku Cloud Price below cloud = bearish bias maintained
Descending Trendline Reinforces bearish structure unless broken
Price Action Rejection wick at demand + potential short squeeze
---
🎯 Trade Outlook:
🧭 Bias: Short-Term Bullish Rebound → Long-Term Bearish Continuation
🟩 Support: 3320 – 3340
🟥 Resistance: 3360 – 3385 (BOS & Trendline zone)
🔁 Scenario: Bounce → Retest → Continuation lower (unless breakout confirmed)
---
📘 Why This Chart Could Be Featured:
✅ Multi-layered Analysis: BOS, zones, cloud, price action, and psychological zones used together.
✅ Forward-Looking: Projects the next logical market reaction instead of just explaining the past.
✅ Clean, Structured, Educational: Layout and visuals guide the viewer through logical trade steps.
✅ Value-Packed: Provides actionable levels and flexible scenarios — helpful to traders of all levels.

What next on XAUUSD? What’s the next possible move on XAUUSD as we saw a slight drop above the all time high this week? We a break below $3200. I anticipate a further decline due to high selling pressure.

SAHARA/USDT - 2nd buy setup has already delivered a strong +100% move from the initial buy setup. Currently, the price is retesting the previous resistance level, which is now flipping into a strong base support — a classic bullish retest. This zone also acted as the breakout point for the recent parabolic leg, indicating strong interest from buyers. A green box has been marked for the next potential entry, anticipating the continuation of the bullish trend. If the support holds, the next leg could lead to another explosive move upward.

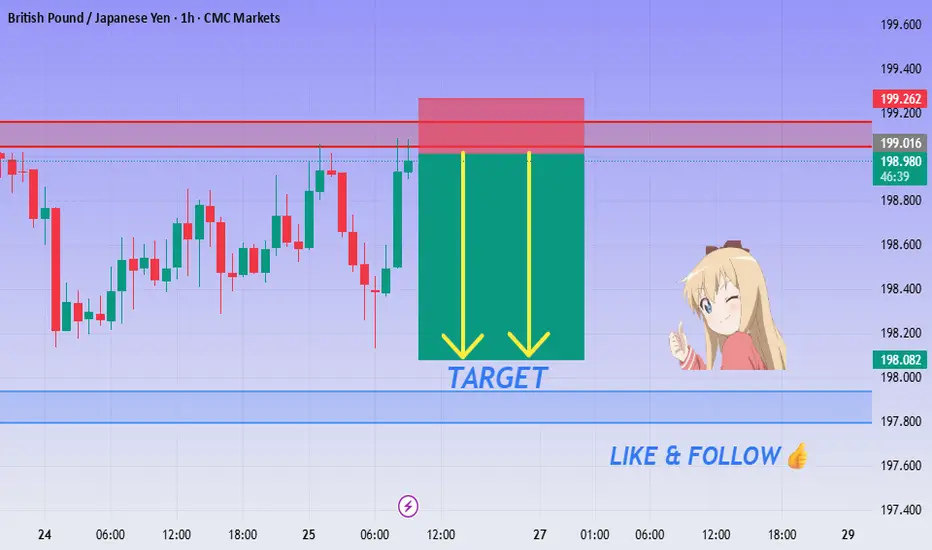
GBP/JPY Breakdown Alert - Bears Taking Control!💙 GBP/JPY Resistance Rejection ! SELL Setup Activated!
👩💻 Dear traders,
After analyzing GBP/JPY on the 1H timeframe, we have a clean short opportunity developing from a key resistance zone around 199.00 – 199.26. Price has stalled and rejected strongly, signaling potential for a bearish move.
Bias – Bearish
🎯 Target – 198.20
🎯 Target – 197.90
🎯 Final Target – 197.70
🛑 Safe Stop Loss – 199.26
📊 Reasoning:
– Price rejected a clear resistance/supply zone
– Red box marks historical rejection area
– Yellow arrows indicate downside momentum zone
– Bearish pressure forming at the top of the range
– Excellent intraday short with clean R:R structure
🍀 Stay patient, trust your levels, and trade smart!
LTC vs ETH : Bottom ? Hello:
Good ? me no or yes.
ETH vs LTC.
Eth is good but LTC ? LTC is a giant which sleep.
The chart show us a possible H&S pattern inverted.
My view is something like it.
If you want be safe, enter when red line is break.
GL

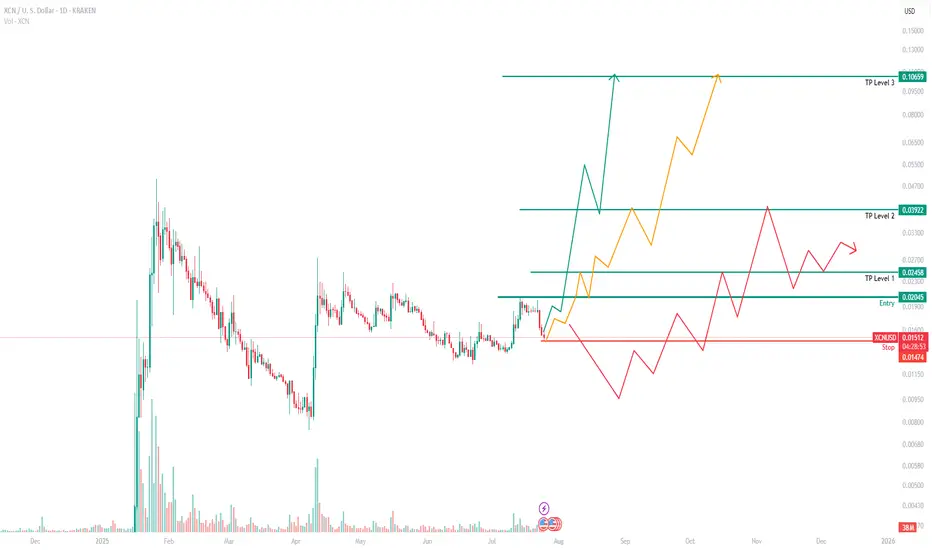
XCN: A potential 4x returnAt Ralfetto, we see so many charts daily, but few remind us of XRP. XCN is just that. XCN reminds us of XRP in its early days when you could purchase 1 XRP for under 1c.
As a project, we are unaware of the fundamentals, only what the chart is telling us, and its showing bullishness against BTC, XRP, XLM and other currencies we feel have a long strong future forward.
In short:
Buying range, between 0.012 and 0.019
Latest entry - 0.02
Target Price 1 = 0.024
Target Price 2 = 0.038
Target Price 3 = 0.10
There could be overperformance given how small the market cap and cost is, but XCN has all the ingredients to give traders some healthy returns.
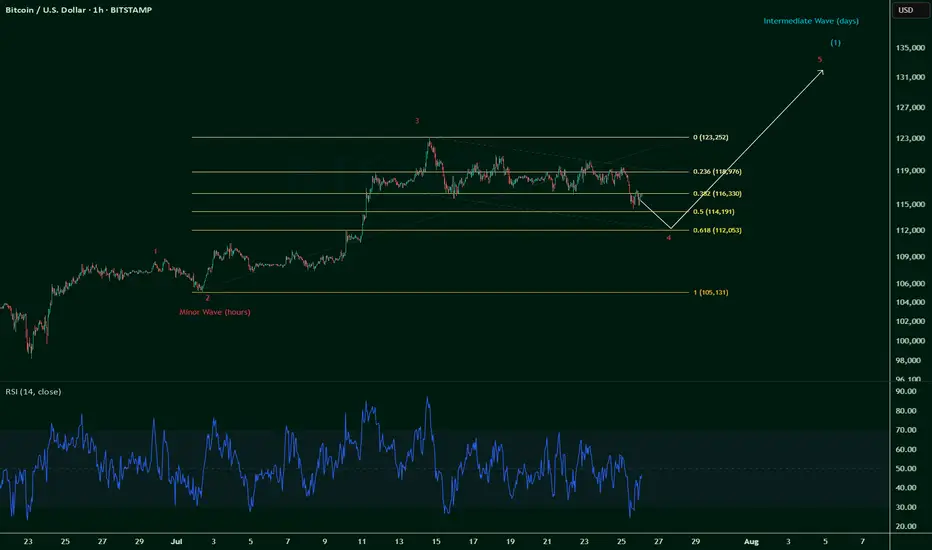
$BTC breaks $115k invalidates Wave 5 -- still Wave 4 correction.So it was a long squeeze after all, and one that was coming.
The initial thoughts were that we're on a Wave 5 up and counting:
But we're brought back down to earth as CRYPTOCAP:BTC breaks below $115k, invalidating a Wave 5 count.
So, it's official: we're still on a Wave 4 correction, which can go as low as 0.618 fib towards $112k.
Now painting a likely scenario given that Wave 2 correction only moved 0.236 fib ~ 0.328 fib (Wave 2 & Wave 4 often contrast):
This could play out till end July or even all the way into early August, which if comes to fruition, could signal for a bullish August.
And August has historically almost always been a bearish month (8 red historical months out of 12).
Pinch me.
Binance coin has dropped from $800 ┆ HolderStatBINANCE:BNBUSDT surged from $532 support and is now battling $550 resistance. A daily close above $550 opens upside targets near $567. Rejection may drag price back into the $532–$537 range. Bias remains bullish while inside the current trend channel.

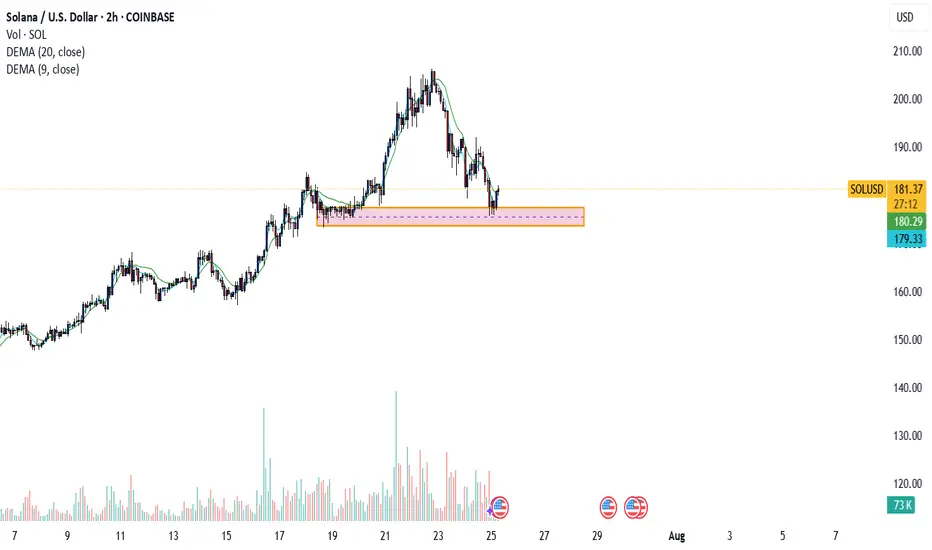
SOL TO THE MOONthe solana has urged a retracement , going back to its key zone, the next bullrun will explode the price of solana, make sure you have enough sol in your wallet
Gold. Could this be the final "shape" of triangle? 26/July/25XAUUSD. back to previous ideas that we possible having a contracting /symmetrical triangle pattern on gold chart..Probarly a "big surprise" on 31 July FED/FOMC meeting?
