DJ30/US30 LONG Reason for trade:
1. Expanding flat in play
2. Equal highs (LIQUIDITY)
3. Currently at the order block area (Ready)
Entry: 43647
Stop Loss: 43386
Take Profit: 45246
Strategy: Wait for a 30 minute engulfing candle closure.
Once in profit of 1:1 R, place the trade at BE
Blessings, in CHRIST.
Community ideas

Xlm -Just hit my T2 target7/23- My first post
-Xlm was $.42
7/24- T2 (top of range) hit $.4
7/27-Pumped 15%
as anticipated
8/1 -T2 bottom Hit (WT)
Could go lower and hit WT Low...
But I love it when a plan comes together.
I hope my T3 doesn't get hit (after this bounce).
May the trends be with you.

[SeoVereign] BITCOIN BULLISH Outlook – August 1, 2025We are the SeoVereign Trading Team.
With sharp insight and precise analysis, we regularly share trading ideas on Bitcoin and other major assets—always guided by structure, sentiment, and momentum.
🔔 Follow us to never miss a market update.
🚀 Boosts provide strong motivation and drive to the SeoVereign team.
--------------------------------------------------------------------------------------------------------
Hello.
This is SeoVereign.
My fundamental view on Bitcoin, as mentioned in the previous idea, is that I am anticipating an overall downward trend. In the mid- to long-term, I believe the downward pressure will gradually increase, and this is partially confirmed by various indicators and the overall market sentiment.
However, before we fully enter this downward phase, I have been judging that one more upward wave is likely to remain. I have focused my strategy on capturing this upward segment, and I have recently reached a point where I can specifically predict the development of that particular wave.
If this upward move unfolds successfully, I plan to set my take-profit range conservatively. The reason is simple: I still believe there is a high possibility that the market will shift back into a downtrend afterward. The core of this strategy is to minimize risk while realizing profits as efficiently as possible toward the tail end of the wave.
The relevant pattern and structure have been marked in detail on the chart, so please refer to it for a clearer understanding.
In summary, I view this rise as a limited rebound that could represent the last opportunity before a downturn, and I believe this idea marks the beginning of that move.
I will continue to monitor the movement and update this idea with additional evidence. Thank you.

BTC ProgramBTC will correct itself at a low of approximately $110K, and then will make an ATH of $133k.
After this ATH, you will witness a sharp drop up to $95.5k.

Analysis of gold market operation strategies and ideas next week
Gold rallied unilaterally on Friday following positive non-farm payroll data, reaching a new high for the week. This week's candlestick formed a hammer pattern, suggesting further upside potential next week. Bulls continued their push late Friday, closing at 3363. Next week, we will continue to monitor short-term resistance around 3370-3375. We will continue to buy on pullbacks. If your current trading is not satisfactory, I hope I can help you avoid investment setbacks. Welcome to discuss your options!
Based on a 4-hour analysis, short-term resistance will be seen around 3370-3375 next week, with a key resistance around 3395-3400. We will continue to buy on pullbacks. In the intermediate range, we recommend maintaining a cautious wait-and-see approach. I will provide detailed trading strategies during the trading session, so please stay tuned.
Gold Trading Strategy:
Go long on gold pullbacks to 3330-335, with a stop-loss at 3318 and a target at 3370-3375. Hold on if it breaks above this level.

AUDNZD Technical + Fundamental Align for DownsideToday I want to analyze a short position on the AUDNZD ( OANDA:AUDNZD ) pair, first, let's look at it from a fundamental analysis perspective .
Fundamental View on AUDNZD
Key reasons to short AUDNZD:
Australian weakness:
Recent data show weakening consumer sentiment and declining building approvals. The RBA seems hesitant to hike further, putting pressure on the Aussie.
New Zealand resilience:
The RBNZ maintains a relatively hawkish stance. Inflation is still a concern, and the central bank is committed to keeping rates high, supporting NZD strength.
Monetary policy divergence:
The divergence between RBA’s dovish stance and RBNZ’s hawkish approach supports further downside in AUDNZD.
----------------------
Now let's take a look at AUDNZD from a technical analysis perspective on the 4-hour timeframe .
AUDNZD is currently trading in a Heavy Resistance zone(1.0963 NZD-1.0870 NZD) near the upper line of the Range Channel , Potential Reversal Zone(PRZ) and Yearly Pivot Point .
In terms of Elliott Wave theory , AUDNZD appears to be completing microwave B of microwave Y of the main wave 4 .
I expect AUDNZD to drop to at least 1.0904 NZD(First Target) based on the above explanation .
Second Target: 1.0886 NZD
Note: Stop Loss(SL): 1.0963 NZD
Please respect each other's ideas and express them politely if you agree or disagree.
Australian Dollar/New Zealand Dollar Analyze (AUDNZD), 4-hour time frame.
Be sure to follow the updated ideas.
Do not forget to put a Stop loss for your positions (For every position you want to open).
Please follow your strategy and updates; this is just my Idea, and I will gladly see your ideas in this post.
Please do not forget the ✅' like '✅ button 🙏😊 & Share it with your friends; thanks, and Trade safe.

Update on the previous analysis.Our analysis hasn’t changed much since yesterday — we still believe the price will reach the $3,330 zone unless buying volume increases significantly and this area turns out to be a fakeout.
The End of BTC correction? BTC analysis 2/8/2025In my point of view, BTC has completed its correction and is now ready for a strong upward move, potentially targeting the $137,000–$139,000 range, based on the following factors:
1. Confirmation of the Butterfly Harmonic Pattern
The recent reversal occurred within the expected range of the Butterfly harmonic pattern. Typically, the XD leg in a Butterfly harmonic extends to 1.27, but in practice, this can stretch up to 1.414, which is commonly used as a flexible stop-loss zone. After testing the 1.27–1.414 range, a clear 5-wave impulse followed—testing a key trendline and making an attempt to break above the recent high. This sequence, followed by a corrective move, suggests that the broader correction may be complete.
2. Complex WXYXZ Correction Structure
In my previous analysis, I underestimated the duration and depth of the correction. The wave (4) (blue), which is part of the wave (iii), has taken considerable time—likely to allow wave (5) to extend sufficiently to break above the $130,000 level. This would support the assumption that wave (5) (purple) is the extended wave. The overall corrective structure appears highly complex, and can be counted as a W–X–Y–X–Z pattern, supported by the presence of multiple internal corrections within the wave components.
3. 0.618 Fibonacci Retracement of Wave (3)
Wave (4) has now reached the 0.618 Fibonacci retracement level of wave (3), which is significant. Historically, BTC’s corrections rarely retrace beyond the 0.87 level. This deep retracement suggests wave (4) is likely complete—unless price were to fall below that threshold, which would invalidate this assumption.

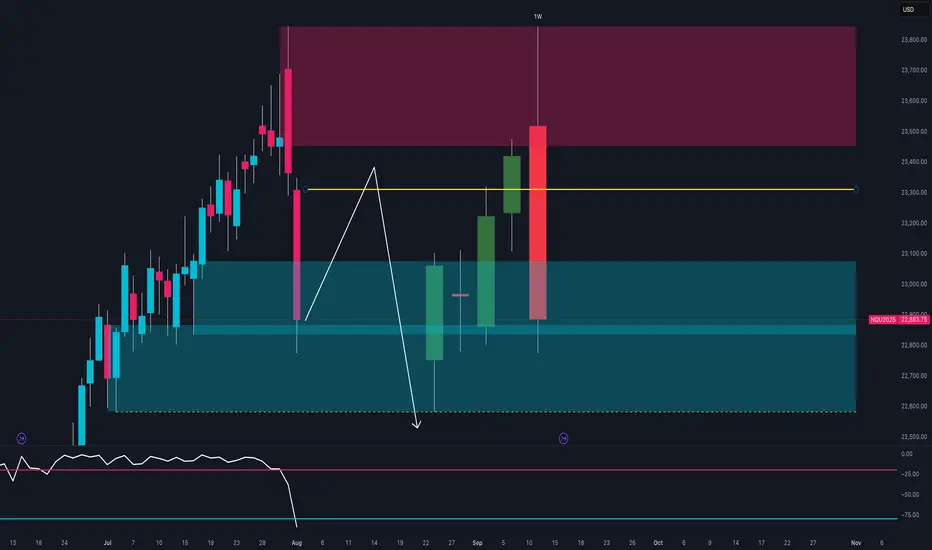
NASDAQ at Key Turning Point 🔍Technical Context
After testing the 23,600–23,800 supply zone, price printed a strong bearish rejection with a weekly engulfing candle.
The RSI broke decisively below the midline, signaling a clear loss of momentum.
Price is now trading back within the weekly demand zone between 22,800 and 22,950.
If a pullback toward 23,200 occurs, it could offer a fresh short opportunity, with downside targets around 22,600.
🪙 COT Report – July 29
Non-Commercials (speculators):
Long: +8,581
Short: +4,355
Commercials (hedging):
Long: +4,955
Short: +8,556
The market remains net long, but commercials are increasingly hedging with shorts.
The current imbalance — 88.6% long vs 11.3% short — suggests excessive bullish positioning, raising the risk of a correction.
🗓️ Seasonality – August
August is historically strong for the NASDAQ:
+222 pts (10Y)
+400 pts (5Y)
+912 pts (2Y)
While the trend is clearly bullish seasonally, caution is warranted:
Tops are often formed during the first half of August, followed by more pronounced corrections in September.
📉 Operational Summary
Primary scenario:
Wait for a retest of the 23,200–23,250 area
Look for rejection signals → enter short
Target 1: 22,800
Target 2: 22,600
Alternatively:
If 22,800 breaks on a strong weekly close, deeper downside scenarios may unfold.
XRP/USD Breakout Watch: $3.22 Target in SightA key blue trendline on the XRP/USD chart that reflects market sentiment. If price breaks above it with strong volume, we could see a rally toward $3.22.
Support zone: $0.55–$0.60
Bullish case: Improved sentiment, easing tariffs, and regulatory cooling
Strategy: Wait for breakout confirmation before entering
Share your thoughts — are you preparing for a breakout?

XRP VS AI ?Hi,
This is fun, come on XRP $4.95
Average Speed (Points/Day) 0.053
Retracement Amount (Points) 0.80
Retracement % 51.28%
Probability of Retracement % 5-10%
Projected Next Move Size (Points) 2.09
Next Projected High Price 4.95
Estimated Duration to Next Target 39.4 days
Projected End Date 2025-09-10
All the best
Not a guru

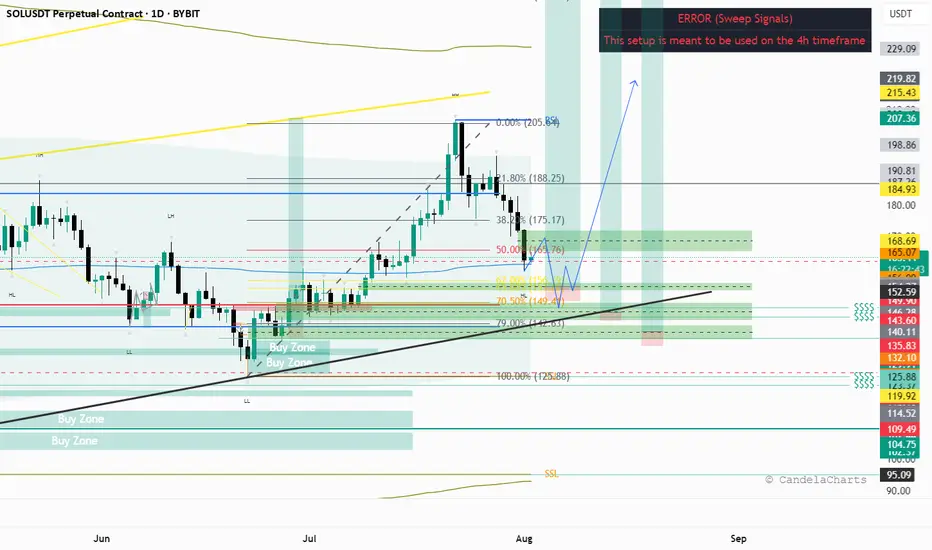
SOL Sol next move idea.
Sol's final leg down before the final leg up for this bullrun. Fill the daily imbalances come to 70 % fib retracement level also a volume POC on a discount area below 50% of the dealing range and the daily trendline.
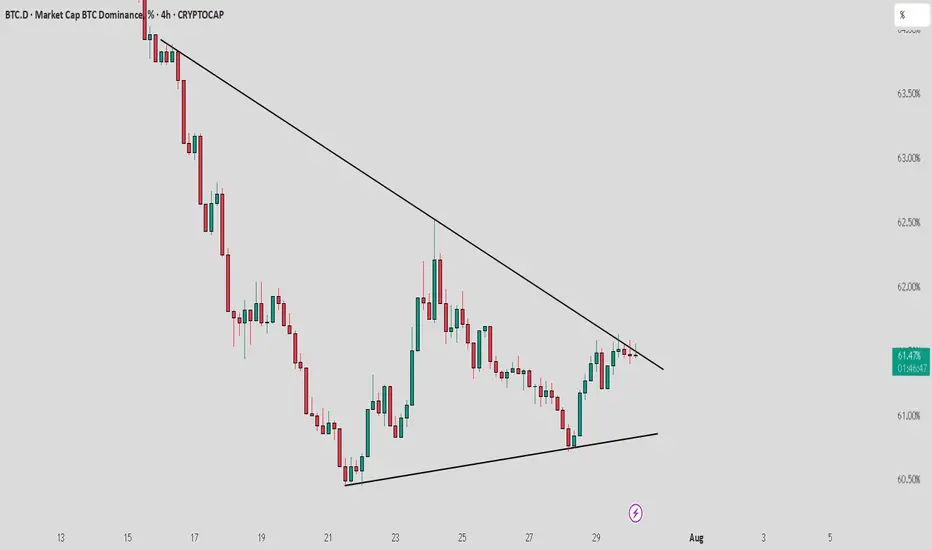
BTCDOM : Near to breakout from trendline resistanceBitcoin dominance is nearing a breakout from trend line resistance. Keep a close watch as a breakout from here could lead to a short-term market correction, negatively affecting altcoins. Stay cautious with your long positions and use proper stop loss strategies.
KEEP A CLOSE WATCH ON IT

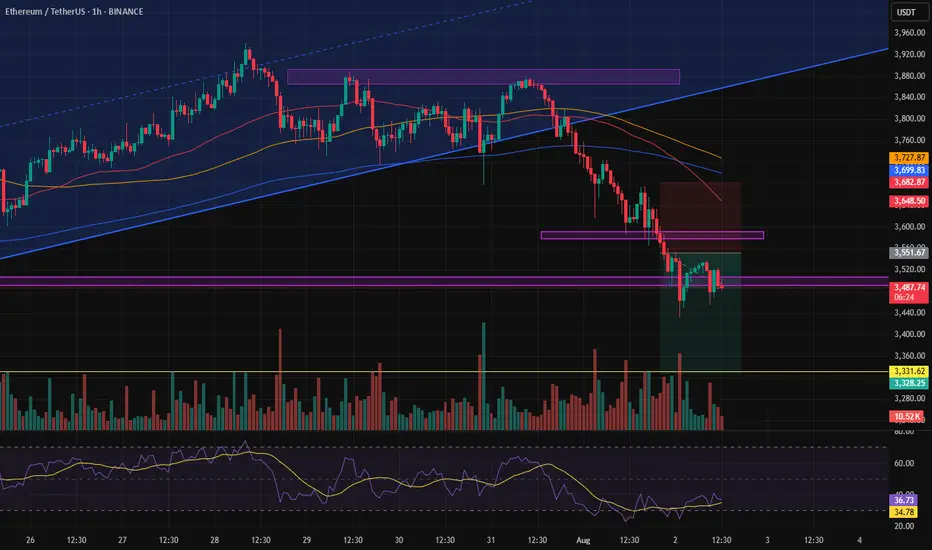
ETHUSD - CURRENT OUTLOOK ON ETHEREUMI am currently expecting the dollar to slowly regain strength, and while this is happen, I expect institutions/large funds to begin profit taking from these price ranges.
"May fortune attend thee, and thy trade prosper." .......L2Earned

GBP/USD: Post-Impulse Sell Setup from Ending DiagonalThe chart depicts a completed 5-wave impulsive structure, culminating at the top of wave (5). The internal wave structure of the final fifth wave forms a classic ending diagonal pattern, typically signaling a trend reversal or deep correction.
After this extended fifth wave, the price has started rolling over, confirming the start of a corrective decline. The wave count now expects an ABC correction targeting the previous wave 4/2 demand zone, highlighted in red.
Target 1 (T1): 1.33608
Target 2 (T2): 1.32436
Stop Loss (SL): 1.35988
Ending diagonal at the top of wave (5) signals exhaustion of bullish momentum.
Clear bearish divergence (not shown here) is commonly seen with this pattern.
The price has broken the short-term structure and is now forming lower highs.
Target zone aligns with previous wave 2 consolidation – a typical retracement zone for post-impulse corrections.

RNDR/USDT at a Critical Turning Point: Golden Pocket as the Key?✨ Overview:
Render Token (RNDR) is currently testing a crucial support zone — the Golden Pocket Fibonacci Retracement between 0.5 (3.616) and 0.618 (3.385). This zone not only represents a significant retracement level but has historically acted as a strong demand area, often serving as a springboard for major price reversals.
---
🧠 Detailed Technical Analysis:
🔸 Support Zone & Golden Pocket
Price has retraced back to the 0.5 – 0.618 Fibonacci zone, a high-probability reversal area.
This zone has acted as a demand base multiple times since February 2025.
How the price reacts here will likely define the next major trend direction.
🔸 Market Structure
The overall structure shows a mid-term downtrend, marked by lower highs and lower lows.
However, the current price action shows slowing bearish momentum, indicating potential hidden accumulation.
A potential double bottom pattern could be forming, hinting at a bullish reversal if confirmed.
---
📈 Bullish Scenario:
1. Strong Rebound from the Golden Pocket
Watch for bullish candlestick patterns (e.g., pin bar, bullish engulfing) near $3.38–$3.61.
Initial resistance levels: $4.16 – $4.72
If broken, mid-term targets could extend to $5.47 – $6.68
2. Double Bottom Confirmation
A confirmed double bottom with a neckline breakout around $4.16 would greatly strengthen bullish momentum.
3. Increased Buying Volume
A spike in volume during the rebound would validate bullish sentiment and potential trend reversal.
---
📉 Bearish Scenario:
1. Breakdown Below the Golden Pocket
If the price breaks below $3.385 with strong volume, we could see a move down toward $2.77, the next significant support.
2. Weak Bounce / Lower High
A failed breakout above $4.16 may indicate a bearish continuation after a temporary relief rally.
---
📌 Summary:
RNDR is currently at a technically sensitive zone. The Golden Pocket between $3.38 and $3.61 is the key area to watch. A strong bullish reaction could signal the start of a trend reversal, while a breakdown could trigger further downside continuation. Traders are advised to wait for clear confirmation via price action before committing to any strong positions.
---
🔖 Key Levels to Watch:
Level Description
3.38 – 3.61 Golden Pocket (Potential Buy Zone)
4.16 Minor Resistance
4.72 Bullish Breakout Trigger
5.47 – 6.68 Mid-Term Reversal Targets
2.77 Strong Support if Breakdown Occurs
---
🧩 Chart Patterns Observed:
Potential Double Bottom – early bullish reversal signal.
Golden Pocket Reaction Setup
Descending Structure – still intact but weakening.
---
🔍 Trade Ideas:
🔄 Wait-and-see approach: Wait for clear bullish confirmation on daily candles.
🎯 Aggressive Long Entry: Around 3.40–3.60 with a tight stop-loss.
⚠️ Short Opportunity: If a strong breakdown below 3.38 occurs with volume confirmation.
#RNDR #RenderToken #RNDRUSDT #CryptoAnalysis #GoldenPocket #FibonacciRetracement #DoubleBottom #PriceAction #SupportResistance #AltcoinSetup #CryptoSignals #TechnicalAnalysis

Nasdaq is retracing to lower channal line.Nasdaq is retracing to lower channal line. This fall is attributed to Tarrif war.

BTC Daily Elliott Wave CountAs mentioned in my analysis on youtube post on Total Market Cap short-term, the daily bullish case is now verified, canceling the bearish case with a break through the daily bearish invalidation level.
This past week price action suggests a move towards the completion of a blue wave x. Make sure to check out my latest analysis on short-term Crypto Total Market Cap.
The link to the chart:
Bullish Count

BTC | Swing Plan UpdatePrice failed to break out above 1D supply and sharply rejected, losing key 4H demand at $117,300.
HTF demand at $109,000 (1D FVG + BOS + S/R) is the next major area of interest—this is where I’ll look for fresh swing setups if the market flushes further.
No need to rush new positions until a clean setup prints or levels are reclaimed.
Plan:
Wait for price to test $109,000 zone before considering a swing long.
Only consider LTF scalp longs if we reclaim the 4H BOS at $118,300.
Stay flat until high-probability entry, let the market show its hand.

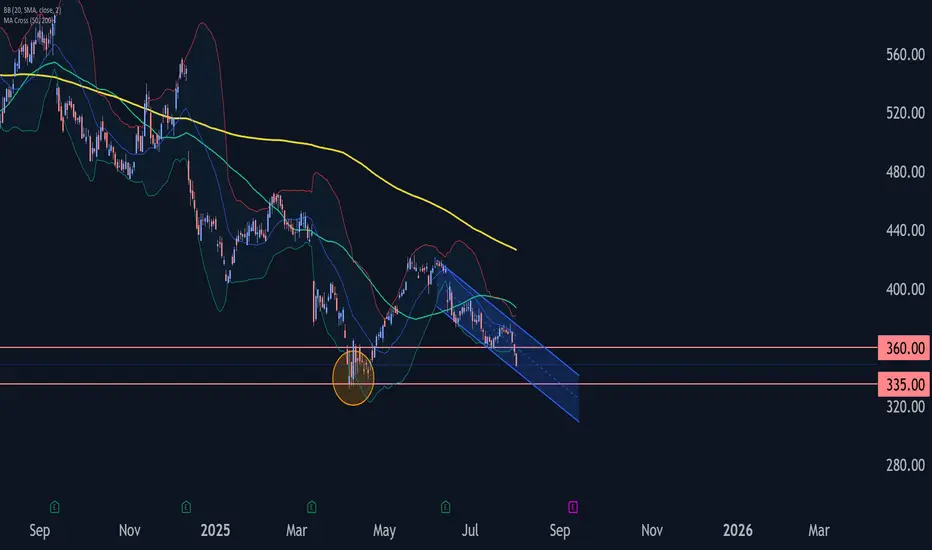
Adobe Wave Analysis – 1 August 2025- Adobe broke the key support level 360.00
- Likely to fall to support level 335.00
Adobe recently broke below the key support level 360.00 (which stopped the previous minor impulse wave i at the start of July).
The breakout of the support level 360.00 accelerated the active impulse wave C of the medium-term ABC correction (2) from the end of May.
Given the strong daily downtrend, Adobe can be expected to fall further to the next support level at 335.00 (the double bottom from April and the target for the completion of the active impulse wave C).
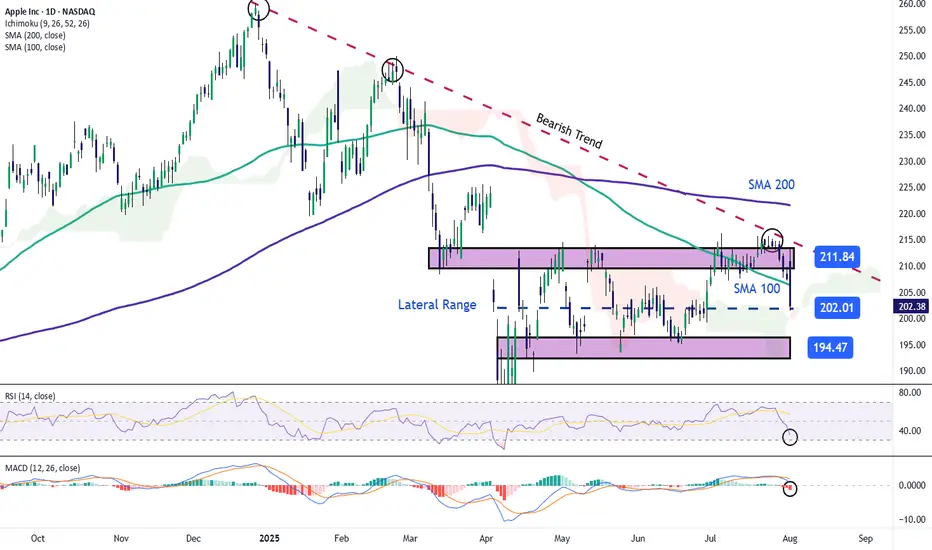
Apple Stock Falls Despite Strong EarningsApple stock is down more than 4% in the final session of the week, following the company’s earnings release yesterday. Apple reported earnings per share of $1.57, beating expectations of $1.43, while total revenue reached $94.04 billion, surpassing the $89.53 billion forecasted by the market.
However, despite the strong results, the stock is once again facing a notable short-term bearish bias as investor concerns grow. The primary issue is the perception that Apple is falling behind in the race for artificial intelligence, especially compared to its main competitors. In addition, shortly after the earnings announcement, it was noted that the company may face challenges in sustaining growth throughout the remainder of 2025, which has fueled additional downward pressure on the stock.
Sideways Range Emerges
In recent weeks, Apple’s price action has consolidated within a clear lateral range, with resistance around $211 and support near $194. So far, price fluctuations have not been strong enough to break this structure, and the latest bearish candlestick has reinforced the validity of the channel. For now, this sideways range remains the most relevant technical formation to watch in the upcoming sessions.
Technical Indicators
RSI:
The RSI line is falling rapidly and is now approaching the oversold zone at the 30 level. If the indicator reaches that threshold, it could suggest a technical imbalance, opening the door to a short-term bullish correction.
MACD:
The MACD histogram has moved into negative territory in recent sessions, suggesting a clear dominance of bearish momentum in the moving average structure. If this persists, selling pressure may continue to build in the near term.
Key Levels to Watch:
$211 – Main Resistance: Upper boundary of the current range. A breakout above this level could trigger a stronger bullish trend.
$200 – Psychological Support: Round number zone, a breakdown here could activate an immediate bearish bias for the next sessions.
$194 – Key Support: Corresponds to recent weekly lows. A move below this level would likely confirm a more extended bearish trend.
Written by Julian Pineda, CFA – Market Analyst
USDCHFUSD/CHF Bullish Bias — Price is holding above demand with market structure showing higher highs and higher lows. COT data supports continued USD strength. As long as demand holds, expecting further upside towards next resistance.
