Xrp - The final bullish breakout!💰Xrp ( CRYPTO:XRPUSD ) will create new all time highs:
🔎Analysis summary:
After a consolidation of an incredible seven years, Xrp is finally about to create new all time highs. With this monthly candle of +40%, bulls are totally taking over control, which means that an altcoin season is likely to happen. And the major winner will simply be our lovely coin of Xrp.
📝Levels to watch:
$3.0
🙏🏻#LONGTERMVISION
SwingTraderPhil
Community ideas

USDJPY: Breaking Out With Macro Backing 🟢 USDJPY | Breakout Opportunity Above Resistance
Timeframe: 1H
Bias: Bullish
Type: Break and Retest
📊 Technical Setup
USDJPY is currently consolidating at a key 4H resistance zone (147.75–147.90). A clean breakout and retest of this area will confirm bullish continuation.
• Entry: Above 147.90 (after confirmed candle close + retest)
• SL: Below 147.30
• TP: 148.90 / 149.60
• RR: ~1:2.5
• Indicators: RSI showing strong upside momentum, holding above 50
🧠 Fundamentals + Macro Confluence
• USD Strength: Strong macro & delayed rate cuts support USD upside
• JPY Weakness: BOJ remains dovish; risk-on sentiment weighing on JPY
• COT + Conditional Score: USD score increased to 17, JPY dropped to 8
• Risk Sentiment: VIX at 14.2 = RISK ON → bearish JPY bias
🧭 Gameplan
“Wait for confirmation above resistance before entering”
🔔 Set alerts around 147.90 and monitor lower timeframes for retest and bullish candle structure.

GBPCHF TRADE IDEA We were in on a continuation trade to the downside on GBPCHF.
Price moved back to our Fibonacci level and pulled back down south.

AUDUSD Technical & Order Flow AnalysisOur analysis is based on a multi-timeframe top-down approach and fundamental analysis.
Based on our assessment, the price is expected to return to the monthly level.
DISCLAIMER: This analysis may change at any time without notice and is solely intended to assist traders in making independent investment decisions. Please note that this is a prediction, and I have no obligation to act on it, nor should you.
Please support our analysis with a boost or comment!

Gold Market Holds Bearish Structure Below 3291Gold market continues to hold firm within the bearish channel, with 3291 acting as a supply zone, maintaining pressure down toward 3269. As long as this zone remains unbroken, bearish momentum stays in play.
🔍 Key Insight:
3291 = active supply resistance
3269 = short-term target if sentiment holds
follow for more insights , comment and boost idea

$ENPH About to make new highs Enphase trades inverse crypto and the crypto trade is coming to a quick end. Stored energy theory states during times of excess energy BTC will thrive. We are now in a new regime of AI energy cost and ENPHASE has the best batteries to scale. Minimum Target $550
Positions
1130 ENPH $50 Calls for 10/17/2025
511 ENPH $100 Calls for 01/15/2027

CIRCLE Stablecoin Revolution Circle is more than a crypto firm—it’s building infrastructure for a regulated digital dollar economy. With transparent reserves, global licenses, deep financial integrations, and robust blockchain functionality, USDC is rapidly positioning itself as a cornerstone of future finance.
I see a longer term potential for a great investment opportunity given the coming banking revolution involving stable coins.
For a lower risk entry, after a nearly 40% decrease in less than a week, the stock price is currently supported at the VWAP from the original IPO release.
Should the trend continue higher, I would prefer to see a bounce here on the stock.

Is the uptrend complete? Will there be a pullback?On the last trading day of this week, gold prices soared, rising nearly $56, driven by the non-farm payroll data. The rally began at 3300 and peaked near 3356. The price has now retreated slightly, fluctuating around 3345.
The current uptrend has repeatedly tested the resistance level near 3355 but has failed to break through. The RSI indicator hovered around 76.8, indicating a gradual flattening of the upward trend. The 3355 high is likely the end of this uptrend.
As this is the last day of a major data week, Quaid believes the current uptrend is complete. Consider a light short position around 3350-3355. The current low has yet to be confirmed, and the pullback is likely to end around 3335.
However, we cannot rule out the possibility that the price will remain within the upward channel with slight fluctuations on the last trading day of the week.

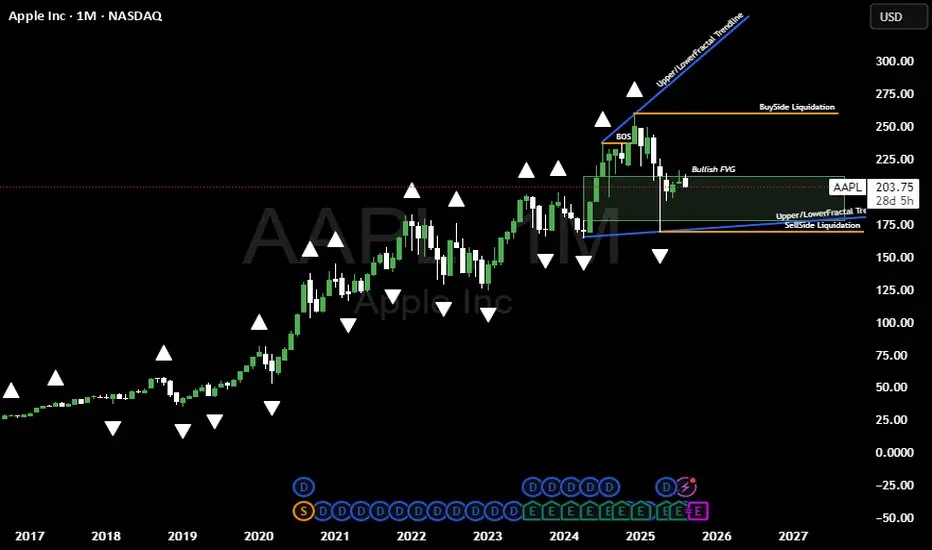
Bullish Idea on APPLNASDAQ:AAPL / Lovley day its been a while, am planing to share my views on the markets atleast once a week from now going forward. Basically on this bias idea above here @LutthMage we are leaning more on long term holding, WITH AN ADVANTAGE OF TAKING SHORT TERM TRADES BASED ON OUR LONG TERM INVESTMENT IDEA WE ARE SURE YOU WILL UNDERSTAND AS TIME GOES BY.
NOW LET THE GAMES BEGIN```
On the chart above we a basically bullish due to 4 reasons
1. The trend is our friend its currently bullish, because AAPL is BREAKING STRUCTURE NO VISIBLE Change of character as of yet
2. We got a widening channel currenly bouncing of the lower level line of the channel.
3. Price is playing around a Bullish FVG
4. APPLE JUST CREATED SELL SIDE LIQUIDITY.
We will keep you posted on the short term trades we execute based on this bullish bias on APPL, ofcourse only if they do appear for now we sit and do the hardest thing to do wich is NOTHING.
AS TIME GOES BY YOU WILL CHARACTERIZE A WASH RINSE AND REPEAT PROCESS FROM US @LutthMage NASDAQ:AAPL
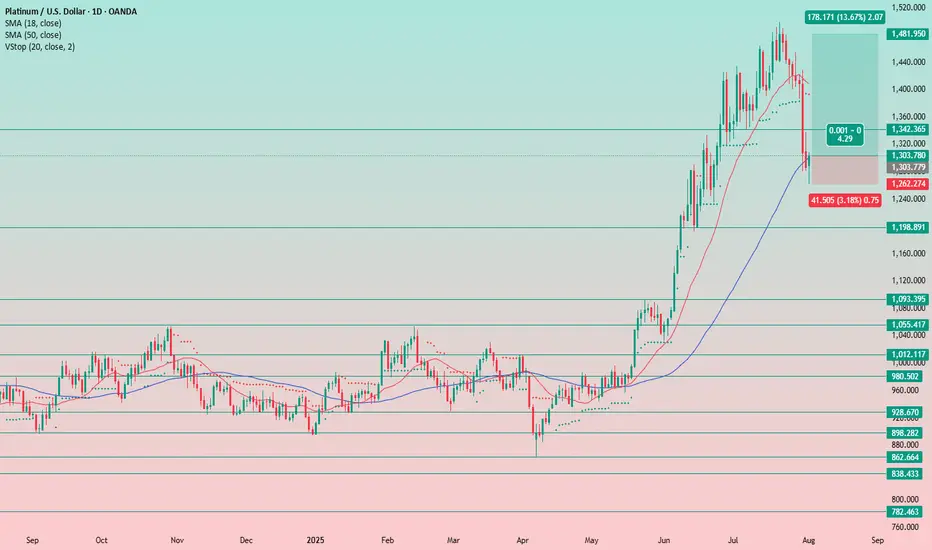
Platinum Still Has Room to RunJust like with silver, the potential for further growth in gold remains, despite the setbacks of recent days.
It seems the precious metals market didn’t mourn the Fed’s decision and subsequent press release for long.
The uptrend remains intact, and the previously supportive factors are still in play.
Even amid the negative news, there was no sharp sell-off — everything stayed within the trend. This clearly signals that rate cuts are on the horizon, and metals are likely to continue their upward move.
I’m in favor of continued upside.
Stop-loss is placed below yesterday’s low — now we wait for higher levels.
GBPUSD: Bearish Continuation & Short Signal
GBPUSD
- Classic bearish setup
- Our team expects bearish continuation
SUGGESTED TRADE:
Swing Trade
Short GBPUSD
Entry Point - 1.3264
Stop Loss - 1.3287
Take Profit -1.3218
Our Risk - 1%
Start protection of your profits from lower levels
Disclosure: I am part of Trade Nation's Influencer program and receive a monthly fee for using their TradingView charts in my analysis.
❤️Please, support our work with like & comment! ❤️

Gold Price Target: 3380-3400+, Set a Trailing StopGold Price Target: 3380-3400+, Set a Trailing Stop
As shown in Figure 4h:
Gold finally rallied this weekend.
Despite recent heavy losses for long positions, the past two days have been encouraging.
We ultimately managed to successfully buy the dip in the 3280-3300 range and recover all our losses.
Gold prices continue to rise, and everyone is asking if it's time to sell.
Now is the critical time to exit.
We must acknowledge one fact:
Gold currently presents a huge opportunity.
Of course, the risks are also increasing.
At times like these, I always emphasize that the best approach is to set a 10-point trailing stop.
Even if gold prices soar, we can move with them.
This non-farm payroll data was a huge disappointment.
It was a truly positive surprise for gold.
The market expected 110,000 new jobs, but the result was a disappointing 73,000, a decrease of half from the previous month.
The market went into a tizzy after the outperformance. But even more shocking news is yet to come: Non-farm payrolls for May and June were revised downward by a combined 258,000.
This means the June gain was revised downward from 140,000 to 14,000.
The May gain was abruptly revised downward from 140,000 to 19,000.
The strong data of the past two months was completely false.
Market followers have become the "clowns" of the Fed and Trump.
Now you understand why everyone praised Powell's hawkish speech two days ago.
Because Powell said: "Only if there is a severe decline in employment will we consider cutting interest rates."
Just this Wednesday, some good non-farm payroll data was released.
This undoubtedly gave the market a false impression.
Everyone believed that a rate cut was impossible, and the probability of a September cut had dropped to 40%.
However, today's poor non-farm payroll data, combined with revisions to May and June data, revealed the truth.
The job market has been dismal over the past quarter.
The market reacted quickly, and gold prices soared on this sentiment.
My advice is to buy gold at a low price and hold on.
For investors who have successfully bought in the 3280-3300 level in recent days, I recommend setting a 10-15 pip trailing stop-loss.
Gold prices are likely to continue their upward trend next Monday.
Our next target is above 3380-3400 points.

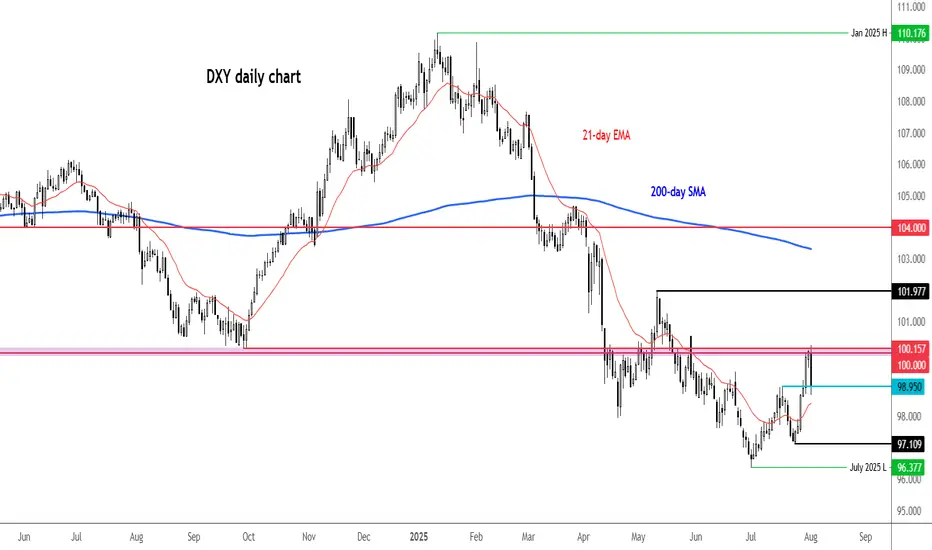
What now for the dollar after a poor NFP report?It is difficult not to link the bad US data to the impact of tariffs. Indeed, it certainly looks that way, especially given that the slowdown in jobs started in early Q2 when reciprocal tariffs were announced. Companies expecting margins to be squeezed by higher duties probably thought twice about hiring workers in order to keep costs down. So, the US labour market has been losing steam fast, undoubtedly due to tariff concerns. Unless the data surprises on the upside soon, the Fed may have no choice but to cut—and cut again. Against this backdrop, the recovery in the dollar is going to a long bumpy road.
We noted the area around 100.00 to be resistance in the previous update, and that level has held, thanks to the weak jobs report (and ISM survey that was released later). The DXY was testing potential support around 98.95 at the time of writing. Will it be able to bounce there? Break that on a closing basis and next week could bring more technical dollar selling.
By Fawad Razaqzada, market analyst with FOREX.com
BNB/USDT 4H Chart: Rising Channel with Fractal Vibes!Hey traders! Binance Coin is showing some promising action that’s got me on the edge of my seat!
We’ve got a clear rising channel in play, with BNBUSDT moving beautifully in sync with a fractal line pattern shown above the chart — mirroring past price behavior like a roadmap! BNBUSDT is currently trading at $650 , I think price will continue bouncing between the channel’s support at $620-$600 and move upwards to the key resistance target at $700-$720 . A breakout above this resistance could send BNB soaring to new highs, potentially targeting $800 or beyond!
However, if BNB fails to break through, we might see a pullback to the channel support at $620-$600 .
Key Levels to Watch:
Resistance: $700-$720
Support: $620-$600
Breakout Target: $800+
Breakdown Risk: $600
Is BNB about to blast through $720, or will it retreat below support? Let’s hear your thoughts below!

CHFJPY BUYBUY @182.836
SL @182.687
TP @183.581
If SL hits by a candle sweep and closed above the entry level again buy....
And always risk 1%

NFP data is positive, the bullish trend remains unchanged#XAUUSD
The current market, influenced by data such as NFP, remains bullish, even briefly pushing towards the 4H upper limit of 3350, reaching a high near 3354.📈
In the short term, gold still has upward momentum and could even reach the previous high resistance level near 3375.🐂
Currently, gold is undergoing a technical correction and needs to begin a pullback to accumulate more bullish momentum, giving traders who previously missed the opportunity to get on board.🚀
As resistance continues to rise, support below will also rise. 📊If gold retreats below 3335-3315, consider going long.📈
🚀 SELL 3335-3315
🚀 TP 3350-3375

Target Calls $100 CallsTGT Technical Breakdown — August 1st
Target (TGT) remains within a well-defined ascending channel that began forming around April 9th, showing a consistent pattern of higher highs and higher lows. Today, price action has touched the lower trendline support of this channel near $99.50, which also coincides with a key psychological level.
While this area has historically attracted buyers, yesterday’s post-earnings reaction, which saw the stock fall several points, raises major concern about potential bearish sentiment in the short term. This makes the next move crucial.
Trade Plan & Critical Levels
🔎 Entry Trigger: I’m not entering yet. My entry will only be considered at $100.55, and even then, only if the price breaks this level with conviction — specifically, I want to see a strong bullish "power candle" to validate buyer momentum.
🛑 Stop Loss: $97.50 — just below the current trendline and a key invalidation point for this bullish structure.
📈 Targets Upon Confirmation:
$103.63
$105.00
$107.00
$108.73
Summary
The structure is still bullish, but yesterday’s earnings-driven drop introduces caution. $100.41–$100.55 remains the "must-break" zone. If bulls can clear this level with strength, momentum could carry the stock to the above targets. Otherwise, failure to hold the $99.50 support could see a breakdown toward the $97.50 area or lower.

Bitcoin willIt hold if we stay above $115k ?? Fixing up last post I’ve deleted now as image was not good. Anyway simple RSI and Auto Fib Retrace with only general CRYPTOCAP:BTC market understanding backing this. This isn’t finacial advice at all. It’s pure speculation this post and anything related to it. I’m
Not a finacial advisor and I will not be held accountable for anyone’s actions that I didn’t do.

Gold Slips After Powell Speech Below 3320 Bearish Pressure BuildGOLD Overview
Market Context:
Gold declined from the 3333 level, as anticipated in yesterday’s analysis, ahead of Fed Chair Powell’s speech. Powell reiterated that it is still too early for rate cuts, citing persistently high inflation, which supported the U.S. dollar and pressured gold.
Technical Outlook:
As long as gold trades below the 3320–3310 zone, the bearish momentum is expected to continue, with the next target at 3285. A confirmed break and stability below 3285 could open the way toward 3255.
To regain bullish traction, the price must stabilize above 3320.
Support Levels: 3285 • 3255
Resistance Levels: 3333 • 3349

XAUUSDXAU/USD represents the exchange rate between one troy ounce of gold (XAU) and the US dollar (USD). It shows how much in US dollars is required to purchase one ounce of gold. This pair is widely traded across forex and commodities markets and is considered a key indicator of global economic stability and investor sentiment.
Historically, gold was pegged to the US dollar under the Bretton Woods Agreement from 1944 to 1971. During this period, one ounce of gold was fixed at $35, and the US government guaranteed the convertibility of dollars into gold. In 1971, President Richard Nixon ended the gold standard, allowing gold to trade freely on global markets. This led to significant volatility in the price of gold, which began to reflect real-time market forces such as supply, demand, inflation, and geopolitical events.
In the decades that followed, gold experienced several major price movements. In 1980, gold surged to around $850 per ounce due to high inflation and geopolitical instability. It then declined and remained relatively low through the 1990s, reaching a low near $270 in 2000. Starting in the mid-2000s, gold began a strong upward trend driven by concerns about inflation, financial crises, and central bank policies, culminating in a peak near $1,920 in 2011 during the Eurozone crisis and Federal Reserve monetary easing.
In 2020, gold hit a new all-time high around $2,070 during the global uncertainty of the COVID-19 pandemic. Since then, it has continued to be influenced by economic data, interest rate decisions, inflation trends, and geopolitical developments. In 2024 and 2025, gold has remained strong, supported by central bank buying and expectations of future rate cuts. As of August 2025, the current price of gold has reached $3,363 per ounce, reflecting heightened demand and ongoing macroeconomic uncertainty.
XAU/USD is influenced by many factors, including the strength of the US dollar, inflation expectations, geopolitical risks, and investor demand for safe haven assets. When the dollar weakens or global uncertainty increases, gold typically gains value. Traders and investors often use gold to hedge against economic instability, inflation, or currency devaluation.
Today, gold remains one of the most important assets in global markets, and XAU/USD continues to be a major pair for both short-term traders and long-term investors.

Major Warning: Bitcoin Breaches Key Support with Bearish SignalsBitcoin has officially broken down from its recent consolidation zone, closing below the critical 21 EMA on the daily chart. This move, combined with reversal signals on both the weekly and daily timeframes, suggests that downward pressure is intensifying.
In this video, I’ll walk you through:
• The candlestick patterns signaling reversal
• The significance of the 21 EMA breach
• Confirmed divergences from key indicators
• What this means for short-term and long-term price action
Whether you're holding Bitcoin or trading around it, this is a pivotal moment. The charts are speaking—are you listening?

ETHUSD The Week Ahead Key Support and Resistance Levels
Resistance Level 1: 3677
Resistance Level 2: 3752
Resistance Level 3: 3833
Support Level 1: 3485
Support Level 2: 3400
Support Level 3: 3316
This communication is for informational purposes only and should not be viewed as any form of recommendation as to a particular course of action or as investment advice. It is not intended as an offer or solicitation for the purchase or sale of any financial instrument or as an official confirmation of any transaction. Opinions, estimates and assumptions expressed herein are made as of the date of this communication and are subject to change without notice. This communication has been prepared based upon information, including market prices, data and other information, believed to be reliable; however, Trade Nation does not warrant its completeness or accuracy. All market prices and market data contained in or attached to this communication are indicative and subject to change without notice.

BTCUSD The Week Ahead Key Support and Resistance Levels
Resistance Level 1: 119,000
Resistance Level 2: 121,030
Resistance Level 3: 122,862
Support Level 1: 111,683
Support Level 2: 110,450
Support Level 3: 108,720
This communication is for informational purposes only and should not be viewed as any form of recommendation as to a particular course of action or as investment advice. It is not intended as an offer or solicitation for the purchase or sale of any financial instrument or as an official confirmation of any transaction. Opinions, estimates and assumptions expressed herein are made as of the date of this communication and are subject to change without notice. This communication has been prepared based upon information, including market prices, data and other information, believed to be reliable; however, Trade Nation does not warrant its completeness or accuracy. All market prices and market data contained in or attached to this communication are indicative and subject to change without notice.
