SUI 1H – Breakdown & Retest of Key Support, But Will It Reject?SUI 1H – Breakdown & Retest of Key Support, But Will It Reject or Reclaim?
Description:
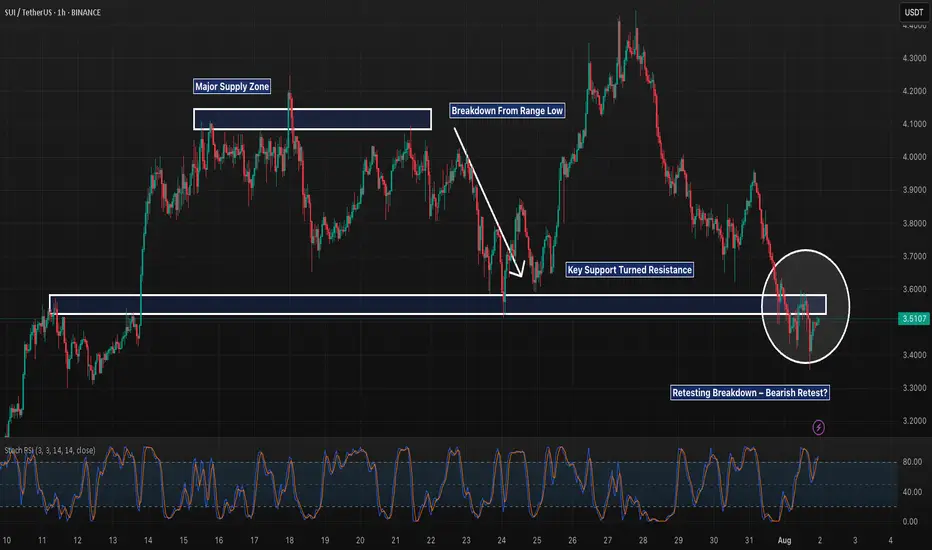
SUI just completed a textbook range breakdown after weeks of sideways chop between ~$3.60–$4.10. The prior support floor has now flipped into resistance, and the recent bounce appears to be retesting that structure. If this retest gets rejected, continuation toward lower support zones (potentially $3.30 and below) becomes likely.
However, reclaiming and holding above $3.60 could trap late shorts and fuel a squeeze. Structure still favors bears for now, but it’s decision time.
📌 Breakdown structure
📌 Bearish retest
📌 Eyes on confirmation or invalidation
This is the battle zone — stay sharp.
Community ideas
XRP — Mapping Out the Next High-Probability Long SetupXRP continues to respect key levels, delivering clean setups and strong technical reactions.
📉 Recent Price Action Recap
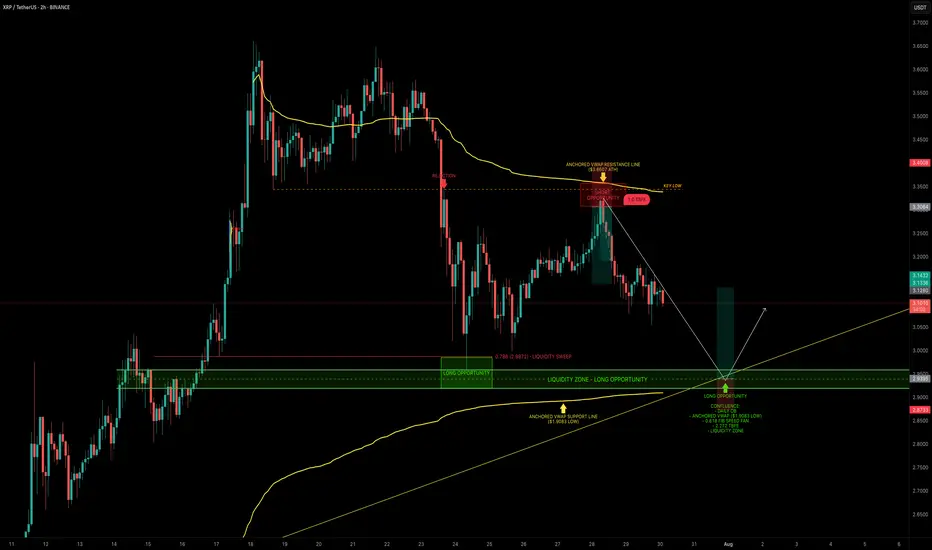
After the flush from $3.65 into the $3.00 support zone, XRP printed a solid bounce back toward the $3.30 resistance area, forming a clean short setup between $3.30–$3.35.
Price is now trading mid-range within the 6-day consolidation.
🟢 Next High-Probability Long Setup
A prime long opportunity lies between $2.96 and $2.9175 sitting within a key daily order block.
Confluence at this zone includes:
Liquidity pool just below the $2.9555 swing low
Anchored VWAP from the $1.9083 swing low resting just under the block
0.618 Fib Speed Fan lining up as dynamic support (July 30 – Aug 2)
2.272 Trend-Based Fib Extension at $2.9297
📈 Long Trade Setup
Entry Zone: $2.96 – $2.9175
Stop Loss: Below anchored VWAP (clear invalidation)
Target: $3.1/$3.13+
R:R: ~1:3+
💡 Educational Insight
This setup is a great example of how multiple tools layered together (like Fibonacci levels, VWAPs, order blocks and liquidity zones) can significantly increase the probability of a trade playing out.
When structure, volume-based tools and time alignment all point to the same area, it creates a high-confluence trade zone. These are the areas where risk is most defined and reward is most favourable, a principle every technical trader should anchor their strategy around.
_________________________________
💬 If you found this helpful, drop a like and comment!
Want breakdowns of other charts? Leave your requests below.
BRETT HTF Liquidity Raid + Demand TapWhat’s up, Candle Craft fam 🔥
We’re eyeing a high-probability bounce zone below structure for BRETT. No need to wait for confirmation here — the liquidity + structure setup is too clean.
📍 Updated Setup:
– Price broke rising wedge + retracing
– Anticipating dip into HTF demand pocket
– Bounce expected from 0.04747–0.04307 range
– Optional CHoCH entry if you want confirmation on M5
🎯 Entry: Limit orders in 0.04747–0.04307 zone
🩸 SL: 0.04150
🎯 TPs:
TP1: 0.05120
TP2: 0.06080
⚠️ Volatility Warning:
With Fed rate decision and US crypto framework coming today, we expect major volatility and potential flushes across alts. This could be the liquidity event that delivers the entry.
Candle Craft | Signal. Structure. Execution.

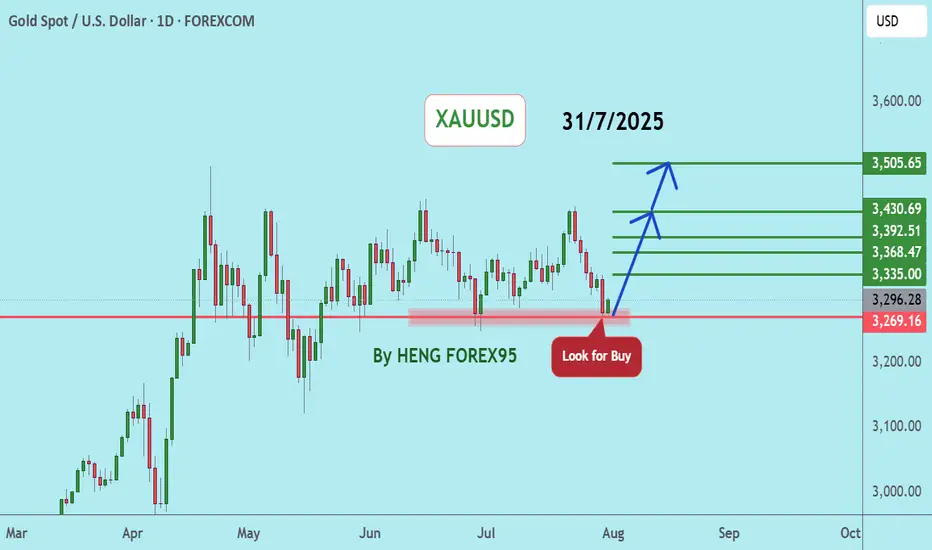
XAUUSDUpdate:
Gold Price Trend: As per our previous analysis on July 28, 2025, the price has now tested the support at 3,269. We expect that if the gold price can hold above 3,249, the gold price trend will remain bullish. We recommend considering buying in the red zone.
🔥Trading futures, forex, CFDs and stocks carries a risk of loss.
Please consider carefully whether such trading is suitable for you.
>>GooD Luck 😊
❤️ Like and subscribe to never miss a new idea!
Follow master candle for today's SELL strategy✏️ OANDA:XAUUSD has continued a strong downtrend. Yesterday's D1 candle closed with a 60-price decrease, forming a master candle that determines the market trend. With the market having a master candle, pay attention to the 25% or 50% candle zones to trade in the direction of the trend. Today's main trading strategy will be to SELL according to the master candle. The BUY strategy will only be implemented when the 3313 zone is broken.
📉 Key Levels
Support: 3285-3270-3250
Resistance: 3301-3312-3333
SELL Trigger. Rejection 3301, 3312
Target 3250
Leave your comments on the idea. I am happy to read your views.

Kas short to $0.0816Just now opened a short on KAS.
Sl: $0.08749
limit entry: $0.08548
Tp: $0.0816
Risk to reward: 1:2
DTT analysis applied - learn more on X

Bitcoin’s Game Has Changed: Fresh Support Zone, Targets Sky-HighHey Dear Friends,
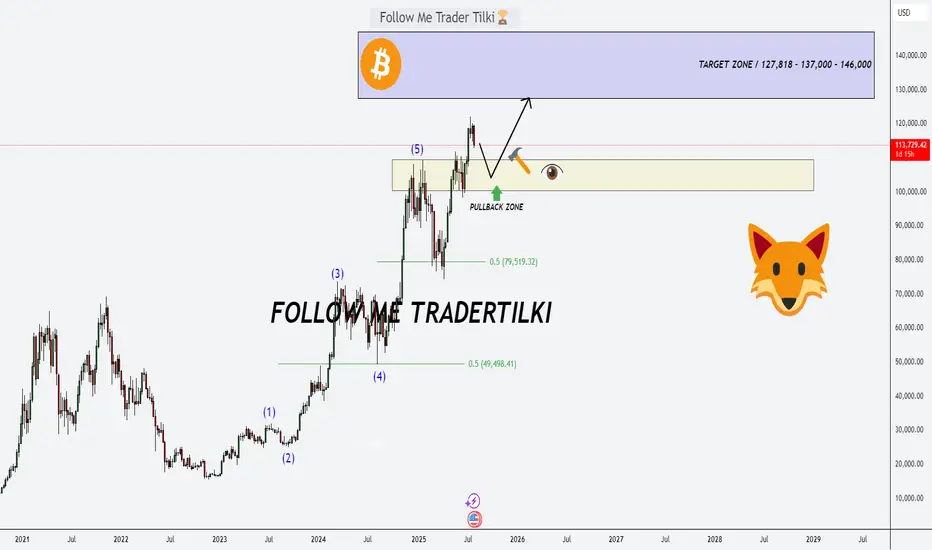
Until recently, Bitcoin had been stuck in a range between 112,331 and 105,344 for quite some time. But that range has now been clearly broken. So, what does this mean? This zone, which used to act as resistance, is now expected to flip and act as support.
According to my weekly trading model, the long-term target levels I’m tracking for Bitcoin are: 127,818 – 137,000 – 146,000.
Since this is a weekly setup, it might take a while for these targets to play out. Even if we see pullbacks to the 112K, 105K, or even 100K levels, I expect to see strong buying pressure from that zone.
I’ll keep sharing regular updates as this setup develops.
To everyone who’s been supporting and appreciating my work—thank you, truly. Your encouragement means the world to me and keeps me motivated to keep showing up. Much love to all of you—I’m grateful we’re in this journey together.
New targets for Reddit RDDT In this video I recap the previous reddit analysis where we looked for the long which is playing out really well .
I also look at the current price action and simulate what I think could be a target for the stock moving forward using Fib expansion tools as well as levels below for price to draw back too.
Welcome any questions below the chart . Thanks for viewing

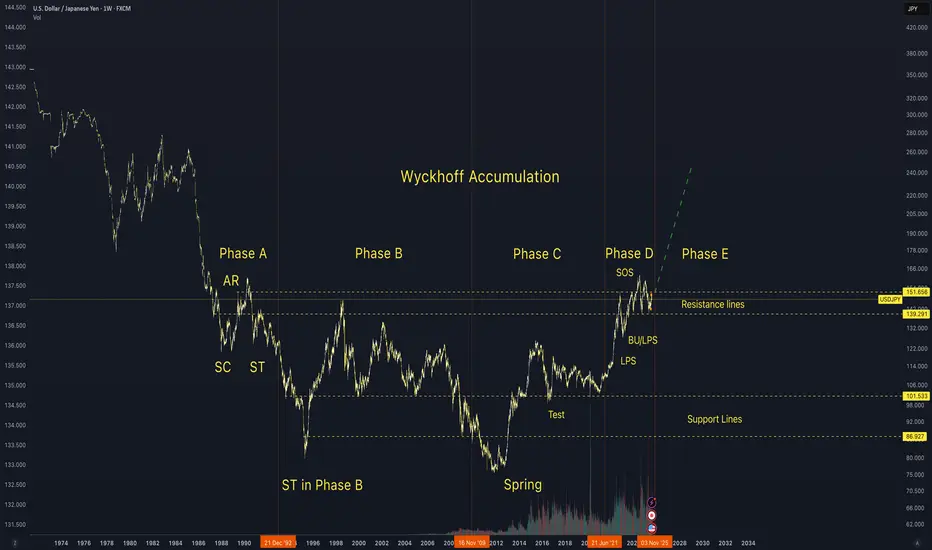
USD/JPY Wyckhoff Accumulation on weekly Chart Looks like a fairly textbook Wyckhoff accumulation on the USD/JPY Pair and looking ready to move up and to the right soon.
GBPCHF RETAINS BEARISH MOMENTUMInstitutional (COT) data shows a net reduction in GBP exposure, suggesting big money is pulling out of the pound. Retail sentiment also leans heavily against the trend, with traders buying the dip — another contrarian bearish signal. Seasonality does not favor the pair in August either, with historic trends leaning against GBP performance this time of year.
On the macro side, UK economic data continues to weaken. Both manufacturing and services PMI are deteriorating, indicating contraction across sectors.
Retail sales and GDP growth are negative, while inflationary pressure is easing — all of which reduces the urgency for further BOE tightening. Employment metrics are also weak, with poor job creation and falling labor market momentum.
Meanwhile, Switzerland is showing relative macro strength. The SNB is benefiting from stable inflation and its traditional safe-haven appeal, which is further boosted by rising global risk-off sentiment. Interest rate expectations are neutral for CHF but increasingly dovish for the UK, creating clear policy divergence in CHF’s favor.

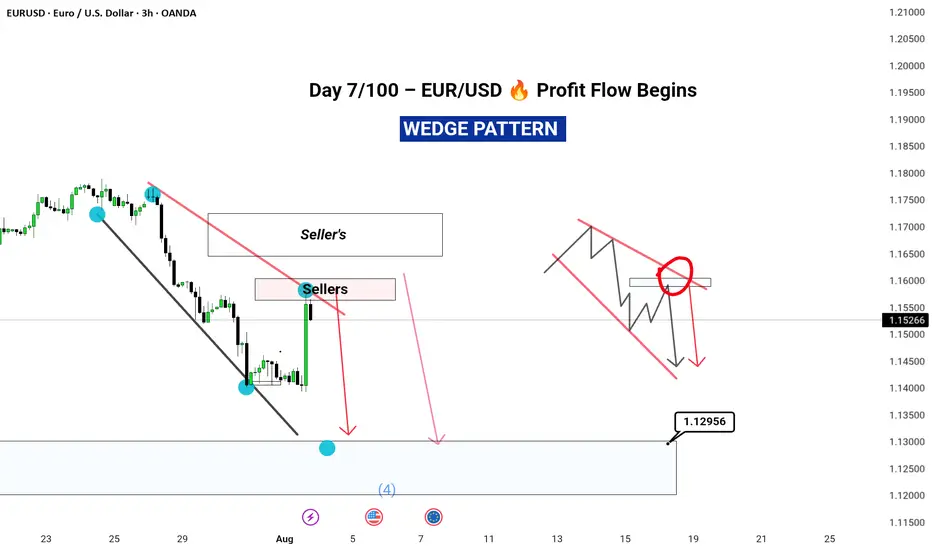
“Exactly What I Saw” promises value and transparency.
In today's analysis, I’ve identified a clear completion of Wave D, securing a 3% ROI across just two trades – all before the move unfolded.
🔍 What’s inside this breakdown?
• Multi-timeframe analysis: Weekly ➝ Daily ➝ 4H ➝ 1H
• Elliott Wave structure with confluence zones
• Trade psychology at key turning points
• Exact entry & exit insights explained
• Risk management for consistent returns
---
⚡ Highlights:
Precise reversal spotted before it was obvious
No indicator clutter – just clean, confident price action
Part of my 100-day breakdown series: real, raw, and repeatable setups
---
👣 Day 7 of 100 is just the beginning.
Tap Follow to stay ahead of the market – one wave at a time.
#EURUSD #ForexAnalysis #ElliottWave #Forex #TradingViewUK #SwingTrading #PriceAction #RiskReward #FXMindset #ForexTradersIndia #ForexEducation
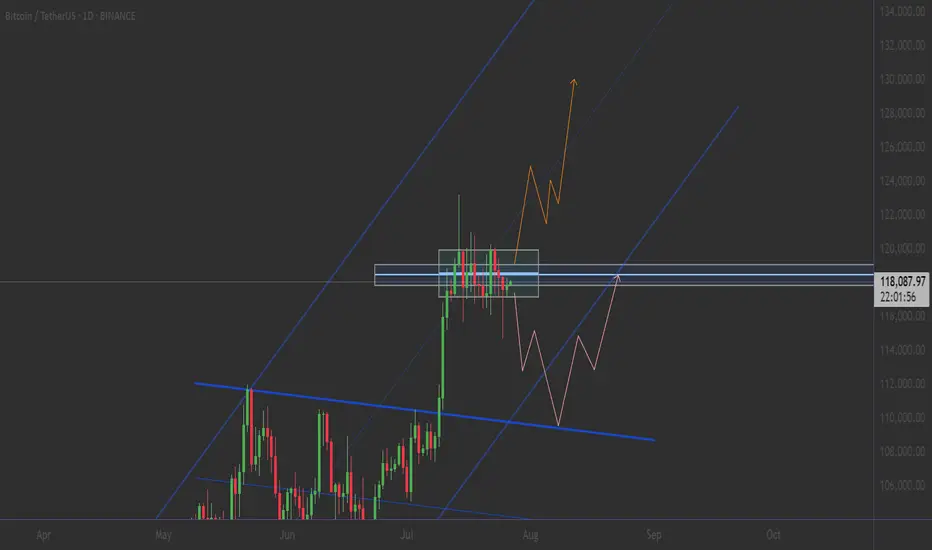
BITCOIN: THE PERFECT STORM - MULTIPLE BREAKOUT PATTERNS ALIGNED⚠️ CRITICAL SUPPORT LEVELS
🛡️ Support 1: $115,000 (-3%) - Triangle support
🛡️ Support 2: $110,000 (-7%) - Channel support
🔴 DANGER ZONE: $105,000 (-11%) - Multiple pattern failure
So...
Strategy: Quick profits on pattern completion 🎨
Entry: $115k (Triangle breakout confirmation) 📊
Stop Loss: $114k below (Tight risk management) ❌
Target: $125k (+10%) ✅
Time Horizon: 2-3 weeks 📅
Risk/Reward: 1:6 🎯
________________ NOTE _____________
⚠️ This is not financial advice. Bitcoin is highly volatile and risky. Only invest what you can afford to lose completely. Always do your own research and manage risk appropriately 🚨
XAUUSDXAU/USD represents the exchange rate between one troy ounce of gold (XAU) and the US dollar (USD). It shows how much in US dollars is required to purchase one ounce of gold. This pair is widely traded across forex and commodities markets and is considered a key indicator of global economic stability and investor sentiment.
Historically, gold was pegged to the US dollar under the Bretton Woods Agreement from 1944 to 1971. During this period, one ounce of gold was fixed at $35, and the US government guaranteed the convertibility of dollars into gold. In 1971, President Richard Nixon ended the gold standard, allowing gold to trade freely on global markets. This led to significant volatility in the price of gold, which began to reflect real-time market forces such as supply, demand, inflation, and geopolitical events.
In the decades that followed, gold experienced several major price movements. In 1980, gold surged to around $850 per ounce due to high inflation and geopolitical instability. It then declined and remained relatively low through the 1990s, reaching a low near $270 in 2000. Starting in the mid-2000s, gold began a strong upward trend driven by concerns about inflation, financial crises, and central bank policies, culminating in a peak near $1,920 in 2011 during the Eurozone crisis and Federal Reserve monetary easing.
In 2020, gold hit a new all-time high around $2,070 during the global uncertainty of the COVID-19 pandemic. Since then, it has continued to be influenced by economic data, interest rate decisions, inflation trends, and geopolitical developments. In 2024 and 2025, gold has remained strong, supported by central bank buying and expectations of future rate cuts. As of August 2025, the current price of gold has reached $3,363 per ounce, reflecting heightened demand and ongoing macroeconomic uncertainty.
XAU/USD is influenced by many factors, including the strength of the US dollar, inflation expectations, geopolitical risks, and investor demand for safe haven assets. When the dollar weakens or global uncertainty increases, gold typically gains value. Traders and investors often use gold to hedge against economic instability, inflation, or currency devaluation.
Today, gold remains one of the most important assets in global markets, and XAU/USD continues to be a major pair for both short-term traders and long-term investors.


Gold Surges on Non-Farm Data; 3330 Key Next WeekGold was strongly boosted by the significantly bullish non-farm payroll data, surging sharply like a rocket 🚀, with gains that completely "wiped out" all the weekly losses. The current gold trend, as if injected with super momentum, has completely broken the previous long-short stalemate. Starting from the 3300 level, it has been breaking through obstacles all the way up to 3350. At present, 3330 is like a critical "battleground" ⚔️ fiercely contested by both long and short sides.
This week, when gold was still "lingering" below 3300, I emphasized repeatedly that a rebound was inevitable – we just needed to stay calm and wait for the opportunity. As it turns out, our judgment was spot on, and we successfully took profits around 3340, reaping good gains 💴. Now, gold prices are oscillating back and forth in the 3340-3350 range. Based on a comprehensive analysis of the current trend, I boldly predict that gold is likely to pull back to around 3330 next week, so everyone can prepare in advance 🤗
⚡️⚡️⚡️ XAUUSD ⚡️⚡️⚡️
🚀 Sell@ 3350
🚀 TP 3330 - 3320 - 3310
🚀 Buy@ 3300 -3310
🚀 TP 3320 - 3330 - 3340
Daily updates bring you precise trading signals 📊 When you hit a snag in trading, these signals stand as your trustworthy compass 🧭 Don’t hesitate to take a look—sincerely hoping they’ll be a huge help to you 🌟 👇

LTCUSD Possible Scenario breakout of trendline resistanceLTCUSD is at major support and has now broken the resistance and price will likely will move up.

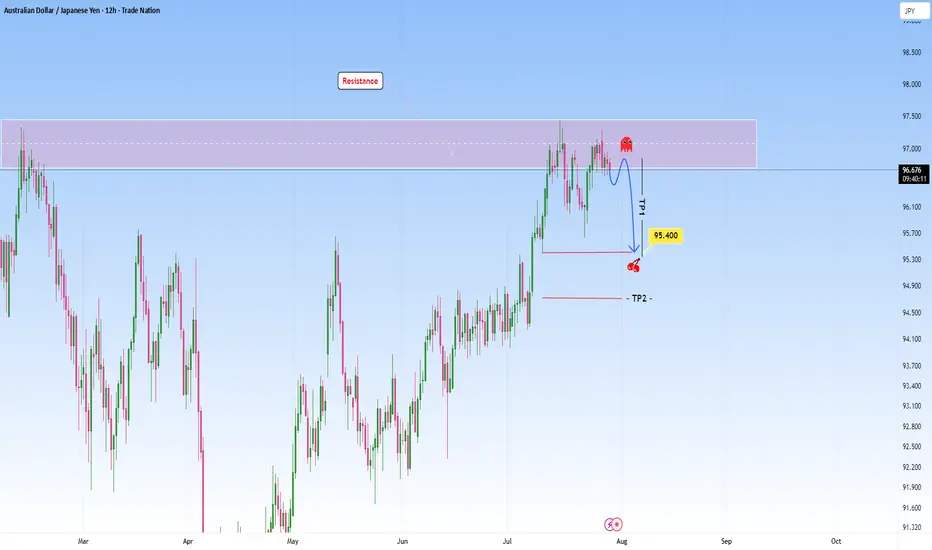
AUDJPY at Resistance: Could we see a reversal here?The market on this pair shows us a classic scenario where price presses into a resistance zone after a sustained bullish move. Price action approaching this zone appears hesitant, with smaller candles and wicks showing signs of exhaustion, meaning the possibility that buying momentum is weakening. There is a clear intention in this structure and I am anticipating a reversal here.
My first target (TP1) at 95.400 is placed just above a previous structure low and it’s a logical level for a partial exit, as price may pause or react there. The second target (TP2), placed even lower, hints at a full mean reversion idea targeting the origin of the previous bullish leg.
The setup requires patience, waiting for confirmation perhaps in the form of a strong bearish rejection before committing to the short. Overall, it’s a disciplined setup that mirrors the kind of analysis I like to gravitate toward: structured, simple and driven by high probability reversal zones.
Disclosure: I am part of Trade Nation's Influencer program and receive a monthly fee for using their TradingView charts in my analysis.
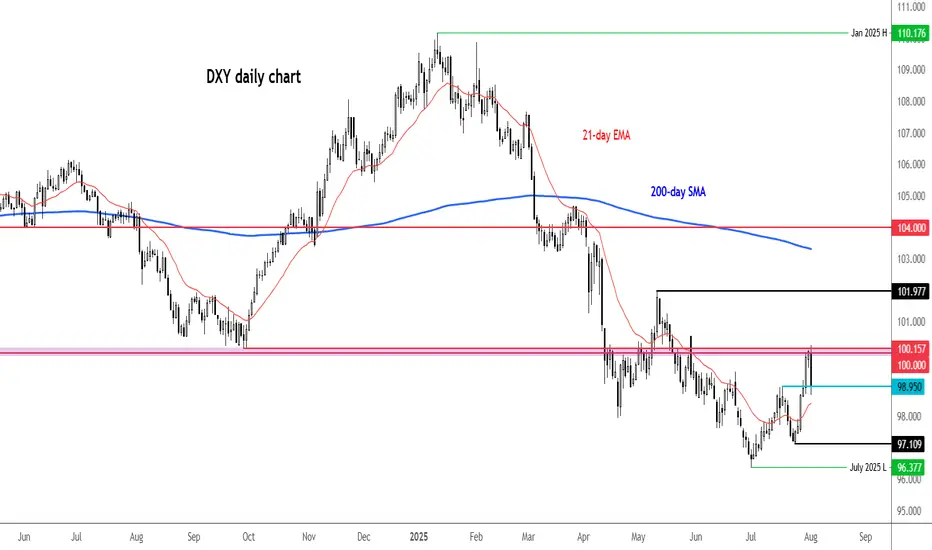
What now for the dollar after a poor NFP report?It is difficult not to link the bad US data to the impact of tariffs. Indeed, it certainly looks that way, especially given that the slowdown in jobs started in early Q2 when reciprocal tariffs were announced. Companies expecting margins to be squeezed by higher duties probably thought twice about hiring workers in order to keep costs down. So, the US labour market has been losing steam fast, undoubtedly due to tariff concerns. Unless the data surprises on the upside soon, the Fed may have no choice but to cut—and cut again. Against this backdrop, the recovery in the dollar is going to a long bumpy road.
We noted the area around 100.00 to be resistance in the previous update, and that level has held, thanks to the weak jobs report (and ISM survey that was released later). The DXY was testing potential support around 98.95 at the time of writing. Will it be able to bounce there? Break that on a closing basis and next week could bring more technical dollar selling.
By Fawad Razaqzada, market analyst with FOREX.com
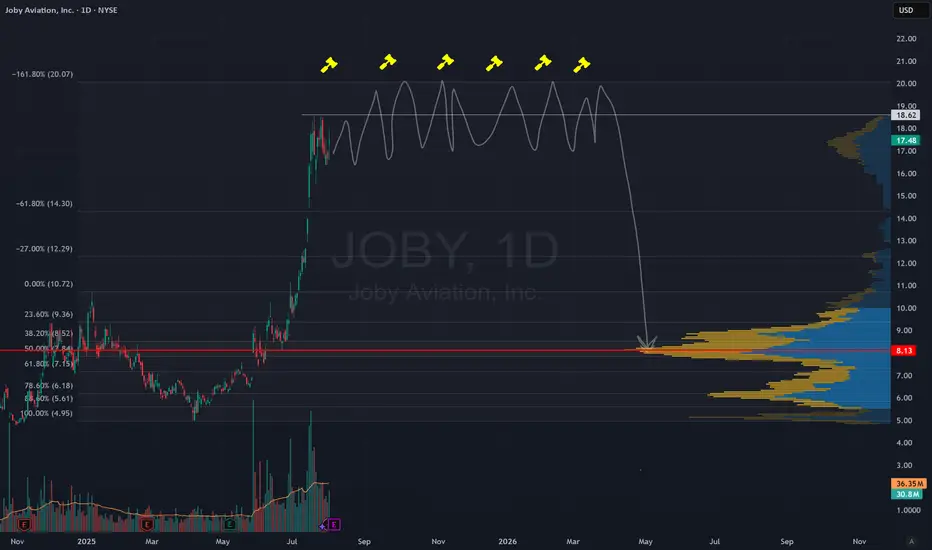
This is going down to $8, When.. sooner or later!This name has popped up a lot lately. Just be careful not to be the bag holder when the music stops!
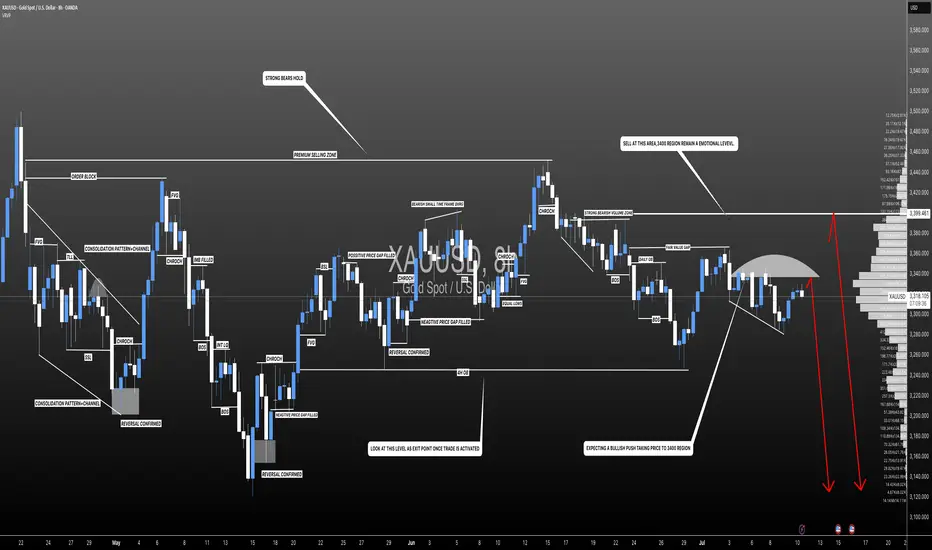
XAUUSD:Swing Sell Is Highly Likely! Get ReadyWe expect a smooth drop in gold prices, with prices potentially dropping around the 3250 area. Use Accurate Risk Management.
Please like and comment!
Team Setupsfx_
The End of BTC correction? BTC analysis 2/8/2025In my point of view, BTC has completed its correction and is now ready for a strong upward move, potentially targeting the $137,000–$139,000 range, based on the following factors:
1. Confirmation of the Butterfly Harmonic Pattern
The recent reversal occurred within the expected range of the Butterfly harmonic pattern. Typically, the XD leg in a Butterfly harmonic extends to 1.27, but in practice, this can stretch up to 1.414, which is commonly used as a flexible stop-loss zone. After testing the 1.27–1.414 range, a clear 5-wave impulse followed—testing a key trendline and making an attempt to break above the recent high. This sequence, followed by a corrective move, suggests that the broader correction may be complete.
2. Complex WXYXZ Correction Structure
In my previous analysis, I underestimated the duration and depth of the correction. The wave (4) (blue), which is part of the wave (iii), has taken considerable time—likely to allow wave (5) to extend sufficiently to break above the $130,000 level. This would support the assumption that wave (5) (purple) is the extended wave. The overall corrective structure appears highly complex, and can be counted as a W–X–Y–X–Z pattern, supported by the presence of multiple internal corrections within the wave components.
3. 0.618 Fibonacci Retracement of Wave (3)
Wave (4) has now reached the 0.618 Fibonacci retracement level of wave (3), which is significant. Historically, BTC’s corrections rarely retrace beyond the 0.87 level. This deep retracement suggests wave (4) is likely complete—unless price were to fall below that threshold, which would invalidate this assumption.

TON Bearish DivergenceBINANCE:TONUSDT
Trade Setup:
Target 1: 3.523 (0.786 Fibonnaci Golden Zone).
Target 2: 3.389 (0.618 Fibonnaci Golden Zone).
Target 3: 3.295 (0.786 Fibonnaci Golden Zone).
Target 4: 2.897 (0 Fibonnaci).
Stop Loss: 3.910 (1.272 Fibonnaci).
RSI Analysis: The RSI is showing a bullish divergence, suggesting potential bullish momentum. The current RSI is around 75.44, approaching overbuy territory, so caution is advised.

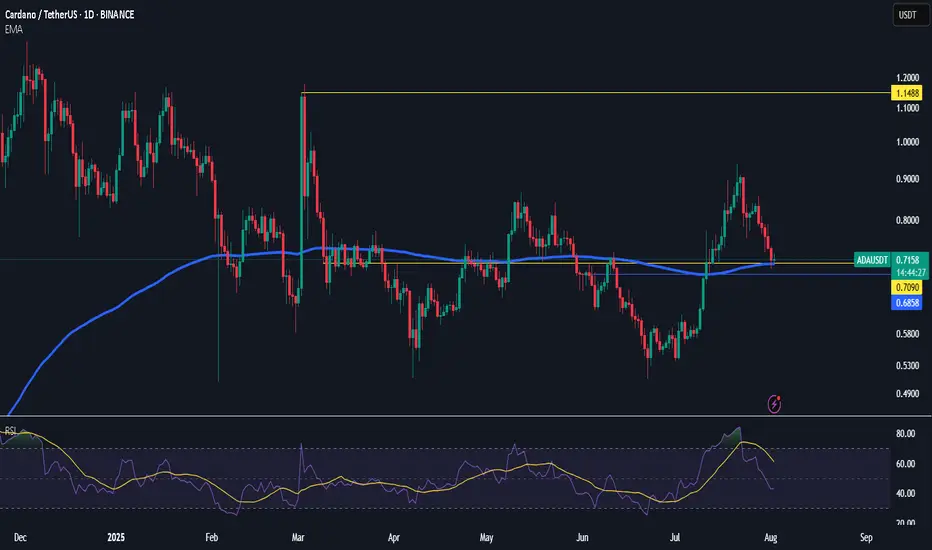
$adaabove 200 ema on daily
range low
deivation likely
entered now let see if we get a wick below before up saving some to bid there
time for it to ressurect