Community ideas

BANK NIFTY S/R for 28/7/25Support and Resistance Levels:
Support Levels: These are price points (green line/shade) where a downward trend may be halted due to a concentration of buying interest. Imagine them as a safety net where buyers step in, preventing further decline.
Resistance Levels: Conversely, resistance levels (red line/shade) are where upward trends might stall due to increased selling interest. They act like a ceiling where sellers come in to push prices down.
Breakouts:
Bullish Breakout: When the price moves above resistance, it often indicates strong buying interest and the potential for a continued uptrend. Traders may view this as a signal to buy or hold.
Bearish Breakout: When the price falls below support, it can signal strong selling interest and the potential for a continued downtrend. Traders might see this as a cue to sell or avoid buying.
MA Ribbon (EMA 20, EMA 50, EMA 100, EMA 200) :
Above EMA: If the stock price is above the EMA, it suggests a potential uptrend or bullish momentum.
Below EMA: If the stock price is below the EMA, it indicates a potential downtrend or bearish momentum.
Trendline: A trendline is a straight line drawn on a chart to represent the general direction of a data point set.
Uptrend Line: Drawn by connecting the lows in an upward trend. Indicates that the price is moving higher over time. Acts as a support level, where prices tend to bounce upward.
Downtrend Line: Drawn by connecting the highs in a downward trend. Indicates that the price is moving lower over time. It acts as a resistance level, where prices tend to drop.
Disclaimer:
I am not SEBI registered. The information provided here is for learning purposes only and should not be interpreted as financial advice. Consider the broader market context and consult with a qualified financial advisor before making investment decisions.

ENS.usd eyes on $29.32: Golden Genesis fib stalling a BIG break?ENS surging along with Ethereum, as expectable.
Now up against a Godlen Genesis fib at $29.32
Look for a Break-n-Retest to signal a break out.

“Buy the rumor, sell the news”
---
### 🎯 **“Buy the Rumor, Sell the News” – A Trader’s Mind Game**
Imagine you’re not just following the market… you’re dancing ahead of it. This strategy flips traditional thinking on its head—and rewards those bold enough to act **before** the spotlight hits.
---
### 🕵️♂️ **Step One: Buy the Rumor**
- Traders catch whispers—like talk of a potential interest rate hike.
- The markets start to react *before* anything official is announced.
- Assets like gold might drop on the expectation alone… that’s your **entry point**.
You're not buying certainty. You're buying what the crowd *thinks* will happen.
---
### 🔊 **Step Two: Sell the News**
- Once the news breaks, it's already "old" to seasoned traders.
- That shocking headline? Already priced in.
- The market might reverse or surge unpredictably.
- This is when savvy traders exit, locking in profits from those who just arrived.
---
### 🧠 **Why It Works**
- Financial markets aren’t just driven by facts—they’re powered by **sentiment** and **anticipation**.
- By the time news goes public, smart money has already moved.
It’s like buying concert tickets before the band announces a tour—then selling them the moment fans go wild.
---
### 📉 **A Real Example**
- **Monday Rumor**: “The Fed will raise interest rates.”
- Gold begins to slide as traders prepare—this is your chance to act.
- **Thursday News**: The hike is confirmed.
- Instead of dropping further, gold might **rise** due to market overreaction or repositioning.
- You **sell** into that chaos—profit made.
---


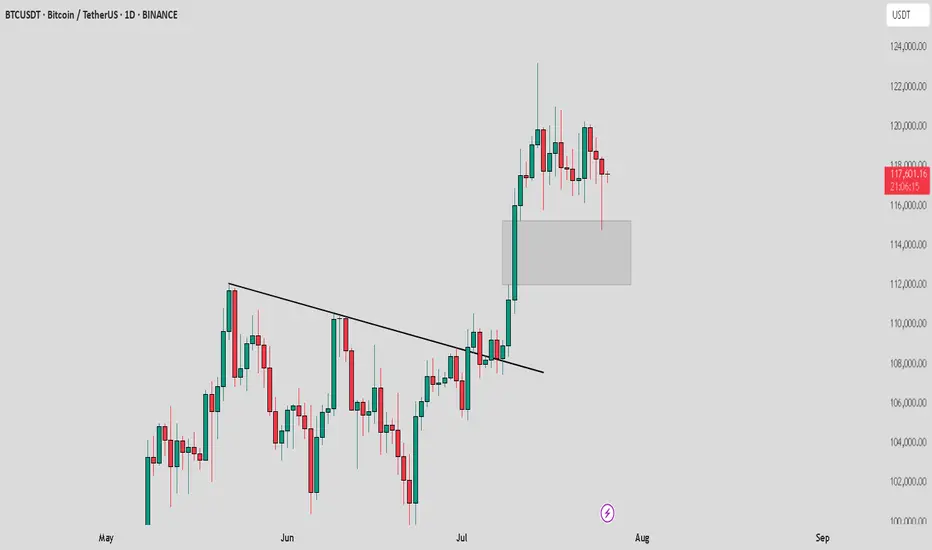
BTC /USDT : Getting support from FVG BTC Support from FVG - Bullish & Bearish Scenarios:
Bullish Scenario:
BTC is holding support from the FVG. As long as BTC stays above this zone, the market remains bullish. A bounce here could lead to further upside.
Bearish Scenario:
If BTC breaks below the FVG, it signals a potential downtrend. A breakdown may lead to more pain and further declines in the market.
Tips:
1. Wait for Confirmation: Look for a clear candle close above/below FVG for validation.
2. Risk Management: Set stops near the FVG to manage potential losses.
3. Monitor Volume: Strong volume during support retests increases bullish potential.
4. Stay Flexible: Be prepared for a market shift if BTC breaks the FVG support.
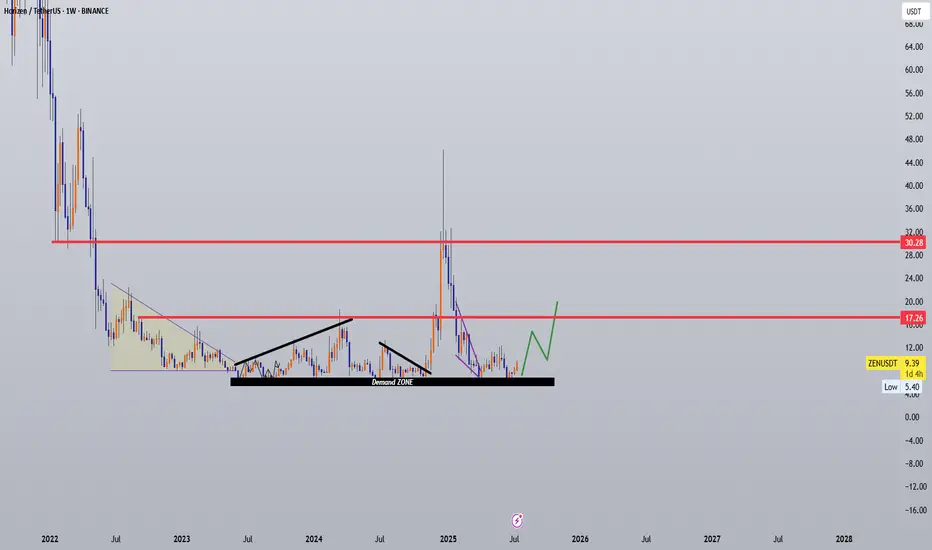
ZENUSDT Accumulation – Undervalued zk L1 with 5x–8x Potential?📌 Coin: ZEN (Horizen)
💰 Buy Levels:
✅ First Entry: $9.30
✅ Second Entry: $7.50
🛑 Panic / SL Level: Weekly close below $6.00
🧠 Fundamental Analysis (FA) – In Short
*️⃣ Sector: Layer 1 / Privacy Infrastructure / Sidechains
*️⃣ Use Case: Horizen is a privacy-preserving, scalable blockchain ecosystem focused on custom sidechains and cross-chain interoperability for real-world enterprise solutions.
*️⃣ Tech: Utilizes zero-knowledge proofs (zk-SNARKs) for privacy and supports sidechains via Zendoo, its proprietary SDK.
*️⃣ Unique Angle: Aims to let developers deploy fully customizable blockchains with privacy by default — a hybrid between Cosmos modularity and Zcash privacy.
*️⃣ Staking / Earning: ZEN offers passive rewards through node operation, including secure nodes and super nodes.
*️⃣ Enterprise Focus: Partners with companies building secure, private, and compliant solutions — positioning itself for regulated environments.
📊 Tokenomics & Market Data
(As of mid-July 2025)
🪙 Current Price: ~$9.39
🧾 Market Cap: ~$120M
🔢 Rank: ~#280–300
🧮 Circulating Supply: ~14.8M ZEN
🔒 Max Supply: 21M ZEN (like BTC)
💰 Inflation Model: Halving every 4 years (next: ~2026)
🛠️ Reward Sharing: 20% of block rewards go to treasury, rest split between miners and node operators
🎯 Bull Market Target (Realistic)
Target Range: $18 – $24
*️⃣ Reflects previous range tops and resurgence in interest toward privacy-focused ecosystems and sovereign rollups.
🚀 Mega Bullish Target (Speculative Top)
Target Range: $38 – $60+
*️⃣ Requires a full privacy narrative comeback, zk adoption surge, or enterprise-level announcement using Zendoo sidechains.
✅ Final Take
🧠 ZEN is one of the few chains combining scalable sidechains with zk privacy and enterprise tooling.
we ask Allah reconcile and repay
USDCAD SELLUSD/CAD rallies to 1.3680 as the market focuses on a hawkish Fed
The US Dollar extends its recovery for the second consecutive day, supported by strong US data. Upbeat US business activity and Jobless Claims support the Fed's "wait and see" rhetoric. In Canada, the weak Retail Sales data keep hopes for a BoC rate cut alive.
The year will be politically marked by Trump’s return to the White House. A Republican government is seen as positive for financial markets, but Trump’s pledge to cut taxes and impose tariffs on foreign goods and services may introduce uncertainty to both the political and economic landscape.
Canada’s political crisis peaked in late 2024 with a no-confidence vote against Prime Minister Justin Trudeau, leading to snap elections and a weakened Liberal minority government. Policy uncertainty and economic challenges dominate 2025’s outlook, raising concerns over market stability and investor confidence.
The BoC is set to continue easing interest rates through 2025, at least at a faster pace than the Fed is expected to, which could apply pressure on CAD’s already-rising rate differential.
SUPPORT 1.36991
SUPPORT 1.36739
SUPPORT 1.36495
RESISTANCE 1.37346
RESISTANCE 1.37455

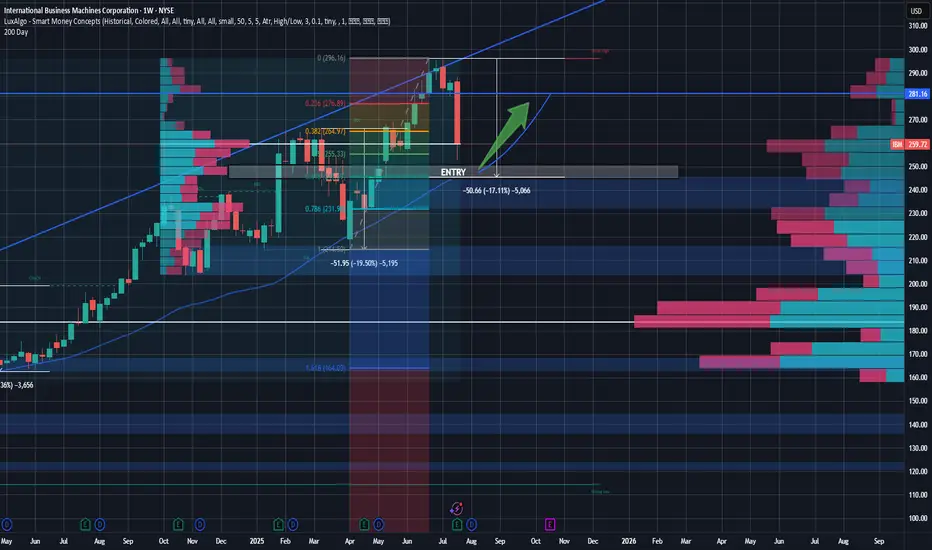
IBM Rebound Trade - Buying the Pullback at Key ConfluenceSetup:
IBM is setting up for a potential high-conviction long entry around the $245 level, a price zone marked by multiple layers of technical confluence and volume-based support. Over the last 18 months, IBM has seen two notable pullbacks—both in the 17–20% range, often around earnings events. The current drawdown is consistent with this historical behavior and may represent an opportunity rather than a breakdown.
Technicals & Indicators
Volume Profile Support:
Using a volume profile anchored from January 2024, a clear volume shelf exists between $245 and $265.
A second profile anchored 10 months ago confirms heavy volume at $260 and $245, indicating high institutional activity and potential support zones.
200-Day Moving Average:
IBM has consistently respected its 200-day MA over the past two years. The MA is now converging at $245, adding dynamic trendline support.
Fibonacci Retracement:
Applying retracements from the April 2025 lows to the recent ~ $300 highs, the $245 level aligns with the 61.8% Fibonacci level, a key zone for potential reversals.
GAP Fill:
Looking for the recent earnings gap to close within the next 2 months, as we see new opportunities for tech companies and rising demand. This overreaction created a gap that should be filled as investors digest the macro strength and re-enter long positions in IBM. Gap close ~ $280 level.
Candles & Buying Pressure:
Recent daily volume after earnings suggests strong buying pressure with a hammer/doji candle forming on the day after earnings. Investors are already buying back into this name.
Fundamentals & Business Operations:
Despite the post-earnings dip, IBM continues to display strong business fundamentals:
Free Cash Flow (TTM): ~$12.3B, supporting dividends and future investment.
FCF Margin: 19.1%
Gross Margin: ~58% | Operating Margin: ~ 17%
Forward P/E: ~22.45x | EV/EBITDA: ~19.85x
Dividend Yield: 2.6%
These metrics reflect operational efficiency, cash generation, and relative undervaluation compared to peers—especially given IBM’s AI and hybrid cloud positioning that remains strong. With margins that continue to be at the top of the industry, IBM also has the resources to execute on the tremendous opportunities arising in the tech world.
Macro & Industry Context:
We’re in the early stages of a long-term AI and data center growth cycle, and IBM, while not the most popular AI name, is deeply embedded in enterprise infrastructure, consulting, and mainframe compute. Their recent earnings beat didn’t change that narrative. Investor sentiment overreacted, giving patient traders a potential entry on weakness. Analysts still hold a buy on this name with price targets well above $270. This isn't a one-day trade, but in a few weeks, let's see where the market is at.
Price Targets & Risk/Reward:
Entry Zone: $245 (watch for confirmation & strength)
Target 1: $280 (resistance level with high volume in the range)
Optional Long-Term Hold: If the broader AI trend continues, IBM could break all-time highs and trend above $300 over time.
Strategy & Patience:
This is not a chase setup. I will wait for $245 to be reached and confirmed—a level backed by technical support, volume profile, and long-term valuation logic. If IBM holds and reverses with strength, this could be a strong swing trade or even a long-term position for investors who want value with AI exposure. I will be looking for a confirmation(maybe a candle pattern) before entering the trade, but if it gets there, I see good potential for a bounce.
$CHILLGUY Bounce Ahead? +33% Potential$CHILLGUY just bounced off the support in its rising wedge on the 4H chart.
If the trend holds, we could see a 33% move toward the $0.08938 zone.
But if it breaks below, the setup’s off, so watch closely and manage risk.
DYOR, NFA

EURUSD--LONG-- 26-07-25--2 weeks before tested end bounced from monthly support level 1.15652
--last week was a rising week.
--upward movement will likely to continue this week too.
--best enrty level is around 1.17096

XAUUSD 4H Technical Outlook The current market structure on the 4H timeframe shows a clear sweep of a liquidity pool near the recent highs (~3,348), followed by a strong bearish reaction. Price action suggests a short-term shift in momentum toward downside targets.
🔻 Bearish Scenario
After liquidity was grabbed above the recent highs (highlighted in the orange circle), price rejected sharply. The next critical level lies at the Bullish OB (LTF) around the 3,325–3,337 zone. A break below this could lead to a deeper retracement into the Fair Value Gap (FVG) and demand zone at 3,150–3,244.
📍 Key Levels:
Resistance: 3,347 – 3,439
Support: 3,244 – 3,150 (watch for reaction in the FVG zone)
Intermediate target: 3,244.41 (Low)
🟢 Bullish Case
If price finds support at the OB and respects the ascending trendline, we could see a reversal back to re-test the upper resistance near 3,438.
📈 Bias: Bearish until price confirms support above 3,337 and reclaims liquidity zone.
🔔 Watch for:
Price reaction at OB (3,325–3,337)
Break and close below 3,244 could accelerate selling
Potential long setup from FVG with bullish confirmation

NYA Hourly 5th of the 5th If the Bull market is to advance we can NOT drop below .382 of the rally from 4/7 2025 Were I said 4835 was wave 4 in Super cycle .it is this simple Which is the 200 day avg BTW !!!!!!!best of trades WAVETIMER

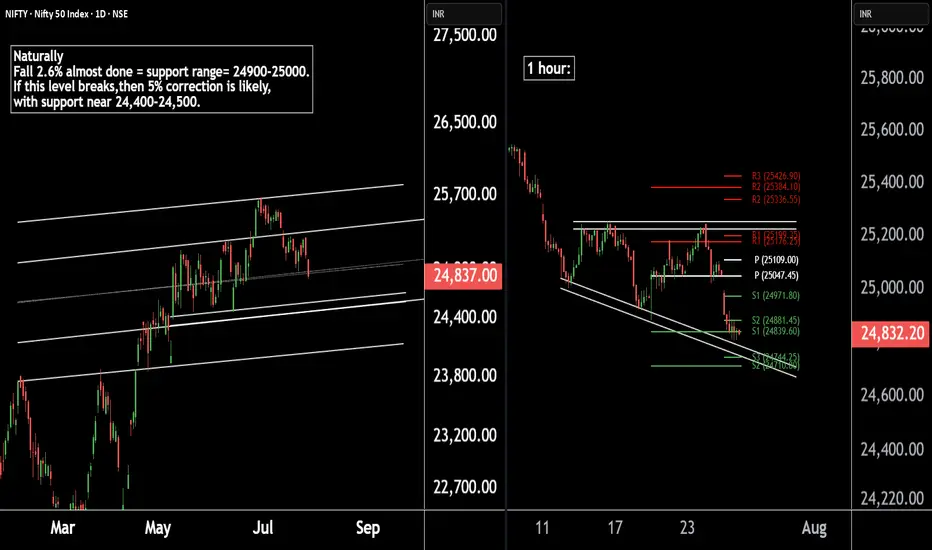
Nifty 50 Update | Technical Levels MappedThere are two chart of Nifty50.
Nifty 50 is trading within a well-defined parallel channel. As part of its natural corrective phase, a potential decline of around 5% cannot be ruled out, with key support anticipated near the 24,400–24,500 zone.
Nifty is forming a broadening wedge pattern on the 1-hour timeframe, with crucial support around 24,740. Additionally, both the weekly and monthly pivot supports are aligned in the 24,740–24,710 zone, reinforcing the significance of this level.
If this level sustain then we may see higher prices in Nifty50.
Thank You !!
Fart Ichimoku Breakout Test📈 Checking bullish signals on the chart
✅ Positive signs:
- The price is stable above the cloud and the candles show the strength of buyers.
- Indicators such as RSI and trading volume are in a good position.
- The cloud broke with the body
First profit limit 1/451
Second profit limit 1/551
Limit of loss 1/320

going lower or bouncing on resistance? market is respecting key support/resistance or channel boundaries. These points often become decision zones where big moves occur.
Signs this could be a fakeout:
BTC wicks above a resistance or below a support with little follow-through
Volume spikes only on the wick, then dies quickly
Price reverses back into the range soon after breaking it
If BTC recently broke a trendline with low volume, it smells like a trap move — a liquidity grab.
If it’s testing support again after failing to rally, and volume is increasing on red candles, a leg down is possible.
However, macro trend is still up unless we lose a major higher low (say, sub-$60k or sub-$56k depending on your chart).

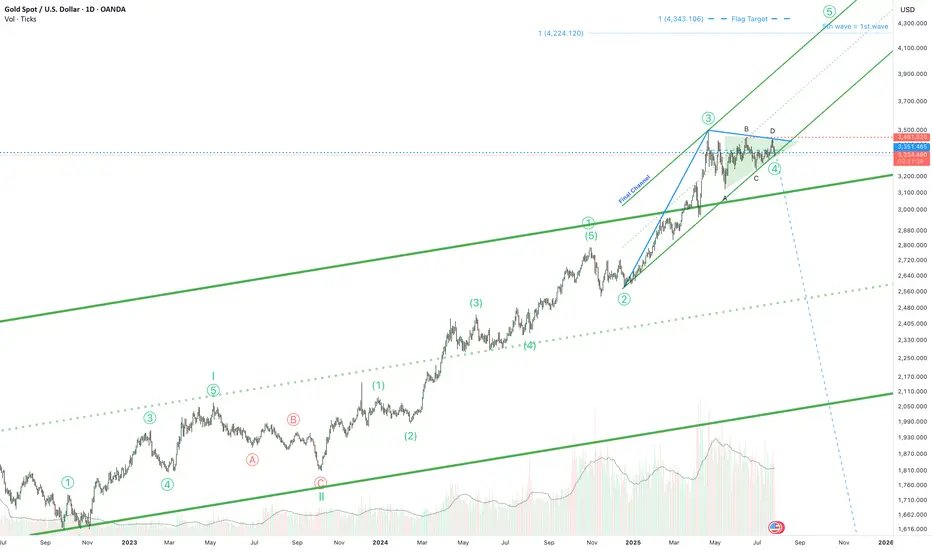
Gold is ready for the 5th wave!Hello! If you're following gold, here's some exciting news. The triangle correction phase that began in April is almost over. It's been a long journey, but we're almost there.
And guess what? The final phase is expected to reach around $4,300. But wait, there's more! The price is holding above the top of a long-term channel. This isn't just a random move; it could be a strong signal that the price could rise even higher than the $4,300 mark.
So, if you're following the gold market, keep your eyes peeled. Big moves could be just around the corner!
Gold Spot / U.S. Dollar (XAUUSD) - 4 Hour Chart (OANDA)4-hour chart from OANDA displays the price movement of Gold Spot (XAUUSD) from late July to early August 2025. The current price is $3,332.775, reflecting a decrease of $35.935 (-1.07%) as of 07:54 PM PKT on July 25, 2025. Key levels include a sell price of $3,332.480 and a buy price of $3,333.050. The chart shows recent volatility with a shaded support zone around $3,312.314 to $3,367.326, indicating potential price stabilization or reversal areas.

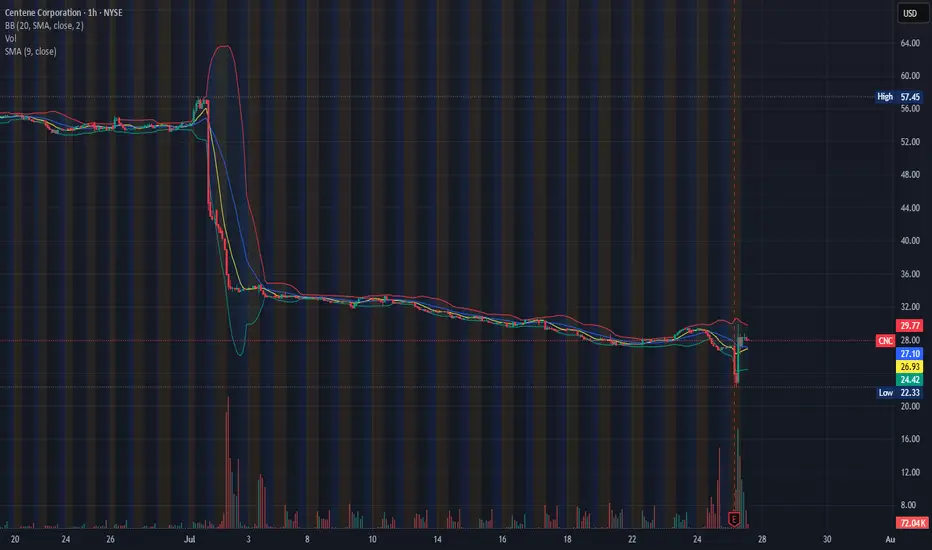
SOMETHING SEEMS NOT RIGHT: INSIDE TRADING?In the early hrs of 07/25/2025, between 6-7 am, right before the earning, the stock plummeted 16.16%. Can you smell inside trading here? because I do. Then, magically, during the earning call, with the promise of a " better future", the stock recovered and gained 6%. If you look for the beginning of the month, when the stock collapsed almost 50% from $57 - $34 you can tell what an empty promise looks like.
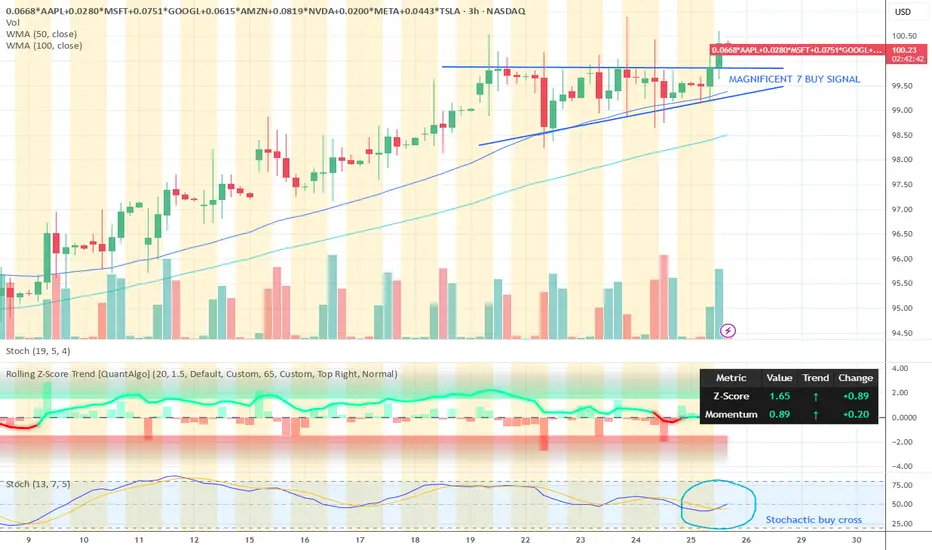
Magnificent 7 buy signalMagnificent 7 buy signal. These stocks are trading above their moving averages on 3 hour candle chart which is bullish. This basket made on tradingview consists of the 7 stocks.
Right now there is break through the resistance level and further upside is expected.
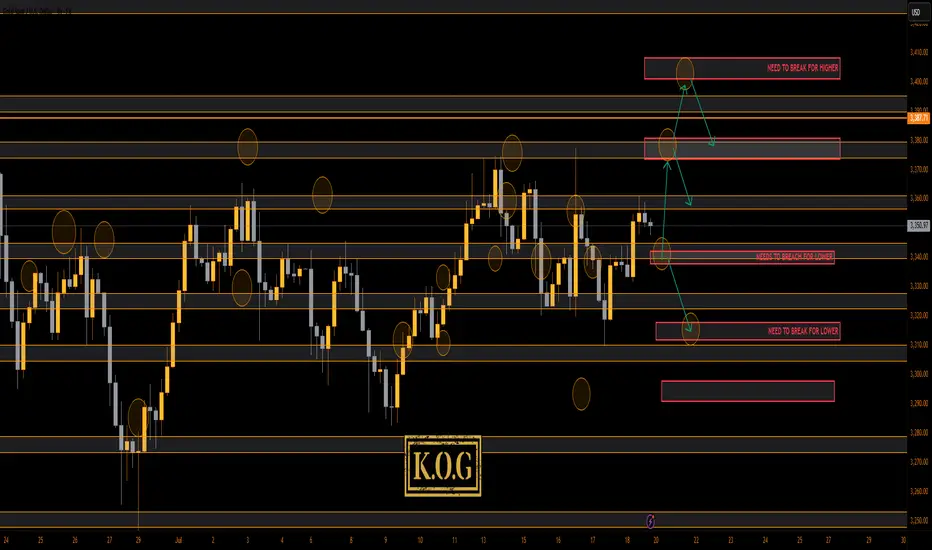
THE KOG REPORT THE KOG REPORT:
In last week’s KOG Report we said we would be looking for a price to attempt the higher level red box sitting around the 3370-75 region and if not breached, we felt an opportunity to short would be available from that region. We said if that failed and the move commenced, we would be looking at a complete correction of the move back down into the 3330-35 region, where we would then monitor price again in anticipation of a long from there or the extension level of 3310 which was also a red box short target (move complete). As you can see from the above, not only did we get that higher red box, we rejected, completed the move downside and then our traders managed to get that long trade all the way back up into the Excalibur target, red box targets and the hotspots shared in Camelot.
A decent week again, not only on Gold but also the numerous other pairs we trade, share targets on and analyse.
So, what can we expect in the week ahead?
For this week we can expect more ranging price action, but due to the previous range from last week being so tight, it looks like we’ll see a breakout coming in the latter part of the week unless there is news to bring us unexpected volume.
We have the key level below 3335-40 support and above that resistance and a red box sitting at 3375-80. This is the region that needs to watched for the break, and if broken we should hit the range high again at 3400-10. However, if rejected, we could again see this dip to attack that lower order region 3310-6 before attempting to recover.
Last week we wanted to see that curveball and although we did see some aggressive price action, I think we will see something extreme for this week. It’s that lower level 3310-6 that is a key region for bulls, if broken we can see a complete flush in gold taking us down into the 3250’s before we start the summer run. That for us would be the ideal scenario going into the month end, but, we’ll play it how we see and as usual, we go level to level and update any changes as we go along.
KOG’s Bias for the week:
Bullish above 3340 with targets above 3355, 3361, 3368, 3372 and above that 3385
Bearish below 3340 with targets below 3335, 3330, 3322, 3316, 3310 and below that 3304
RED BOX TARGETS:
Break above 3350 for 3355, 3361, 3367, 3375 and 3390 in extension of the move
Break below 3340 for 3335, 3330, 3320, 3310 and 3306 in extension of the move
Please do support us by hitting the like button, leaving a comment, and giving us a follow. We’ve been doing this for a long time now providing traders with in-depth free analysis on Gold, so your likes and comments are very much appreciated.
As always, trade safe.
KOG
USDJPY 30Min Engaged ( Bullish Entry Detected )————-
➕ Objective: Precision Volume Execution
Time Frame: 30-Minute Warfare
Entry Protocol: Only after volume-verified breakout
🩸 Bullish From now Price : 146.500
➗ Hanzo Protocol: Volume-Tiered Entry Authority
➕ Zone Activated: Dynamic market pressure detected.
The level isn’t just price — it’s a memory of where they moved size.
Volume is rising beneath the surface — not noise, but preparation.
🔥 Tactical Note:
We wait for the energy signature — when volume betrays intention.
The trap gets set. The weak follow. We execute.

SPX 0DTE TRADE IDEA – JULY 25, 2025
⚠️ SPX 0DTE TRADE IDEA – JULY 25, 2025 ⚠️
🔻 Bearish Bias with Weak Volume – Max Pain Looming at 6325
⸻
📊 Quick Market Snapshot:
• 💥 Price below VWAP
• 🧊 Weak Volume
• 📉 Max Pain @ 6325 = downside pressure
• ⚖️ Mixed Options Flow = no clear bullish conviction
⸻
🤖 Model Breakdown:
• Grok/xAI: ❌ No trade – weak momentum
• Claude/Anthropic: ✅ Bearish lean, favors PUTS near highs
• Gemini: 🟡 Slightly bullish bias, BUT agrees on caution
• Llama: ⚪ Neutral → No action
• DeepSeek: ❌ Bearish → No trade
⸻
📌 TRADE IDEA:
🎯 SPX 6365 PUT (0DTE)
💵 Entry Price: $0.90
🎯 Profit Target: $1.80 (💥 2x return)
🛑 Stop Loss: $0.45
📆 Expires: Today
🕒 Exit by: 3:45 PM
📈 Confidence: 65%
⏰ Entry Timing: OPEN
⸻
⚠️ Risk Flags:
• Low volume = fragile conviction
• Possible reversal if SPX breaks above session highs
• Max pain magnet at 6325 could limit gains or induce a bounce
⸻
🧠 Strategy:
Scalp it quick. Get in early. Exit before the gamma games explode into close.
📈 Like this setup? Drop a 🔽 if you’re playing puts today!
#SPX #0DTE #PutOptions #OptionsTrading #MaxPain #SPY #MarketGamma #TradingSetup
