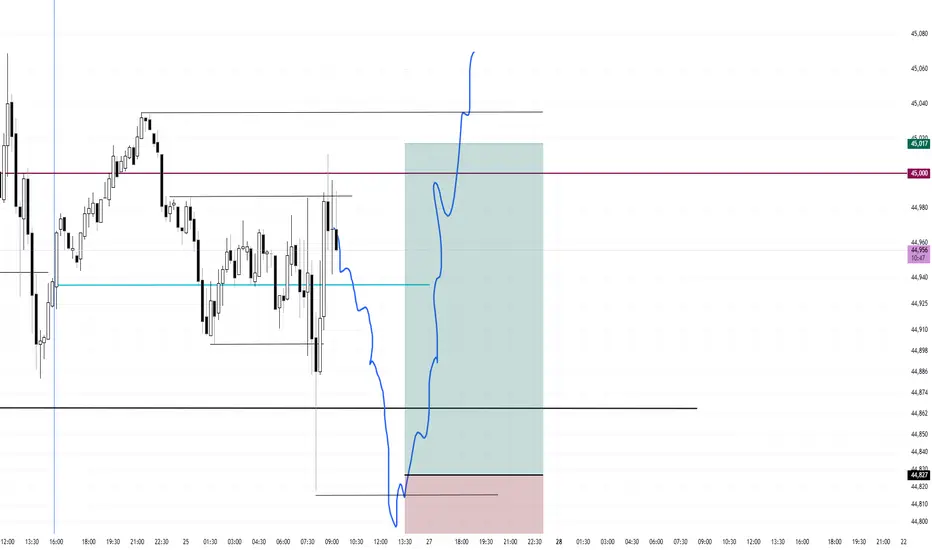
Range Bound Low of Day Buy (If Presented)Price is mean reverting around 45,000 and also mean reverting around today's open. I will be waiting for a mean reversion play under the low of day targeting the high of day.
I will be waiting for a small entry candle, a small doji. I did not take this first run up because the entry vs stop would have been too large. I believe the first mouse in will get dunked on.
Once entered, I will use a 75 tick stop and a 190 tick target for a 2.5 to 1
Community ideas
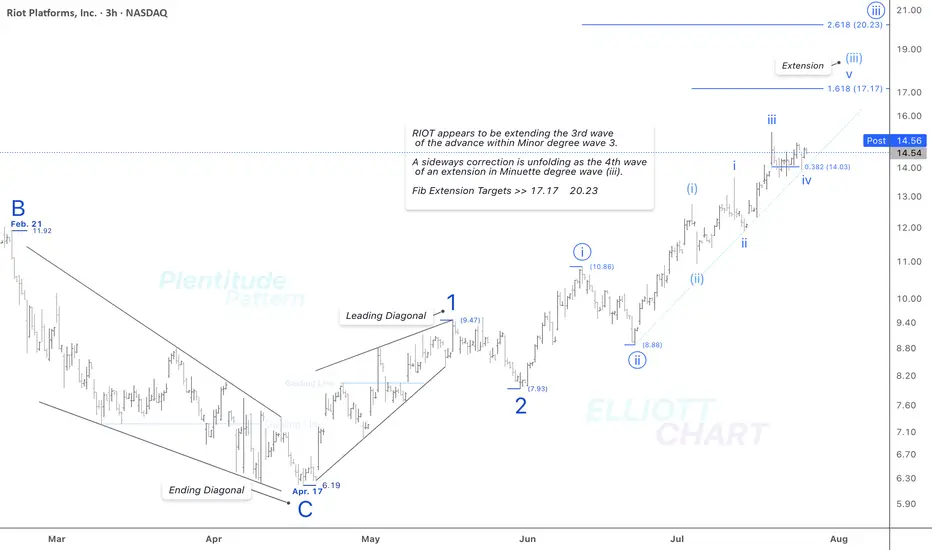
RIOT / 3hAs illustrated on the 3-hour chart above, NASDAQ:RIOT appears to be extending the third wave of an impulsive advance within Minor degree wave 3.
And as anticipated, a sideways correction is unfolding as the fourth wave of the ongoing extension in Minuette degree wave (iii).
Fib Extension Targets >> 17.17 & 20.23.
>>> In this timeframe, I'm analyzing the initial rising tide within the ongoing Intermediate degree wave (1), where a nested series of waves have quite well revealed: 1, 2 → i (circled), ii (circled) → (i), (ii) → i, ii. The extreme high of this impulsive sequence lies beyond the visible range of the current chart.
NASDAQ:RIOT CRYPTOCAP:BTC BITSTAMP:BTCUSD MARKETSCOM:BITCOIN
#CryptoStocks #RIOT #BTCMining #Bitcoin #BTC
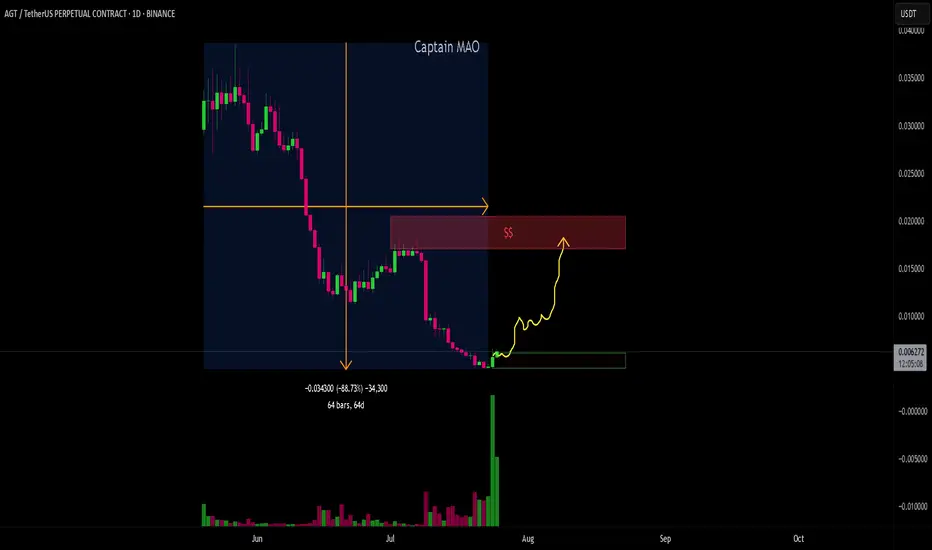
AGT/USDT - ReversalAGT/USDT has been under massive selling pressure since its listing on May 20, 2025, leading to a sharp ~90% decline. However, recent price action is showing strong signs of a potential reversal. Buyers have stepped in aggressively with a noticeable surge in volume, signaling a possible end to the downtrend. The current structure suggests the beginning of accumulation and a high-probability setup for a trend reversal. Targeting 0.018-0.02$ which huge liquidity can be found at this zone .
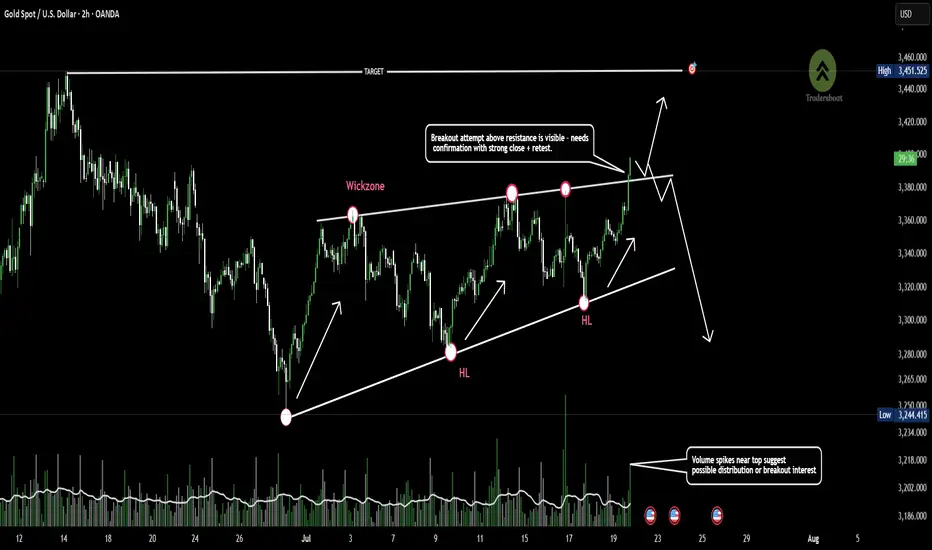
Gold approaches wedge resistance -Breakout or Fakeout incoming?Gold is trading within a rising wedge pattern, showing consistent higher lows and repeated rejections near the 3400 resistance zone.
Price is now approaching the upper trendline, an area of prior wick rejections and potential liquidity grab.
A confirmed breakout could signal continuation, while failure to sustain above this level may indicate bearish divergence or a reversal setup.👀📉
GOLD move up to 3419$Gold has the potential to start an upward move from the 3,343 and 3,331 levels. Reaching 3,419.86 is certain." CMCMARKETS:GOLD

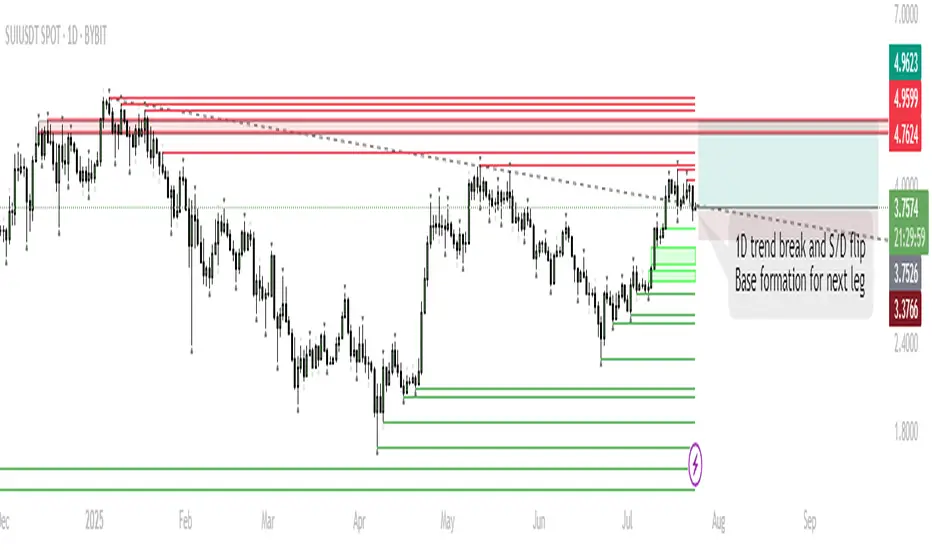
SUI – Base Formation for Next Leg HigherTrend Shift:
SUI has broken the 1D downtrend and is now consolidating above a key supply/demand zone, suggesting accumulation.
Short-Term Range:
Expect ranging/chop as price tests acceptance above broken resistance. This phase could last up to a week.
Trigger for Next Move:
Sustained closes above $4.0 will signal buyers are in control, opening the way for a move higher.
Targets:
If the base holds and SUI establishes above resistance, the next push is toward $5.10–$5.40 (previous highs/ATH zone).
Invalidation:
A sustained move below $3.37 would invalidate the bullish base thesis and open the door for deeper retrace.
SUI has flipped its 1D trend and is now consolidating above a key S/D level. Historically, such consolidations above reclaimed resistance often precede strong trend continuation. While a short-term range is likely as the market digests recent gains, the structure favors an eventual push toward previous highs and potentially new ATHs in August. Patience during this ranging phase is key; the setup remains bullish unless price falls back below $3.37.
DeGRAM | ADAUSD holding above the support level📊 Technical Analysis
● Mid-July breakout from the 10-week falling wedge cleared the long-term resistance line; price retested that line & the 0.756 support band (prior range high) and printed a higher-low on the rising channel’s lower rail.
● The new up-sloper guides bulls toward the channel crest / horizontal target at 0.880, while the 0.775–0.780 zone now acts as a launch pad for the next leg.
💡 Fundamental Analysis
● Buzz around August’s Chang governance hard-fork and a 12 % m/m jump in Cardano TVL signal improving network demand, backing the technical upside.
✨ Summary
Buy 0.775-0.790; hold above 0.756 eyes 0.86 ▶ 0.88. Bull view void on a 16 h close below 0.72.
-------------------
Share your opinion in the comments and support the idea with a like. Thanks for your support

BTC SELL Setup - Big Drop Loading Below Resistance!💙 BTC/USDT Rejection Confirmed ! SELL!
👨💻 Dear traders,
After careful analysis of the recent price action on BTC/USDT (1H timeframe), here is the conclusion:
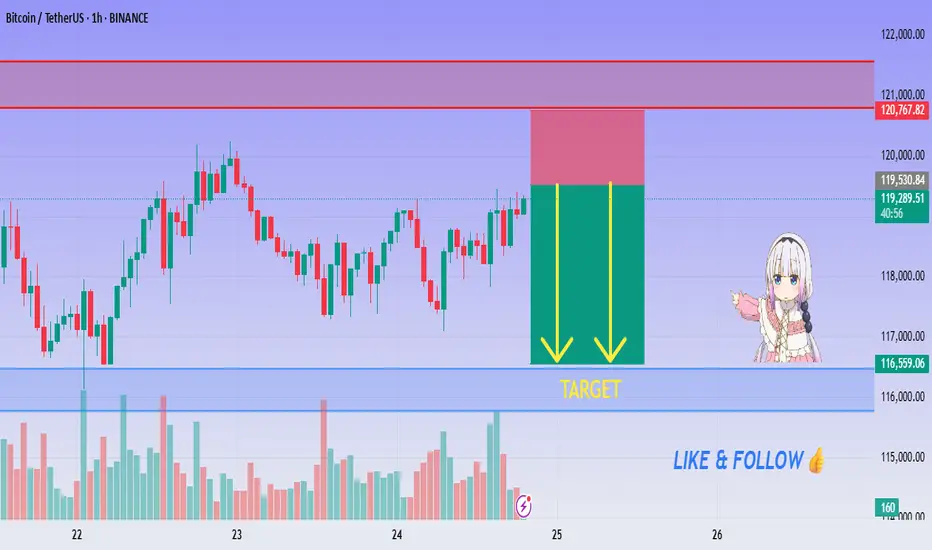
Price has entered a strong supply zone between $120,000 – $121,000, where clear signs of rejection have appeared.
Bias – Bearish
🎯 Target – $118,000
🎯 Target – $117,000
🎯 Final Target – $115,000
🛑 Safe Stop Loss – $121,200
📊 Reasoning:
– Price touched key resistance and is showing double rejection wicks
– Bearish momentum building below the red zone
– Two yellow arrows highlight expected move range (target box)
– Clear risk-to-reward with defined SL above zone
– Volume confirming slowing bullish pressure
🌟 Stay patient, follow risk management & trade safe!
🍀 WISHING YOU GREEN PIPS! 💰
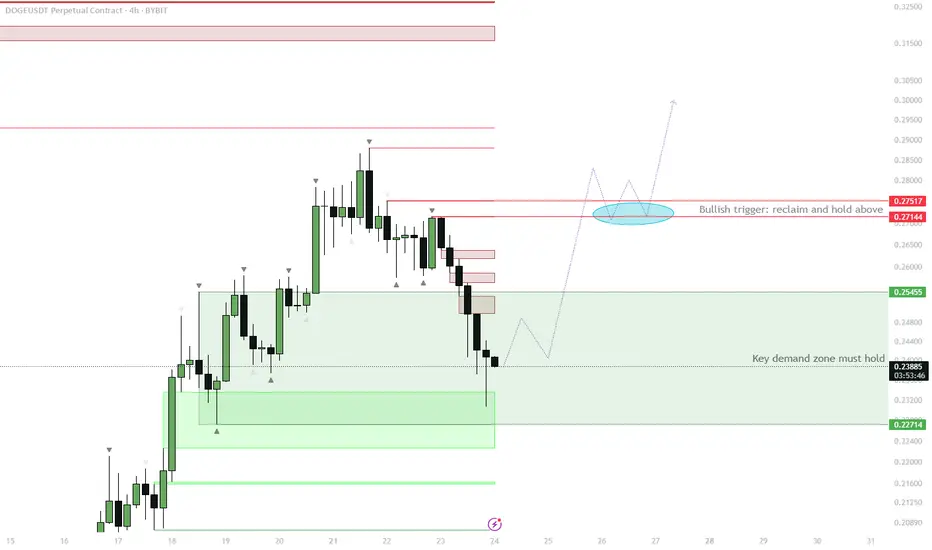
DOGE H4 – Demand Zone Reclaim as Bullish Trigger
Price is currently testing the H4 demand zone (~0.227–0.254).
Watch for price to reclaim the demand zone and close back above 0.254.
If confirmed, expect a move up toward the red resistance cluster at 0.271–0.275.
Consolidation above this area (highlighted in blue) would be a strong signal for continuation.
Invalidation: clean breakdown and acceptance below 0.227 signals failure of demand and deeper retrace.
This setup aims to capitalize on a classic liquidity sweep and demand reclaim. Typically, after taking out the flat open and collecting late shorts/stop losses, strong buying often steps in if demand is genuine. A successful reclaim and consolidation above the previous resistance will set the stage for bullish continuation. If this zone fails to hold, the move is invalidated and lower targets come into play. Waiting for confirmation reduces the risk of a failed bounce.
XAG longXAG prices may rise from $37.9, located at the FVG Zone and Leg of BAT Pattern , towards the targets .

HEI/USDT - Higher !!showing strong bullish price action, consistently printing higher highs and higher lows with aggressive buyer pressure. The structure indicates sustained momentum, and the current consolidation above recent support suggests strength.
marked the green box as a buy zone starting from the current market price, as this area aligns with previous S/R flip zone turned support. This provides a favorable entry for continuation toward the next key resistance levels.
SL : 0.32

XAUUSD FORMING A CONTRACTING TRIANGLEXAUUSD is forming a contracting triangle which is much visual on the Daily T.F.
This is a continuation pattern.Since Wave 3 is completed,Wave 4 is forming a contracting triangle which is time consuming which can lead to permature trade entries or missed opportunities.
Best trade is to wait for the completion of Wave 4 at the 3055 level,which may push prices higher to the 3850 level a new high.

How can we seize the golden opportunity steadily and accurately?Yesterday, gold showed a trend of falling first and then rising to bottom out and rebound. After falling back to 3351, it quickly rebounded to around 3377. The overall fluctuation rhythm was highly consistent with our prediction. We accurately grasped the opportunity to arrange long orders and promptly notified the high position to reduce positions and make profits. The rhythm was properly controlled and we gained good returns.
From a technical point of view, the four-hour line fell and rebounded, and the short-term short momentum slowed down. Although it has not completely turned into a long structure, the short trend is no longer valid. At this stage, we will not look at new lows for the time being, and the operation is mainly based on the main long idea. At the daily level, pay attention to the long-short watershed of 3385. If it breaks through this level, it is expected to open up the upward space and look to 3392 or even above 3400; if it does not break, the market may continue the shock and wash pattern. Pay attention to the support below around 3365-3350. As long as it does not break and stabilizes, you can still choose to arrange low and long positions. In the short term, pay attention to the breakthrough of the rebound high point 3377. If it successfully stands firm, it will further enhance the continuity of the long position.

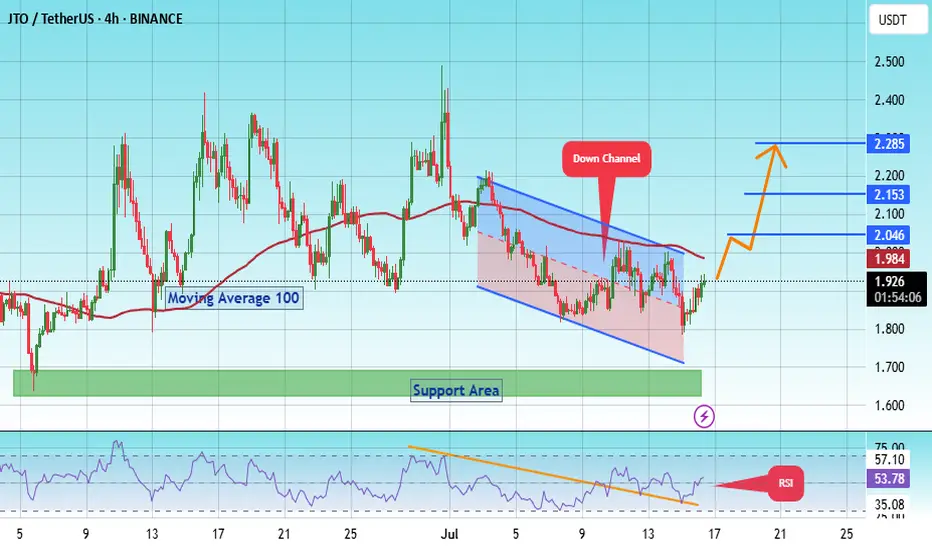
#JTO/USDT Forming Bullish Wave #JTO
The price is moving within a descending channel on the 1-hour frame, adhering well to it, and is on its way to breaking it strongly upwards and retesting it.
We have a bounce from the lower boundary of the descending channel. This support is at 1.73.
We have a downtrend on the RSI indicator that is about to be broken and retested, supporting the upside.
There is a major support area in green at 1.65, which represents a strong basis for the upside.
Don't forget a simple thing: ease and capital.
When you reach the first target, save some money and then change your stop-loss order to an entry order.
For inquiries, please leave a comment.
We have a trend to hold above the 100 Moving Average.
Entry price: 1.92.
First target: 2.046.
Second target: 2.15.
Third target: 2.28.
Don't forget a simple thing: ease and capital.
When you reach the first target, save some money and then change your stop-loss order to an entry order.
For inquiries, please leave a comment.
Thank you.
GOLD Melted , 2 Best Places To Sell Clear , Don`t Miss 200 Pips Here is My 30 Mins Gold Chart , and here is my opinion , we Again Below 3377.00 and we have a 30 Mins Candle closure below this strong res , so i`m waiting the price to go back and retest this res and new support and give me a good bearish price action to can enter a sell trade and we can targeting 200 pips , and we have a good res @ 3365.00 we can sell from it also if the price didn`t reach 3377.00 and targeting from 100:200 pips , and if we have a Daily Closure below This res this will increase the reasons for us , just wait the price to back a little to retest it and then we can sell it . if we have a daily closure aboveit this idea will not be valid anymore .

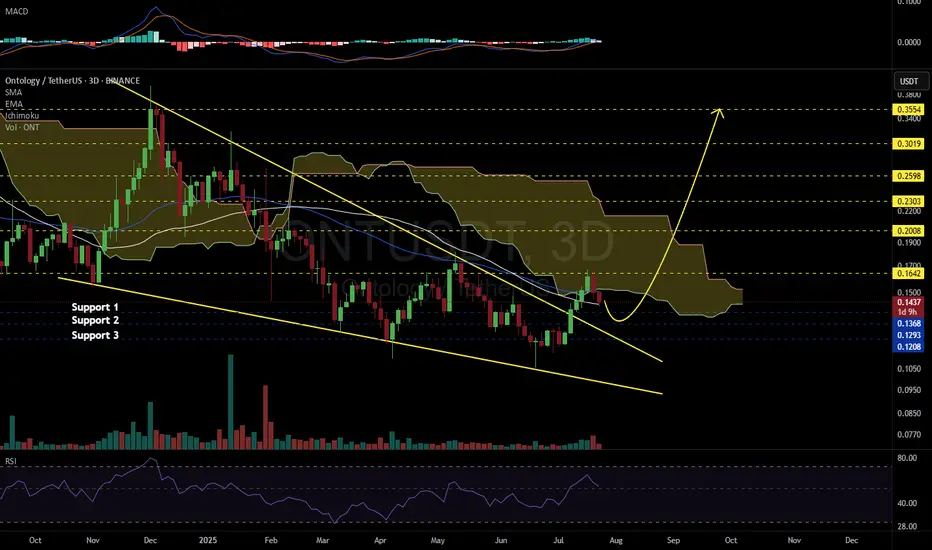
ONTUSDT 3D#ONT has broken above the large falling wedge pattern on the 3-day chart. It was recently rejected from both the Ichimoku Cloud and the 3-day EMA50, but is still holding above the SMA50 — a positive sign.
📌 Consider laddered entries at the current price and key support levels:
🔹 $0.1368
🔹 $0.1293
🔹 $0.1208
In case of a successful bounce, the upside targets are:
🎯 $0.1642
🎯 $0.2008
🎯 $0.2303
🎯 $0.2598
🎯 $0.3019
🎯 $0.3554
⚠️ As always, use a tight stop-loss and apply proper risk management.
MOVR (SPOT)BINANCE:MOVRUSDT
#MOVR/ USDT
Entry (5.000- 5.700)
***** (Wait for the price to come to the entry range & price may come to the lowest entry point ) ******
SL 4H close below 4.900
T1 7.00
T2 9.50
T3 12.00
Extra Target
T4 13.50
_______________________________________________________
Golden Advices.
********************
* collect the coin slowly in the entry range.
* Please calculate your losses before the entry.
* Do not enter any trade you find it not suitable for you.
* No FOMO - No Rush , it is a long journey.

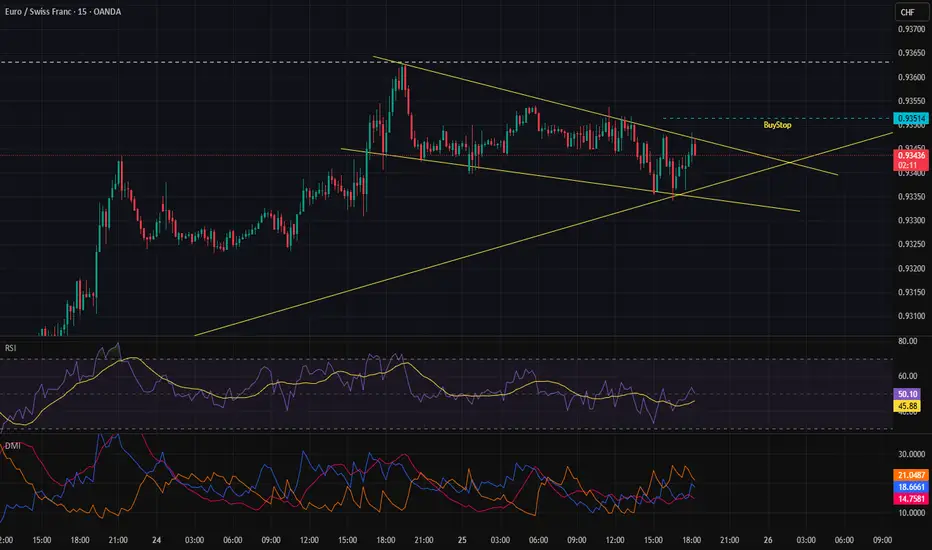
USDCHF sellUSD/CHF is currently in a downtrend, with the US Dollar exhibiting weakness throughout the year. From a technical standpoint, the pair appears poised for further decline, given the formation of a bearish flag. If considering this trade, it's essential to prioritize risk management or look for a potential retest of the flag's resistance level (or the apex of an ascending wedge, if applicable) before entering a short position.

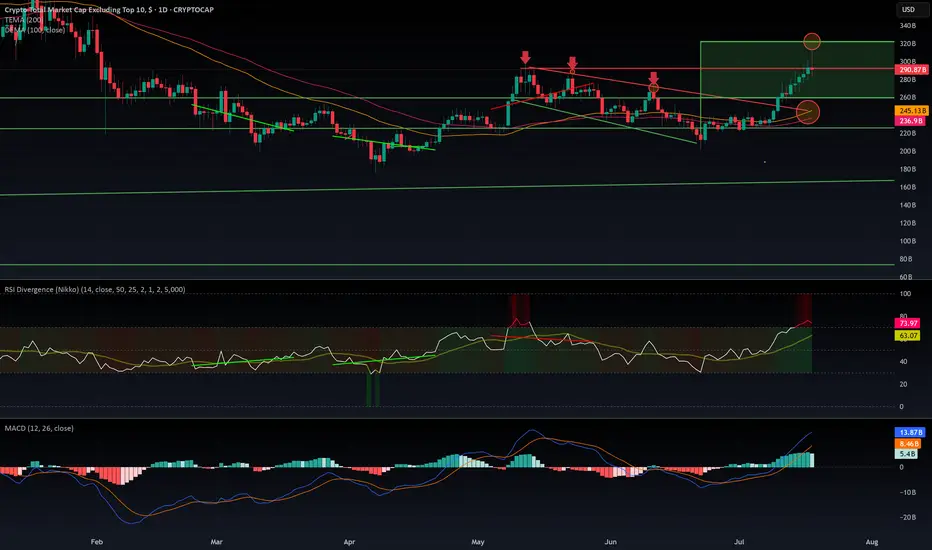
$OTHERS rejected from $320 B resistance. What is next?CRYPTOCAP:OTHERS Rejected at $320B: Is the Altseason on Pause?
CRYPTOCAP:OTHERS just got rejected at the $320B resistance after a decent pump — the kind that usually signals the start of an altseason. But if we dig into the indicators, warning signs are flashing:
- MACD is sitting in overbought territory.
- RSI is heavily extended, signaling potential exhaustion.
- EMA 100 & 200 are colliding with the top of a previous downtrend channel — a zone that historically acted as strong resistance.
The rejection was sharp. So what's next? Are we entering a range between $320B and $260B? It's quite possible. The aIf you wantltcoin market now sits at a decision point: either it keeps pushing higher or takes a breather — potentially pausing the rally until September.
Historically, August is a slow month in the West. People go on vacation, volumes drop, and markets tend to cool off. This seasonal pattern supports the idea of a consolidation phase before a stronger second leg of altseason kicks off in mid-September and carries into Q4.
I’m not posting too many ideas lately because the market landscape has changed. The new players aren’t just trading — they’re manipulating flows with massive capital to hunt retail liquidity.
They’re also using far more sophisticated tools than our classic MACD and RSI — including AI-powered indicators and multi-layered analytics that are beyond retail reach.
In this new environment, predictions are harder and risk is higher.
🧠 Do Your Own Research (DYOR), stay sharp, and don’t blindly trust social influencers.
SAHARAUSDT Forming Bullish PennantSAHARAUSDT is currently forming a bullish pennant pattern, a continuation pattern that often signals the resumption of an upward trend after a brief consolidation. This pattern, combined with strong volume support, is a positive technical indicator suggesting the potential for a significant breakout. Traders are now watching for a confirmed move above the pennant resistance, which could propel the price to new short-term highs. Based on the pattern’s breakout projection, an 80% to 90%+ gain seems realistic in the coming sessions.
SAHARA has been gaining traction among investors due to its unique ecosystem and expanding real-world applications. With increased social media buzz and rising transaction volumes, sentiment around the project appears to be shifting toward the bullish side. This renewed investor interest could act as a fundamental catalyst to support the anticipated technical breakout.
Furthermore, the overall structure of SAHARAUSDT shows consistent higher lows forming into the apex of the pennant, reflecting growing buying pressure. The breakout from this structure, especially with increasing volume, typically indicates a strong follow-through move. With broader market momentum aligning and attention turning back to micro-cap altcoins, SAHARA may stand to benefit from speculative capital rotation.
With the chart structure supporting bullish continuation and volume confirming underlying demand, SAHARAUSDT is shaping up to be a strong candidate for aggressive upside potential. It's a setup that technical traders and short-term swing investors may want to keep close on their radar.
✅ Show your support by hitting the like button and
✅ Leaving a comment below! (What is You opinion about this Coin)
Your feedback and engagement keep me inspired to share more insightful market analysis with you!

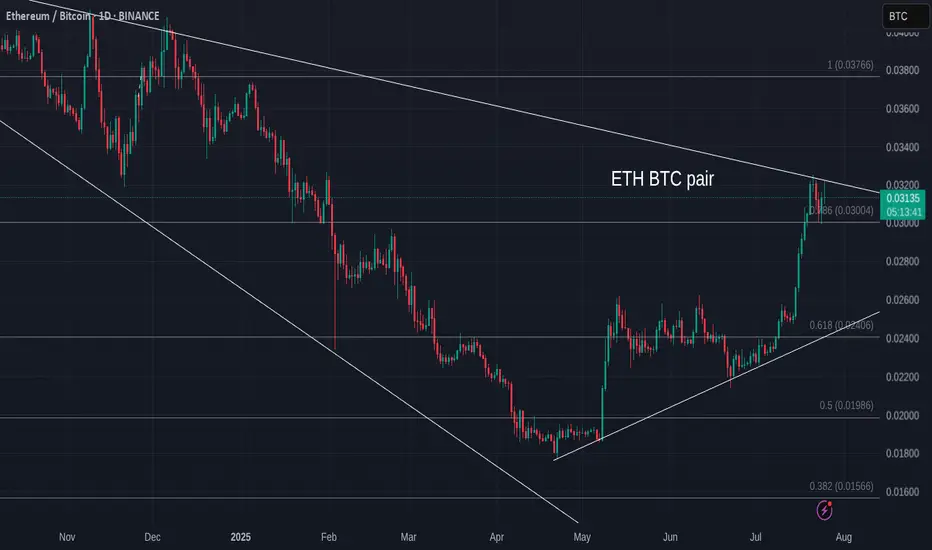
ETH Versus BTC - Daily Update - Bitcoin still winning
As mentioned yesterday, ETH has hit long term resistance and got rejected....and it is happening again
ETH seems unable to find the moemntum just yet.
The MACD Daily is still turning Bearish
The Daily RSI is also up high and likely to fall
The weekly RSI is also high though the Weekly MACD has still yet to rise above Neutral
All in All, for me, it is NOT the time....Though we can see that ALTS are running Hot though not a full ALT season as we have seen in the past.
It is fragile...please remain CAUTIOUS
Placing a buy stop here could be reasonable.Because of the consolidation and the trend behind it, it seems reasonable to place a buy stop so we don’t miss out in case of a sharp move.