XAU/USD (Gold Spot vs US Dollar) Technical Analysis – 4H Char🔍 XAU/USD (Gold Spot vs US Dollar) Technical Analysis – 4H Chart
Based on my shared image from TradingView, here's a detailed analysis of the current XAU/USD market scenario:
---
🧩 Chart Type & Indicators Used
Timeframe: 4-Hour (H4)
Platform: TradingView
Indicators:
Ichimoku Cloud
Bollinger Bands (BB)
Support/Resistance zones
Trendlines
Price Action with Target Points Marked
---
📉 Current Market Structure
Price: ~$3,324 (Sell/Buy zone shown)
Overall Trend: Turning bearish in the short term.
Price Action:
Price has broken below an ascending trendline, suggesting a shift from bullish to bearish momentum.
The price is trading below the Ichimoku cloud, reinforcing a bearish bias.
Failed retest of the cloud resistance zone (around 3,335–3,340), which now acts as a resistance.
---
🔻 Bearish Signals
1. Trendline Break:
The rising trendline support (mid-July to now) is broken.
This indicates a potential reversal from the previous bullish momentum.
2. Retest & Rejection:
Price attempted to retest the breakdown zone and was rejected from the 3,335–3,340 level.
3. Ichimoku Cloud Bearish Setup:
Price is clearly below the cloud.
Future cloud is bearish (red shaded).
Chikou Span (lagging line) is below price candles and cloud.
---
🎯 Targets
First Target Point: ~3,300
This is the next horizontal support level (near recent lows).
Final Target Point: ~3,270
Stronger support zone and measured move from breakdown.
---
🛡 Resistance Zone
Immediate Resistance: 3,335–3,340
Stronger Resistance: 3,370
---
📌 Conclusion
The XAU/USD 4H chart shows a bearish breakout below the rising channel, with confirmation from Ichimoku and price rejection at cloud resistance. The market is targeting 3,300 as the first support, and if that breaks, 3,270 will likely follow.
---
✅ Strategy Suggestion (if trading):
Bias: Short/Sell
Entry: After a weak pullback or retest near 3,330–3,335
Targets:
TP1: 3,300
TP2: 3,270
Stop Loss: Above 3,345 or near 3,350 zone
Let me know if you'd like this in simpler terms or want me to track the next setup.
Community ideas

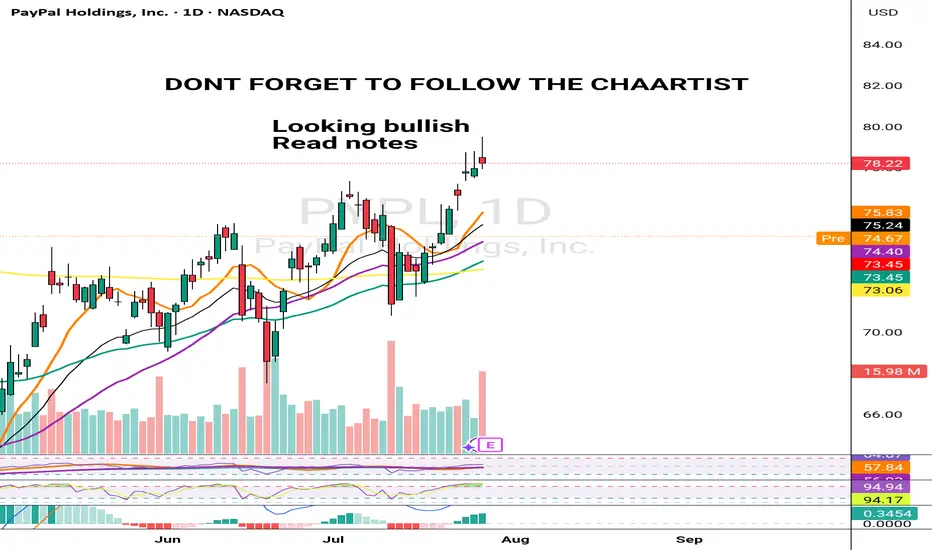
PYPL LOOKING BULLISH JULY 29 2025Pypl is lloking good to go long. Whenever I trade at current price rule is clear that you manage your risk and quantities properly. Dont blindly trade in a hope to make quick money. Pypl looking good to go to $85 soon
Lingrid | USDJPY Potential Channel Breakout. LongFX:USDJPY is retesting the breakout zone after reclaiming support from a prior swap area near 146.9. Price action has broken above a downward trendline and is forming a bullish retest structure. As long as USDJPY holds above 146.920 zone, the setup favors a continuation toward the resistance barrier. A breakout above the red descending trendline could accelerate upside momentum.
📉 Key Levels
Buy trigger: Break and hold above 147.500
Buy zone: 146.900 – 147.000
Target: 148.250
Invalidation: Break below 146.000
💡 Risks
Failure to break the descending red trendline may trigger renewed selling
Consolidation below resistance could signal buyer exhaustion
Break below 146.000 would invalidate bullish retest setup
If this idea resonates with you or you have your own opinion, traders, hit the comments. I’m excited to read your thoughts!

Bitcoin Dominance Still Bearish · Bullish Altcoins ContinuesThe Bitcoin Dominance Index will continue bearish as long as the action happens below resistance as shown on the chart.
An uptrend has been broken with the highest volume in a single session since February 2021. When this same signaled showed up back in Feb. 2021, what follows was a major drop (a marketwide bull-run.).
Seeing Bitcoin Dominance in the same situation as in early 2021 predicts the start of the 2025 bull market phase. This is all to say that the Altcoins market will continue to grow; Bitcoin will continue to consolidate to end up moving higher; the altcoins will resume growing within days.
The chart supports only little time for a break before the next bearish continuation, it should happen within days. At this point, the altcoins will rally up. We are very close and indeed we are already in-the-action. These short retraces should be used as opportunity to rebuy and reload.
Namaste.

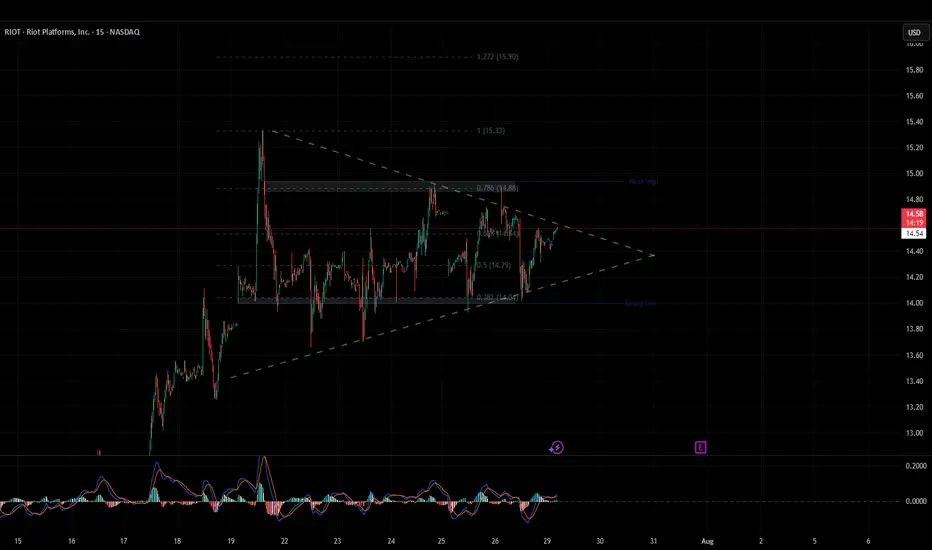
RIOT breakout soon?Looking at the TA, there’s a wedge forming over the past few days – not the cleanest setup, so mind your risk. But take a look at the option flow: I’m clearly not the only one eyeing this move. A few whales have been scooping up calls, sizeably above the usual flow.
media.discordapp.net
media.discordapp.net
XUA/USD) Bearish Trend Read The captionSMC Trading point update
Technical analysis of (XAU/USD) on the 1-hour timeframe, targeting a move toward the $3,310–$3,315 support zone. Here's the full breakdown:
---
Technical Analysis – Gold (1H)
1. Fair Value Gap (FVG) Supply Zones
Two FVG supply zones are marked where price previously dropped sharply:
Upper FVG zone near $3,385.49 (with red arrow: expected rejection point)
Lower FVG zone near $3,352.47
Price is expected to reject from either zone, resuming the bearish move.
2. Market Structure: Lower Highs, Lower Lows
The chart shows a clear bearish structure, with consistent lower highs and lower lows.
The current price action suggests a potential pullback into FVG, followed by another leg down.
3. Key Support Zone (Target Area)
The yellow box between $3,315.22–$3,310.99 represents a strong demand/support zone and is marked as the target point.
This level has acted as a prior accumulation zone and is likely to attract buying interest again.
4. EMA 200 Resistance
Price is trading below the 200 EMA (currently at $3,365.87) — indicating a bearish bias.
EMA also aligns near the lower FVG zone, reinforcing the area as a potential reversal point.
5. RSI Indicator
RSI at 35.38 is nearing oversold territory but still shows downward pressure.
No divergence or reversal signal yet — supports the continuation view.
Mr SMC Trading point
---
Summary
Bias: Bearish
Current Price: $3,337.02
Supply Zones (FVG):
$3,385.49 (stronger supply)
$3,352.47 (minor supply)
Support Target: $3,315.22–$3,310.99
Structure: Bearish (LL-LH formation)
EMA: 200 EMA acting as dynamic resistance
RSI: 35.38 – still bearish momentum
---
Please support boost 🚀 this analysis)
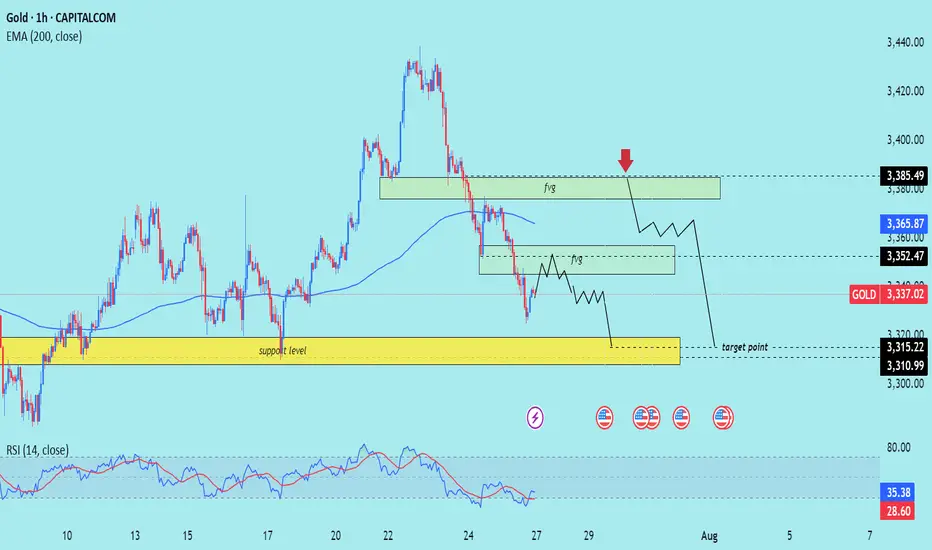
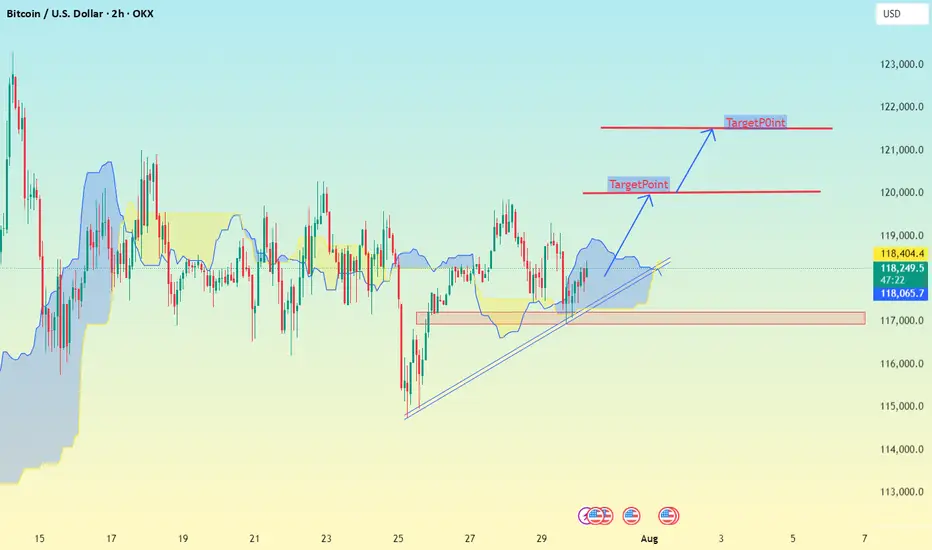
Chart Analysis (2h Timeframe)✅ Chart Analysis (2h Timeframe)
MY using Ichimoku Cloud, support/resistance zones, and trend lines.
Price is currently around 118,319 USD.
It has broken out of the Ichimoku cloud and is respecting the trendline support, indicating bullish momentum.
---
🎯 Upside Target Levels
🔵 Target 1:
Level: ~120,000 USD
Reason: Horizontal resistance (clearly marked)
Action: Minor profit-taking or partial exit
🔵 Target 2 (Main):
Level: ~122,000 USD
Reason: Second resistance zone & projected move from breakout
Action: Ideal full target zone
---
🔻 Support & Invalidations
🟡 Immediate Support Zone:
Levels:
118,404
118,296
118,065
These are dynamic Ichimoku & short-term support levels
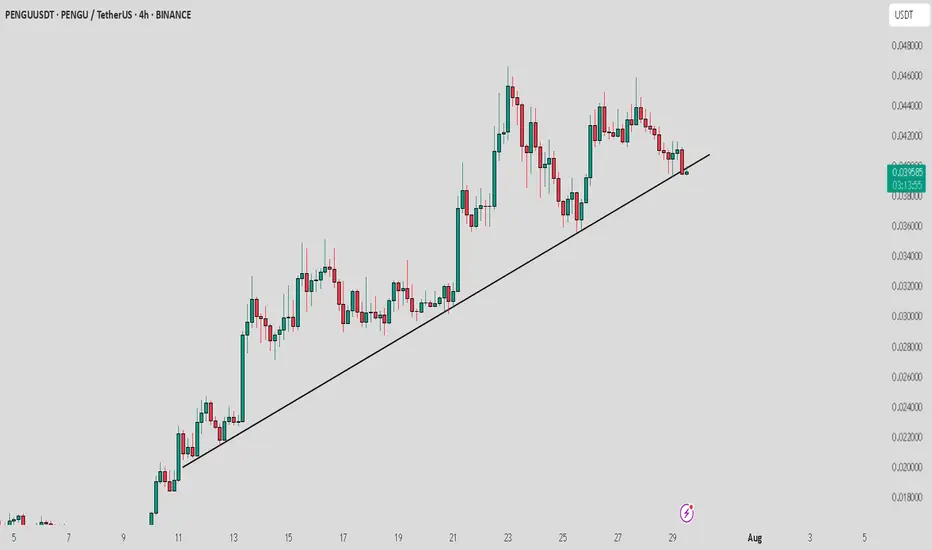
PENGU / USDT : Breaking down from Trendline supportPENGU/USDT is breaking down from the trend line support, but the retest is still in progress. Watch for rejection at key levels.
Pro Tip: Wait for confirmation of rejection before entering the trade and always apply proper risk management to safeguard your position.
Amd - New all time highs will follow!🪠Amd ( NASDAQ:AMD ) rallies even much further:
🔎Analysis summary:
After Amd perfectly retested a major confluence of support a couple of months ago, we saw a textbook reversal. This retest was followed by a rally of more than +100% in a short period of time. But considering all the bullish momentum, Amd is far from creating a top formation.
📝Levels to watch:
$200
SwingTraderPhil
SwingTrading.Simplified. | Investing.Simplified. | #LONGTERMVISION

Bullish Sentiment Returns to Gold?Hello everyone, what are your thoughts on XAUUSD?
From a technical perspective, XAUUSD has just retested its long-term ascending trendline and formed a bullish reaction candle, suggesting that buying pressure may be returning.
Recently, a survey of 206 investors revealed that market sentiment remains optimistic, with 66% expecting gold prices to continue rising, 19% predicting a decline, and 15% anticipating a sideways market.
What do you think? Share your opinion in the comments!

Lingrid | USDJPY Possible Strong Bullish RallyThe price perfectly fulfilled my previous idea . FX:USDJPY is trading within an upward channel after forming a higher low near the 147.50 zone, bouncing from the support trendline. Price action suggests a bullish structure continuation toward the 150.95 resistance, especially if the recent consolidation breaks higher. The overall formation aligns with a healthy correction phase before a potential push into the resistance area. Confirmation above 148.60 would likely accelerate the bullish move.
📌 Key Levels Buy zone: 147.50–147.25
Sell trigger: Below 147.00
Target: 150.95
Buy trigger: Break above 148.80
⚠️ Risks
Break below 147.50 may shift sentiment bearish
Strong resistance awaits near 150.00
Broader market volatility could invalidate pattern
If this idea resonates with you or you have your own opinion, traders, hit the comments. I’m excited to read your thoughts!

GBPJPY starts corrective downtrend. Ready to SELL✏️ OANDA:GBPJPY has broken the trendline structure and broken the disputed zone. Price is heading towards the support zone ahead around 197.000. This is considered a breakout zone for DCA rather than BUYing at this zone. The downtrend of GBPJPY may extend to the bottom of last week.
📉 Key Levels
SELL now GBPJPY 198.000
SELL trigger: Break support zone 197.000
Target 195.500
Leave your comments on the idea. I am happy to read your views.

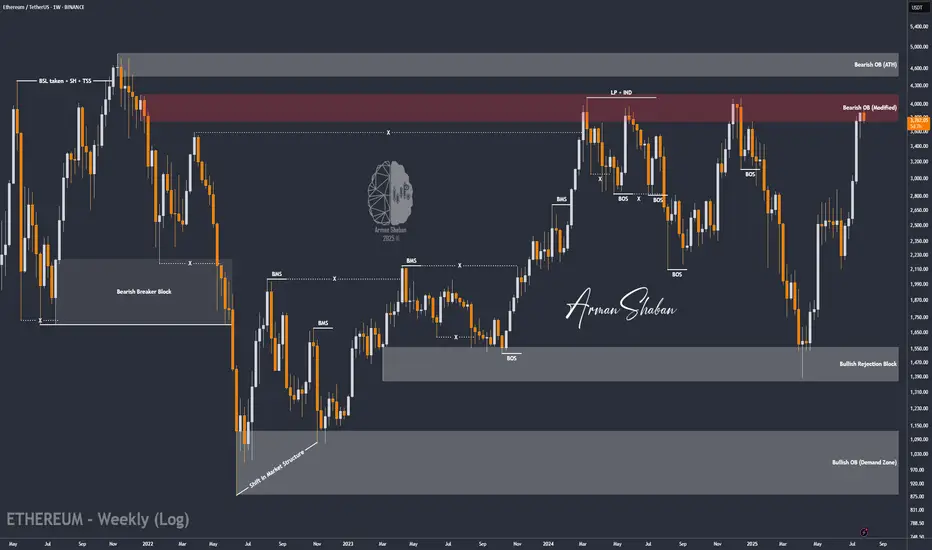
ETH/USDT | at a Crossroads – Hold Above $3440 or Sharp Fall!By analyzing the Ethereum chart on the weekly timeframe, we can see that after reaching $3940 and touching the key supply zone, ETH entered a slight correction and is currently trading around $3756. The key question now is whether it can hold above $3440 by the end of the week and push past $4000. If it does, we can expect another bullish leg toward $4100 and $4470. However, if the $3440 support fails, a sharp decline may follow — so this level is critical.
Please support me with your likes and comments to motivate me to share more analysis with you and share your opinion about the possible trend of this chart with me !
Best Regards , Arman Shaban
DeGRAM | EURUSD reached the lower boundary of the channel📊 Technical Analysis
● Price sliced through the channel mid-support and the inner trend-fan, closing below 1.1573; the break was retested (grey circle) and rejected, confirming a bear continuation from the sequence of lower-highs.
● The move unlocks the descending channel’s lower rail near 1.1450, while interim demand sits at the May pivot / 0.618 swing 1.1520.
💡 Fundamental Analysis
● EZ data underwhelmed (German Ifo, EZ consumer-confidence) just as Fed officials warned rates may stay “restrictive for longer,” widening the short-rate gap and refreshing USD bids.
✨ Summary
Short 1.1590-1.1615; hold below 1.1573 targets 1.1520 ➜ 1.1450. Bias void on an H1 close above 1.1660.
-------------------
Share your opinion in the comments and support the idea with a like. Thanks for your support!

BTCUSD trading signal. False break of bottom line✏️ CRYPTO:BTCUSD just False Break the lower band and is establishing a bullish wave structure in the H4 time frame. 119700 will be the top of wave 1 if the current bullish wave exceeds the top it will form a bullish DOW pattern heading towards a new ATH.
📉 Key Levels
BUY Now BTCUSD: Confirmation of candle when retesting Fibonacci 0.5
Target 127000
Leave your comments on the idea. I am happy to read your views.

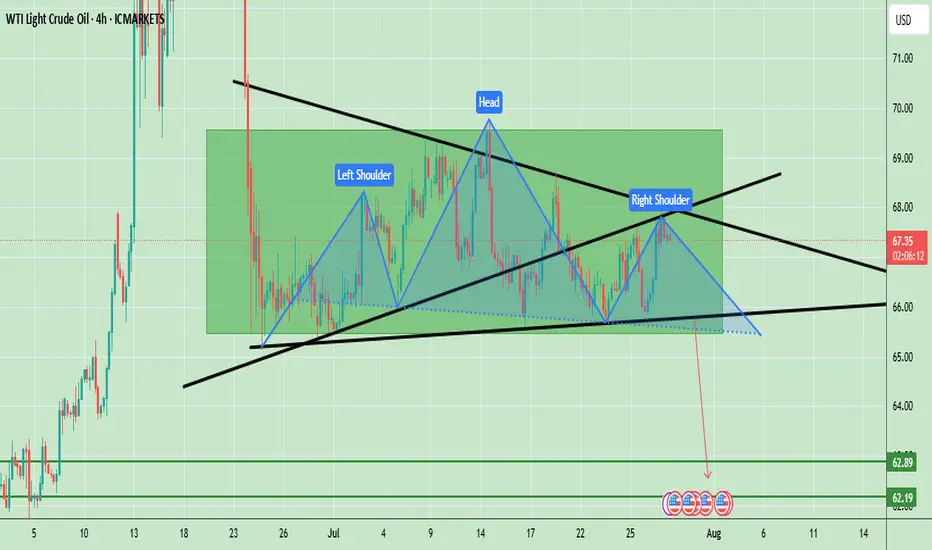
Oil Prices Form Bearish Head & Shoulders – Key Neckline in FocusWTI crude oil is showing a clear Head and Shoulders (H&S) pattern, which is a strong bearish reversal signal. The left shoulder formed in early July, followed by a higher peak forming the head in mid-July, and finally the right shoulder near the current levels, which is lower than the head. The neckline is positioned around $66.00, acting as a key support level. Currently, the price is trading at $67.34, hovering slightly above this neckline, indicating that the market is at a critical decision point. A confirmed break below the neckline could accelerate bearish momentum, targeting the $62.20 – $62.80 zone based on the pattern’s measured move. However, if the neckline holds, a possible bounce toward $68.50 – $69.00 could occur, but overall bias remains bearish unless the price can break and sustain above $69.00.
Key Price Levels:
- Resistance: $68.50 – $69.00
- Neckline Support: $66.00
- Bearish Target (if confirmed): $62.20 – $62.80
Note
Please risk management in trading is a Key so use your money accordingly. If you like the idea then please like and boost. Thank you and Good Luck!
Gold Drops After Failing to Hold Above $3322📊 Market Overview:
Gold initially surged above the $3322 resistance, hitting $3329 amid Fed pause expectations. However, a rebound in the US dollar and profit-taking triggered a sharp drop back to $3315, signaling weakening bullish momentum.
📉 Technical Analysis:
• Key resistance: $3322 – $3330
• Nearest support: $3308 – $3300
• EMA09 (H1): Price has fallen below EMA09 → turning short-term trend bearish
• Candlestick / Volume / Momentum:
• Failed breakout above $3322 with strong bearish H1 reversal
• Increasing volume during the drop → rising selling pressure
📌 Outlook:
Gold may continue declining in the short term if it fails to hold above $3312. Bears have taken control after the failed breakout attempt. Risk increases for a move toward $3300–$3295.
💡 Suggested Trade Setup:
🔻 SELL XAU/USD : $3318 – $3321
🎯 TP: 40/80/200 pips
❌ SL: $3325
🔺 BUY XAU/USD: $3295 – $3292 (only with clear bullish signal)
🎯 TP: 40/80/200 pips
❌ SL: $3288

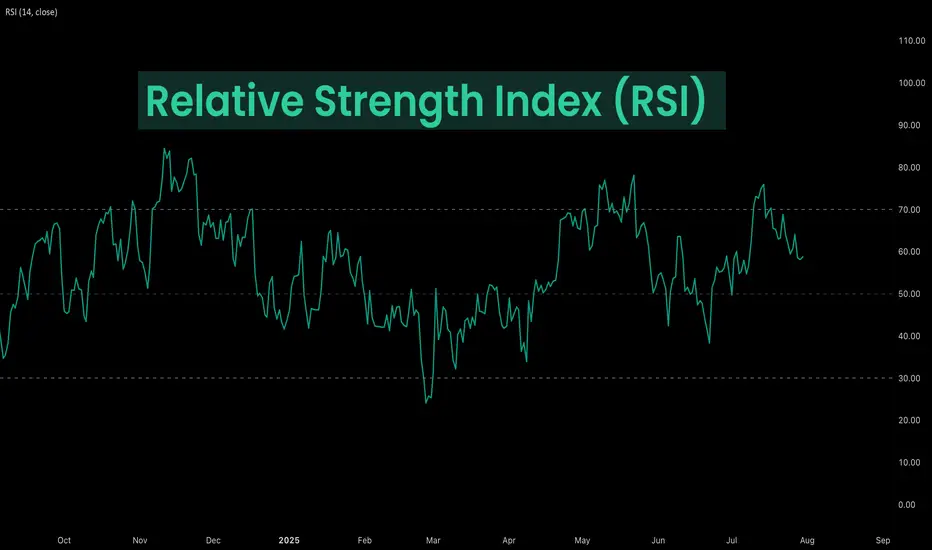
Deep Dive Into Relative Strength Index (RSI)The Relative Strength Index (RSI) is a momentum oscillator developed by J. Welles Wilder Jr. that measures the speed and magnitude of price changes.
Introduction
In the world of trading, timing is everything — and few indicators have stood the test of time like the Relative Strength Index (RSI). Introduced by J. Welles Wilder in 1978, the RSI is a momentum oscillator that helps traders evaluate the strength and speed of price movements. Whether you're trading stocks, forex, or crypto, understanding how RSI is calculated and how to interpret its signals can give you a critical edge.
In this article, we’ll break down exactly how the RSI works, explore its formula, and dive into practical ways you can incorporate it into your trading strategies. From spotting potential reversals to identifying overbought and oversold conditions, the RSI remains a cornerstone of technical analysis — but only if you know how to use it properly.
Let’s explore the mechanics and the mindset behind this powerful indicator.
What Is RSI and How Is It Calculated?
The Relative Strength Index (RSI) is a momentum oscillator that measures the speed and change of price movements over a defined period. It outputs a value between 0 and 100, which helps traders determine whether an asset is overbought or oversold.
The default RSI setting uses a 14-period lookback window and is calculated with the following steps:
🔷Calculate the average gain and loss over the last 14 periods:
Average Gain = Sum of all gains over the past 14 periods / 14
Average Loss = Sum of all losses over the past 14 periods / 14
🔷Compute the Relative Strength (RS):
RS = Average Gain / Average Loss
🔷Apply the RSI formula:
RSI=100−(100/(1+RS))
The result is a single number between 0 and 100 that indicates the asset's momentum.
How to Use RSI in Trading Strategies
⚡️Overbought and Oversold Conditions Strategy
RSI > 70 typically signals that an asset may be overbought and due for a pullback.
RSI < 30 suggests the asset might be oversold, potentially primed for a bounce.
However, these levels aren’t absolute sell or buy signals. In strong trends, RSI can stay overbought or oversold for extended periods.
📈Long Trading Strategy Example:
1. Identify the major trend, to find the long trades it shall be uptrend. On the screen below you can see 1D time frame for BITMART:BTCUSDT.P .
2. Move to lower time frame (in our case 4h) and find the moment when RSI falls below 30. This is our oversold condition and we are going to look for long trade.
3. Find the local support zone and open long trade.
4. Take profit when price reaches resistance level next to the previous swing high
5. Don’t forget to put initial stop loss when enter position. The best stop loss which will give you 3:1 risk to reward ratio.
📉Short Trading Strategy Example
1. Identify the major trend, to find the short trades it shall be downtrend. On the screen below you can see 1D time frame for BITMART:ETHUSDT.P .
2. Move to lower time frame (in our case 4h) and find the moment when RSI grows above 70. This is our overbought condition and we are going to look for short trade.
3. Find the local resistance zone and open short trade.
4. Take profit when price reaches support level next to the previous swing low
5. Don’t forget to put initial stop loss when enter position. The best stop loss which will give you 3:1 risk to reward ratio.
⚡️RSI Breakout Strategy
RSI is breaking through 60 indicating bullish momentum shift if the long-term trend is bullish can be the potential long signal
RSI is breaking down 40 indicating bearish momentum shift if the long-term trend is bearish can be the potential short signal
This strategy works great only on the trending market, don’t use it on the range bounded market to avoid whiplashes.
📈Long trading strategy example:
1. Make sure that long-term trend is bullish. Use 200 period EMA as its approximation. If price remains above it we can look for potential long trade setup.
2. If RSI crossed above the level 60 open long trade.
3. Put the initial stop-loss under the signal candle’s low.
4. Take profit when price reached 3:1 risk-to-reward ratio.
📉Short trading strategy example
1. Make sure that long-term trend is bearish. Use 200 period EMA as it’s approximation. If price remains below it we can look for potential short trade setup.
2. If RSI crossed below the level 40 open short trade.
3. Put the initial stop-loss above the signal candle’s high.
4. Take profit when price reached 3:1 risk-to-reward ratio. In our case we received very fast and profitable trade
⚡️RSI Divergence Strategy
RSI can be used also as a trend reversal indicator if we are looking for divergences. This is very reliable sign of current trend weakness and great opportunity open trade against the trend. Usually it’s not recommended, but in case if divergence can be applicable.
Bullish divergence is the situation when price created the lower low, while RSI made the lower low. Usually, it indicates that current downtrend is weakening and we can look for long trades
Bearish divergence is the situation when price created the higher high, while RSI made the lower high. Usually, it indicates that current uptrend is weakening and we can look for short trades
😎Important hint: it’s rarely covered in textbooks about technical analysis, but in our opinion it’s better to used divergences when RSI was able to cross level 50 between two lows/highs.
📈Long trading strategy example
1. Find at the chart situation, when the price made the lower low
2. At the same time RSI shall set the higher low
3. RSI shall break level 50 between these lows indicating shift to the bullish momentum
4. If price failed to set the clean breakdown open long trade on the candle which set the lower low. Put stop loss under it’s low
5. Take profit at 3:1 RR. When you master this concept, you will be able to have much more RR trades, even 10:1. This is possible because when trend finish you have the highest potential upside
📉Short trading strategy example
1. Find at the chart situation, when the price made the higher high
2. At the same time RSI shall set the lower high
3. RSI shall break level 50 between these highs indicating shift to the bearish momentum
4. If price failed to set the clean breakout open short trade on the candle which set the higher high. Put stop loss above it’s high
5. Take profit at 3:1 RR. When you master this concept, you will be able to have much more RR trades, even 10:1. This is possible because when trend finish you have the highest potential upside
Conclusion
The Relative Strength Index (RSI) remains one of the most powerful and flexible tools in a trader’s technical arsenal — but its real value lies in how you use it.
We’ve explored three key RSI strategies:
✅ Overbought/Oversold setups offer simple entry signals in ranging markets, where price tends to revert to the mean.
✅ Breakout strategies unlock RSI’s momentum-tracking potential, helping you ride strong directional moves with confidence.
✅ Divergence detection reveals hidden shifts in market sentiment, giving you an early warning of possible reversals or trend continuations.
Each approach has its strengths — and its risks — but together, they offer a complete framework for using RSI across different market conditions
🔑 Key Takeaways:
RSI is not just a “buy low, sell high” tool — it’s a multi-dimensional indicator that adapts to trends, momentum, and market structure.
The best RSI signals come from confluence: combining RSI with price action, support/resistance, volume, or trend filters like moving averages.
Patience and discipline are essential — RSI signals are only effective when paired with proper risk management and confirmation.
By mastering RSI beyond the basics, you'll be better equipped to make timely, confident, and informed trading decisions — whether you're entering a pullback, chasing a breakout, or spotting the early signs of reversal.
BTC will....I know, i know.
"1mln $$$ till the end of the year" - i wish.
But the end is near!
The last PUMP from AUGUST till November!
11/06/2025

EUR/USD Bullish Reversal Setup – 1H ChartEUR/USD 1H Chart Setup:
The chart shows a potential bullish reversal setup after a downtrend. Entry is marked near 1.15867 with a target at 1.17953 and a stop loss set at 1.15092. The trade anticipates a strong upward move following the downward pressure.

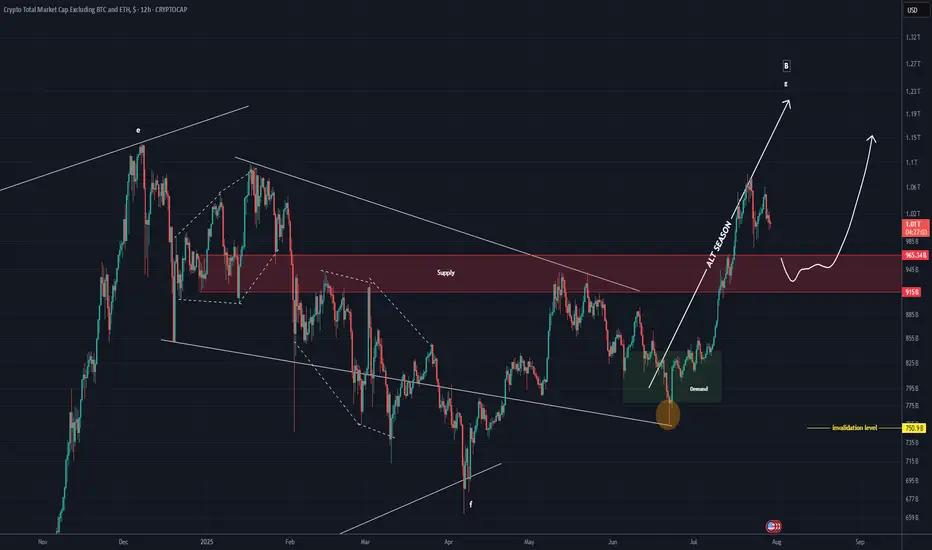
TOTAL 3 New Update (12H)This analysis is an update of the analysis you see in the "Related publications" section
This index has broken below the red zone; if a pullback to this area occurs, it may act as support again and the index could move upward
For risk management, please don't forget stop loss and capital management
Comment if you have any questions
Thank You
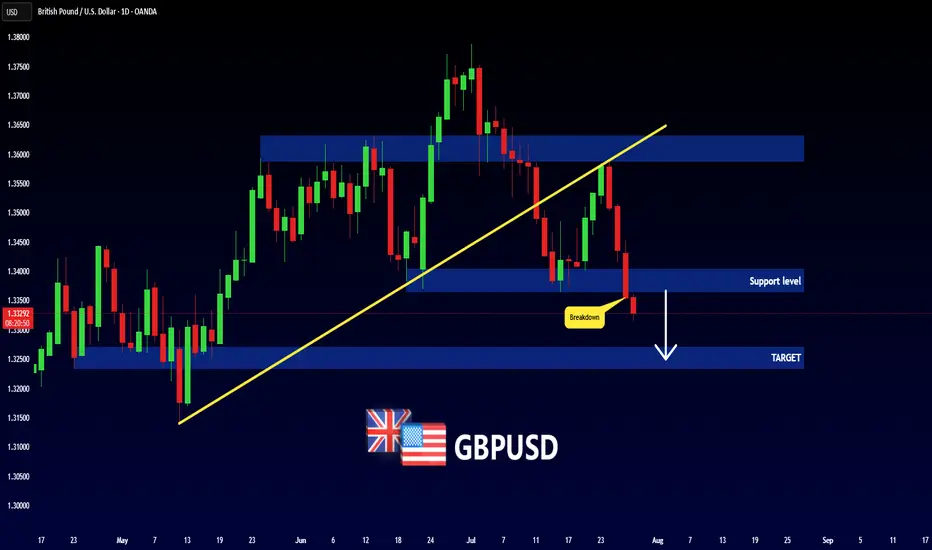
GBPUSD - NEW BREAKDOWN !Hello Traders !
The GBPUSD broke the support level (1.34037 - 1.33650).
This key level becomes new resistance!
So, I expect a bearish move📉
_______________
TARGET: 1.32710🎯
Gold Trade Plan 29/07/2025Dear Traders,
it time to recover Gold after Deep Correction ,
i expect price will be continue upward movement
with Target 1 : 3339
Target 2 : 3351
Target 3 : 3370
Regards,
Alireza!
